Compensation, Favoritism, and Adverse Selection - Essays on Managerial Incentives
in Firms
Inauguraldissertation zur
Erlangung des Doktorgrades der
Wirtschafts- und Sozialwissenschaftlichen Fakultät der
Universität zu Köln
2012
vorgelegt von
Diplom-Volkswirt Claus Ortwin Herbertz aus
Köln
Referent: Professor Dr. Dirk Sliwka
Korreferent: Professor Dr. Bernd Irlenbusch
Tag der Promotion: 03.02.2012
To Christina and Theodor
Preface
This dissertation came into being in the autumn of 2007, as I entered the Graduate School for Risk Management at the University of Cologne. At the same time, the Deutsche Forschungsgemeinschaft kindly granted me three years of generous support for my dissertation project. Let me …rst and fore- most thank my primary dissertation supervisor, Dirk Sliwka, for his great personal, academic and professional support. Over the last 4 years, he sup- ported good ideas, revealed bad ones and constantly gave me input by point- ing out subtle economic points or summarizing a bunch of papers in a sen- tence. Thank you Dirk!
Thanks also to my co-authors Johannes Berger, and Torsten Biemann for their great work, constant input of ideas and relentless criticisms. I am not exaggerating when I say that they substantially contributed to my thesis by their stimulating ideas and countless discussions.
I was very lucky to meet my colleagues Christof Wiechers, Frowin Schulz, Kathrin Breuer, Martin Ruppert, Miriam Breunsbach and Tobias Wickern at the Graduate School of Risk Management. During the last 4 years, I spent more time with them than with anyone else. Every single one of them taught me something and made my work more successful and my life more enjoyable.
Thanks to Christof for wasting evenings with music and thanks to Frowin
for his impeccable conscientiousness and discipline. Thanks to Kathrin for
unconditioned happiness and thanks to Miriam for taking care. Thanks to
Tobias for his cool temper and modesty and thanks to Martin for teaching
me to write down the problem …rst. I also want to mention people from the
2008 Graduate School class: Julius Schnieders, Stefan Erdorf, Konstantin
Glombek, Pavlo Bazovkin, Alwin Stöter and Nico Heinrichs. They enriched
my scienti…c landscape and made life in Graduate School much more vivid.
I also want to thank my colleagues at the chair of Personnel Economics, Anastasia Danilov, Patrick Kampkötter and Nannan Zhou simply for being helpful, inspiring and, if needed, patient. It was a great time with you!
Thanks to Björn Hartig and Felix Kölle for their superb work in joint teaching projects!
Thank you Alexander Creson, Behnud Djawadi, David Hirschfeld, Chris- tian Ruppert, Isabella Cetnarowski, Julia Sohn, Katharina Laske, Michael Lüttjohann, Philip Aminski, Thorsten Hormesch, Timo Vogelsang, Tobias Hinze and Ursula Schuh for your outstanding research assistance, IT-support and getting things done. I thank Bernd Irlenbusch, Gari Walkowitz, Julian Conrads, Miriam Mezger and Rainer Rilke for tough discussions and fruitful suggestions during our brown bag seminar. A special thanks goes to Bernd for being my second dissertation supervisor!
I thank the Great Place to Work Institute, namely Frank Hauser, Johanna Kirsch and Karsten Schulte, for an uncomplicated and successful research collaboration.
My friends Julian and Zsó… Orlishausen, Joachim and Nicole Horvath, Thomas Böttinger, Oliver Hennies and my family always provided me with the encouragement, support and care that I needed.
Last, but not least, I thank my wife Christina for her love, trust, patience
and care and my son Theodor, who taught me that even a doctoral thesis is
only one thing among many.
Contents
1 Introduction 1
2 Managerial Incentives and Favoritism in Promotion Deci-
sions - Theory and Field Evidence 7
2.1 Introduction . . . . 7
2.2 Related Literature . . . . 9
2.3 The Model . . . 11
2.4 Equilibrium Analysis . . . 12
2.5 Data and Hypotheses . . . 15
2.6 Results . . . 18
2.6.1 Managerial Incentives and Favoritism . . . 18
2.6.2 Robustness and Potentially Omitted Variables . . . 26
2.7 Conclusion . . . 29
2.8 Appendix to Chapter 2 . . . 30
3 When Higher Prizes Lead to Lower E¤orts - The Impact of Favoritism in Tournaments 35 3.1 Introduction . . . 35
3.2 The Model . . . 36
3.3 Equilibrium Analysis . . . 37
3.4 Conclusion . . . 41
3.5 Appendix to Chapter 3 . . . 42
4 Social Ties, Incentives and Adverse Selection 44
4.1 Introduction . . . 44
4.2 Design and Hypotheses . . . 47
4.3 Results . . . 51
4.4 Conclusion . . . 54
4.5 Appendix to Chapter 4 . . . 56
4.5.1 Tables and Figures . . . 56
4.5.2 Instructions . . . 58
5 Result-Based Sampling in Experimental Economics 62 5.1 Introduction . . . 62
5.2 Type I Error In‡ation in Statistical Hypothesis Testing . . . . 64
5.3 Simulation and Results . . . 66
5.4 Determinants of Type I Error In‡ation . . . 68
5.5 Discussion . . . 71
5.6 Power Analysis . . . 72
5.7 Conclusion . . . 74
5.8 Appendix to Chapter 5 . . . 75
Bibliography 75
List of Tables
2.1 The Relationship between Managerial Incentives and Favoritism 21
2.2 Ordered Probit Marginal E¤ects . . . 22
2.3 The Relationship between Managerial Incentives and Favoritism - Quadratic and Nonparametric Models . . . 25
2.4 The Relationship between Managerial Incentives and Favoritism - Controls I . . . 27
2.5 Descriptive Statistics of Variables on Firm Level . . . 31
2.6 Descriptive Statistics of Variables on Individual Level . . . 32
2.7 The Relationship between Managerial Incentives and Favoritism - OLS Analysis . . . 33
2.8 The Relationship between Managerial Incentives and Favoritism - Controls II . . . 34
4.1 2x2 Treatment Design . . . 49
4.2 Decision Player A . . . 51
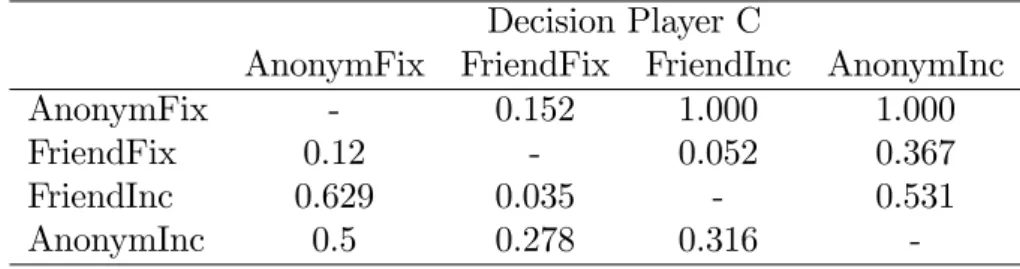
4.3 Decision Player C . . . 52
4.4 Decision Player A: p-values for a two sided (above diagonal) and one sided (below diagonal) Fisher exact Test between Treatments . . . 56
4.5 Decision Player C: p-values for a two sided (above diagonal) and one sided (below diagonal) Fisher exact Test between Treatments . . . 56
5.1 Simulated Type I Errors from Figure 5.3 . . . 75
5.2 Simulated Type I Errors from Figure 5.4 . . . 75
List of Figures
2.1 Probability that more able agents are promoted as a function of . Graphs for = 0:1 (solid), = 0:2 (dashed) and
= 0:4 (dotted). . . 15 2.2 Utilization of Performance related Pay across German Industries 17 2.3 Histogram of Proportions of positive Answers in Firms with
and without Manager PRP . . . 19 2.4 Histogram of Proportions of positive Answers in Firms with
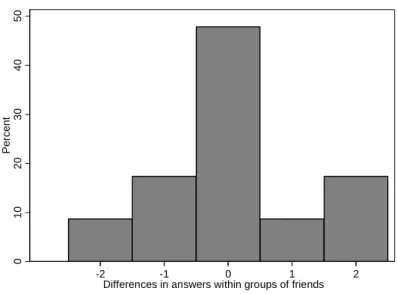
and without Manager Gain Sharing Plans . . . 19 4.1 A 2-Stage Pie Sharing Game . . . 48 4.2 The empirical Distribution of the Friendship Measure . . . 57 4.3 The empirical Distribution of Within-Group Di¤erences in
Friendship Measures . . . 57 5.1 The Simulation Process . . . 67 5.2 Histogram of p-values after …rst and second Sampling . . . 69 5.3
RBSin Dependence of the Sampling Threshold p
RBSand the
Number of Samplings k . . . 70 5.4
RBSin Dependence of the Sampling Threshold p
RBSand the
Number of Samplings k for a Mann-Whitney U Test . . . 76
Chapter 1 Introduction
In this thesis, we investigate how monetary incentive schemes in‡uence pro- motion and distribution decisions in the presence of favoritism.
In chapter 2, we theoretically analyze the relationship between manage- rial incentives and promotion quality in the presence of favoritism, stating that incentives crowd out favoritism and lead to better promotion decisions.
Testing this hypothesis empirically, we …nd a positive relationship between the use of managerial incentives and promotion quality in German …rms.
In chapter 3, we point out a drawback of high promotion prizes in tourna-
ments with favoritism: In the presence of favoritism supervisors gain utility
by awarding the tournament prize to their favored agent and are less likely
to promote the more able agent. For large prizes, this e¤ect outweighs the
incentive e¤ect of the tournament prize. Consequently, the agents’ e¤ort
declines in the prize. In chapter 4, we experimentally investigate favoritism-
induced selection e¤ects by forming 3-person groups with two friends and
an anonymous player in a distribution game. Anonymous players avoid the
distribution game, fearing harmful collaborations of the befriended partic-
ipants. Incentives for decision-makers partially crowd out favoritism and
the anonymous player enters the distribution game. Chapter 5 deals with a
methodological problem in experimental economics. It is a common practice
to conduct experimental sessions, evaluate the resulting data and conduct
further sessions if no signi…cant results are attained. We illustrate that this
approach leads to a Type I Error in‡ation and make suggestions for better experimental planning.
One core problem in contract theory is the alignment of goals in a prin- cipal agent setting. The principal wants the agent to supply e¤ort, whereas the agent does not want to exert costly and unobservable e¤ort once a con- tract is signed. Proper incentives mitigate the moral hazard problem by tying the agent’s compensation to an observable signal which consists of her unobservable e¤ort and a noise component.
1One key assumption is that a proper signal is contractible. Typically, this assumption is ful…lled in the
…eld if the agent’s output is quanti…able in terms of pieces produced, revenue raised, cars repaired or trees planted. Not surprisingly, in this environment, incentive schemes do a pretty good job in increasing worker productivity when compared to …xed wages (Lazear (2000) and Shearer (2004)). But es- pecially white-collar jobs often involve tasks which are di¢ cult to measure and make an objective performance evaluation too costly, if not impossible (Murphy and Cleveland (1995) and Prendergast (1999)). In this case, the pay for performance approach is not feasible in the simple form described above. This problem becomes even worse when an agent works on multiple tasks. For applying the optimal incentive scheme, not only one, but multiple signals are needed. If one or more signals are not feasible, the multi tasking problem applies and incentivizing a subset of tasks leads to the disregard of unincentivized tasks (Holmström and Milgrom (1991)).
One solution to this problem is the use of subjective performance evalua- tions by supervisors. Since a supervisor has a picture of an agent’s tasks and performance, her subjective evaluation should be a decent performance sig- nal. Though a fair subjective evaluation is not contractible, the agent might accept contracts involving subjective evaluations due to repeated interaction or the supervisor’s reputation or trustworthiness. Despite the fact that sev- eral …ndings point out the advantages of subjective performance evaluations (Baker et al. (1994) and Baiman and Rajan (1995)) there is a major draw- back: Supervisors have discretion in evaluating an agent’s performance. If
1
See Bolton and Dewatripont (2005) for an overview. For seminal contributions see f.i.
Jensen (1976), Grossman and Hart (1983) and Holmström and Milgrom (1987).
a supervisor is not the residual claimant, but is herself an agent, she might follow her own interests when evaluating subordinates, rather than report- ing her true expectations about the agent’s performance. Indeed, a couple of studies have pointed out political reasons as the primary determinant for subjective evaluations (Longenecker et al. (1987) and Bjerke et al. (1987)).
According to anecdotal evidence in Ittner et al. (2003), discretion in balanced scorecard systems leads to extreme forms of favoritism and arbitrariness by supervising managers.
Prendergast and Topel (1996) theoretically analyze this setting by intro- ducing favoritism in a LEN framework. Technically speaking, the supervisor gains utility from the well-being of her subordinates. This may lead to low- powered incentives for the subordinates, since higher powered incentives also strongly a¤ect the supervisor’s utility, and thus, lead to higher distortions in the evaluations.
In chapter 2, we apply the approach from Prendergast and Topel (1996) on job promotion tournaments. If a manager has preferences over agents, i.e., likes agent A more than agent B, she has a natural inclination not to promote the best, but the best liked agent. In the absence of managerial incentives, the manager will always promote her favorite agent. However, in the presence of incentives, the manager has to trade o¤ between utility from favoritism and utility from promoting the best performing agent. The likelihood of promoting the better agent increases with the incentives for the promoting manager. This theoretical result suggests a real world correlation between managerial incentives and promotion quality in …rms. Furthermore, the model suggests that in the presence of weak or moderate favoritism, low managerial incentives already have a substantial impact on promotion qual- ity. Medium or high managerial incentives only slightly increase the promo- tion quality compared to low incentives. Hence, the model predicts similar correlations for promotion quality with low, medium and high managerial incentives.
We empirically test these predictions with a representative employer-
employee matched database containing 36,000 employee survey observations
from 305 …rms. In addition to the survey, the dataset contains …rm-level in-
formation about compensation and HR practices in the respective …rms. We measure promotion quality by employees’degree of agreement to the state- ment "Promotions go to those who best deserve them" on a 5-point Likert scale. As explanatory variables, we use the existence and strength of man- agerial performance related pay and the utilization of gain sharing plans.
The ordered probit regression reveals that in …rms using performance related pay (gain sharing plans) for their managers, employees are 8.3% (8.8%) more likely to have a positive opinion about their …rm’s promotion policy. To test the second theoretical prediction, we regress promotion quality on 3 dummy variables, which capture whether the variable pay component in a …rm makes up 1-10%, 10-20%, or more than 20% of a manager’s total compensation. As theoretically suggested, …rms which pay 10-20% or more than 20% of their managers’compensation by variable components do not have a higher per- ceived promotion quality compared to …rms which only pay 1-10% in variable terms.
In chapter 3, we use a theoretical setup similar to that of chapter 2 to analyze the impact of favoritism on the agent’s e¤ort supply in promotion tournaments. As we already show in chapter 2, favoritism distorts the pro- motion decision to the favor of the more liked agent and reduces the winning chances of the less liked agent. Lower winning chances lead to lower e¤ort supply by the less liked agent. The favored agent anticipates her competi- tor’s rationale and also lowers her e¤ort. This e¤ect is already known from tournaments with favorites and underdogs. Once a player has a winning margin, the underdog reduces e¤ort, and consequently, the favorite reduces her e¤ort also.
2Di¤erent to the standard case, the winning margin is not constant, but is increasing in the tournament prize if favoritism is in place.
Since the supervisor gains from the favored agent’s utility, high tournament prizes lead to a stronger promotion distortion and an even bigger advantage for the favored agent. The higher the prize, the higher the distortion by the supervisor, and the lower is the winning chances for the less liked agent.
2
Note that from the experimental point of view, underdogs regulary supply substan-
tially more e¤ort than theoretically predicted. (Bull et al. (1987), Schotter and Weigelt
(1992) and van Dijk et al. (2001))
If this e¤ect is stronger than the pure incentive e¤ect of the higher prize, agents’ e¤ort decrease in the tournament prize. Our results suggest, that in the presence of favoritism and subjective performance evaluations, high tournament prizes might back…re with low e¤ort supply.
The models described in chapter 2 and chapter 3 abstract from agents’
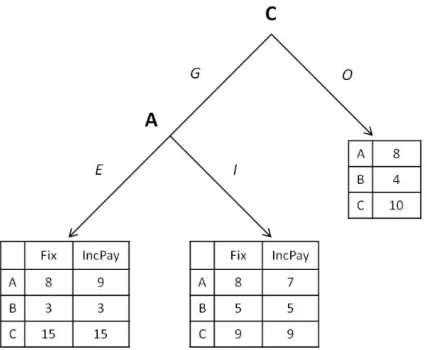
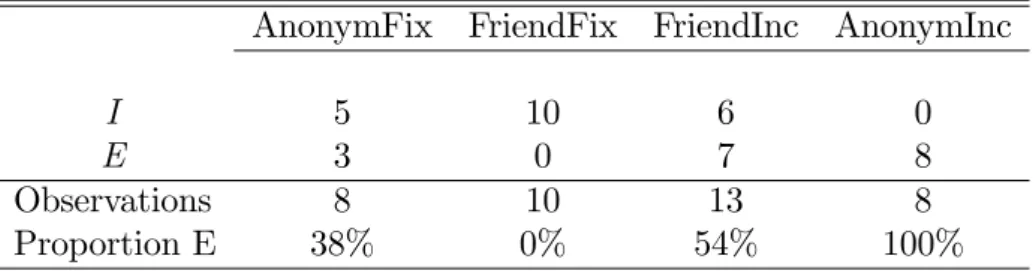
participation constraints. Disfavored agents have no possibility of leaving the tournament or the company. In a wider approach with strong favoritism or low job search costs, agents might react to favoritism by quitting jobs. An example for strong favoritism or even primogeniture are family …rms in which family members are often promoted quicker and receive higher wages than non-family members (Pérez-González (2006)). If promotions are quicker due to family a¢ liation, non-family members have lower chances in promotion tournaments and might leave the company. However, incentivizing e¢ ciency- centered decisions might reduce favoritism in these organizations and encour- age non-favored agents to enter, or not to leave the company. In chapter 4, we follow this idea in the laboratory. We use a 2-stage 3-player game in which an unrelated anonymous Player A has to decide whether to enter a distribution game or to take an outside option. If she enters the game her payo¤ depends on the goodwill of Player C, who distributes money between Player A and Player B. If Player C and Player B are friends and Player C re- ceives a …xed wage for her decision, Player A refrains from entering the game because of favoritism. She is right in doing so, since Player C strongly favors her friend in the distribution decision. However, incentivizing Player C for choosing an e¢ cient allocation crowds out favoritism and Player A is more inclined to enter the game. The results suggest that unrelated agents antici- pate the incentive structure in organizations and expect e¢ ciency enhancing incentives to reduce favoristic behavior.
Chapter 5 deals with a practice in experimental economics which we name
result-based sampling (RBS). Experimenters often conduct experiments in
period 1, explore their data and decide upon on the basis of their …ndings how
to proceed. If they …nd signi…cant results, they often …nish the experiment
and aim for publication. If the data does not show up the suggested results,
they abort the project. However, if results are close to signi…cance, many
researchers increase their sample size by conducting further sessions in period 2. The guiding principle behind this approach is that the treatment e¤ect in question might be too small for detection with the current sample size, but may be detected with an increased sample. This argument is valid at
…rst glance, since increasing the sample size indeed reduces the likelihood of not rejecting the null hypothesis when the null hypothesis is indeed false.
But RBS has a crucial drawback: Given the null hypothesis to be true, 5% of all researchers come out with wrong positive results after period 1.
Some of the remaining 95% of researchers apply RBS, increase their sample
size in period 2 and gain signi…cant results. Summing up signi…cant results
from the …rst and the second period shows that substantially more than
5% of all projects end up with wrong positive results. Under reasonable
assumptions and a signi…cance level of 5%, RBS leads to a Type I Error of
7-8%. To overcome RBS, we propose to determine a target sample size before
conducting experiments. If the target sample size is reached the experimenter
should not further increase the sample size, because this would lead to a Type
I Error in‡ation.
Chapter 2
Managerial Incentives and Favoritism in Promotion
Decisions - Theory and Field Evidence 1
2.1 Introduction
In most jobs work performance is not perfectly re‡ected in objective perfor- mance measures. As a consequence superiors are often asked to rate their subordinates subjectively, which gives them the possibility to favor one sub- ordinate over another. As a consequence, performance appraisals may be biased, not re‡ecting actual work performance but the supervisor’s personal preferences for her subordinates. If internal promotion decisions are based on subjective performance appraisals, favoritism may eventually result in not promoting the best but those who are best liked.
To avoid favoritism, pay and promotions are sometimes solely determined by seniority and other bureaucratic rules which of course also bear the risk of poor promotion decisions (Prendergast and Topel (1996), Marsh (1960)).
Another solution has been suggested by Prendergast and Topel (1993) who
1
This chapter is based upon Berger et al. (2011).
claim that “a means of aligning the supervisor’s incentives with those of the organization is to tie rewards to promotion and to make the supervisor responsible for the output of the job to which his subordinates are promoted ” (Prendergast and Topel (1993), p. 360).
In this paper we investigate this idea in detail and analyze the relation- ship between managerial incentives and promotion decisions. First, we the- oretically explore the e¤ect of favoritism on managers’promotion decisions.
Favoritism indeed leads to poor promotion decisions as the more able subor- dinate is less likely promoted. Workers anticipate their superior’s bias and reduce e¤orts in promotion tournaments. Thus favoritism not only harms the company ex-post by putting the wrong people into management positions but it also reduces e¤ort supply and therefore expected company earnings ex- ante. Tying the manager’s salary to workers’performances makes favoritism costly and leads to better promotion decisions.
To test the theoretical predictions, we use a unique employer-employee matched data set collected on behalf of the German Federal Ministry of La- bor and Social A¤airs by the Great Place to Work Institute, a company specialized in conducting employee surveys, in 2006. The dataset is a repre- sentative sample of 305 German …rms containing company-level information on management practices. In addition, in each of the …rms an employee- survey has been conducted, containing detailed information about employee perceptions of approximately 36,000 individuals. In contrast to researchers who try to assess promotion quality as an outsider to the …rm, employees have inside knowledge and are in a good position to judge whether indeed the best people are promoted. We thus focus on a standardized item contained in the employee-survey which measures whether "promotions go to those who best deserve them".
Indeed, we …nd that the quality of promotion decisions is signi…cantly higher in …rms which use managerial incentive schemes. Furthermore, the data suggest that even lower powered incentive schemes su¢ ce to reduce favoritism in promotions which is in line with the theoretical prediction.
The remainder of the paper is organized as follows. In the next section
we summarize the related literature. In sections 2.3 and 2.4 we theoretically
derive predictions on the consequences of managerial pay for promotion de- cisions. Section 2.5 describes our dataset and the main variables used for the empirical analysis. Section 2.6 includes the main empirical results while section 2.7 discusses obtained results and summarizes our main …ndings.
2.2 Related Literature
The role of favoritism and social connectivity in …rms has gained considerable attention in theoretical economic research in recent years. Prendergast and Topel (1996) were among the …rst who analyze how personal preferences to- wards employees may lead to favoritism and biased performance appraisals.
In their model supervisors derive utility from biasing performance appraisals according to individual preferences. Favoritism then leads to a misallocation of workers to jobs and higher powered worker incentives aggravate this prob- lem. Prendergast (2002) extends this framework and shows that noisy en- vironments reduce favoritism-induced distortions. Fairburn and Malcomson (2001) illustrate that bribery-induced favoritism o¤sets the e¤ect of mone- tary bonus schemes and suggest job promotion tournaments to mitigate the incentives to bribe and thus reduce favoritism.
A couple of studies empirically investigate the harmful in‡uence of fa- voritism. Longenecker et al. (1987) and Bjerke et al. (1987), for instance, examine determinants of performance evaluations in a US company and the US Navy respectively. Both studies claim that political considerations rather than true performance are re‡ected in subjective evaluations. This is espe- cially true if performance appraisals are tied to bonuses. Ittner et al. (2003) analyze a balanced scorecard bonus plan which is based on supervisors’sub- jective evaluations. Even if …nancial measures for evaluating subordinates are available, supervisors’discretion leads to strong favoritism in employees’
bonus payments in the studied company and …nally to the abolishment of the scorecard. Breuer et al. (2010) analyze personnel data from a call cen- ter organization arguing that social ties triggered by repeated interaction or small team size lead to biased performance evaluations by supervisors.
Several other studies have examined resta¢ ng decisions in the presence
of family ties, which can be seen as a prominent case of favoritism in …rms.
Pérez-González (2006) report a faster career as well as higher wages for fam- ily members in family …rms. Kramarz and Skans (2007) …nd that young Swedish men frequently work in their father’s plant while having higher ini- tial wages and worse school grades than comparable colleagues. Bennedsen et al. (2007), Pérez-González (2006) and Vilallonga and Amit (2006) also
…nd that CEO family succession leads to a signi…cant drop in family …rm performance displaying the ine¢ ciencies caused by favoritism in succession and promotion politics.
2While the existence and negative in‡uence of favoritism is well docu- mented, possible remedies for it are less intensely studied. One important exception is Bandiera et al. (2009) who analyze an exogenous change from a
…xed wage to a bonus scheme for supervisors in a large agricultural company.
Under …xed wages managers favor socially connected workers by granting them a stronger support which leads to a large productivity gap between socially connected and socially unconnected workers. When supervisors re- ceive a bonus based on workers’output they reallocate their support towards high ability workers, causing a signi…cant overall increase in productivity. In this paper we show that higher powered managerial incentive pay also sub- stantially a¤ects the quality of promotion decisions and we provide empirical evidence based on a large and representative sample of …rms.
Finally, by combining survey data on management practices with more objective information across larger samples on di¤erent …rms, our paper adds to the emerging literature on investigating key issues in personnel economics and the economics of organizations as for instance recently advocated in (Bloom and Van Reenen, 2007, 2010).
2
Two exceptions to these …ndings are Sraer and Thesmar (2007) and Anderson and
Reeb (2003) who report a positive correlation between performance and the presence of
family CEOs.
2.3 The Model
We consider a 3-stage model with a top manger M and two heterogeneous agents i = A; B competing for a middle manger position. In the …rst period, agents choose an unobservable e¤ort level e
i1and produce outputs
s
i1= a
i+ e
i1+ "
i1(2.1) where a
iN (m
a;
2a=2) denotes agent i’s time invariant and unknown abil- ity. The error term is also normally distributed with "
i1N (0;
2"=2). We assume a
iand "
i1to be independent and their distributions to be common knowledge. Providing e¤ort yields e¤ort costs
2ce
2i. All players are risk neu- tral. Period 1 pro…t is given by
1
= s
A1+ s
B1:
In period 2 top manager M observes performance signals s
i1and chooses which agent 2 f A; B g is to be promoted to the middle manager position.
The promoted agent receives a wage increase w.
In period 3, agents choose their e¤ort level e
i3, again produce s
i3= a
i+ e
i3+ "
i3and generate company pro…t
3
= k s
3+ s
3(2.2)
where s
3and s
3are the outputs of the promoted and non-promoted agent.
With k > 1, we assume a middle manager’s performance to have larger impact on company pro…t as the non-promoted agent.
The agents’ utilities are simply the sum of their expected wages minus their e¤ort costs. They receive no …x wage component. M ’s wage is given by + (
1+
3) where is a …xed wage and measures the extent of pro…t sharing. Finally, we assume that the top manager may personally like the two agents to a di¤erent extent and therefore favor one over the other.
Similar to Prendergast and Topel (1996) and Prendergast (2002) she receives
a utility from favoritism of w such that the wage increase w awarded
to the promoted agent is weighted with a preference parameter
i. Hence, her overall utility is
+ (
1+
3) + w:
We assume M ’s discount factor to be 1 and
ito be known by all players.
Furthermore, we take all compensation parameters with the exception of as given and focus on the connection between and promotion decisions.
2.4 Equilibrium Analysis
We now determine the Perfect Bayesian Equilibrium. In the absence of in- centives, agents choose zero e¤ort in stage 3 and produce according to their ability (see equation 2.2). In stage 2 top manager M ’s conditional expected utility for 2 f A; B g depends on the agents’period 1 performance signals s
A1and s
B1and is given by
V
M( ; s
A1; s
B1) = E +
3+ w j s
A1; s
B1= + k E [a j s
1] + E [a j s
1] + w:
Hence, M promotes agent A if V
M(A; s
A1; s
B1) V
M(B; s
A1; s
B1) or E [a
Aj s
A1] E [a
Bj s
B1] w
(k 1) (2.3)
where =
B A. In the absence of favoritism ( = 0) the rhs in
equation 2.3 is zero. In this case, M ’s decision is solely driven by her expec-
tations about agents’abilities and the agent who is expected to be more able
gets promoted. The model then basically boils down to a standard Lazear
and Rosen (1981) type tournament model. Furthermore, pure ability based
promotion decisions maximize the company’s third period pro…ts in equa-
tion 2.2. If, however, favoritism matters, M gains additional utility from
promoting the favored agent. The more M favors an agent, the more likely
her promotion decision will not coincide with the pro…t maximizing decision.
Furthermore, the higher the smaller this distortion will be which leads to the …rst result:
Proposition 1 Higher powered incentive schemes reduce the manager’s in- clination to follow her private preferences in the promotion decision.
Anticipating M ’s decision in 2.3 agent A’s expected utility is given by U
A= Pr E [a
Aj s
A1] E [a
Bj s
B1] w
(k 1) w c
2 e
2A1: The conditional expectation about agent i’s ability is given by
E [a
ij s
i1] = m
a+
2 a
2a
+
2"(a
i+ e
i+ "
i1m
ab e
i1) (2.4) where b e
i1denotes M ’s belief about agent i’s equilibrium e¤ort choice.
3Sub- stituting M’s conditional expectation into agents’objective function yields
EU
A= 0
@ e
A1e
B1b e
A1+ b e
B1 (k 1)w 2a+2 2"p
2 aa
+
2"1
A w c 2 e
2A1where ( ) is the c.d.f. of the standard normal distribution. If an internal equilibrium exists
4, the agents’optimal symmetric e¤ort choices are therefore given by
e
A;B= w
c p
2 (
2a+
2") exp
2
w
22
2(k 1)
2(
2a+
2")
4a
: (2.5)
From this equation we directly obtain our second result:
Proposition 2 The agents’ equilibrium e¤ort levels are strictly decreasing in the degree of favoritism j j and strictly increasing in the power of man- agerial incentives .
3
For the conditional expectation of normally distributed random variables see for in- stance DeGroot (1970) p. 167.
4
Existence can be assured when c is su¢ ciently large as the objective functions are
then strictly concave.
Favoritism towards subordinates does not only reduce future pro…ts as on average less able agents are promoted. It also lowers ex-ante pro…ts as the agents anticipate that promotion decisions are not entirely driven by per- formance considerations. This mechanism weakens the link between perfor- mance and rewards and, in turn, makes exerting high e¤orts less attractive.
To illustrate the relationship between managerial incentives and promo- tion quality we derive the ex-ante probability of promoting the more able agent. Assume w.l.o.g. that > 0; i.e., agent B is favored by M . The likelihood that indeed the agent is promoted who is expected to be more able is given by
1 Pr 0 < E
an[a
Aj s
A1] E
an[a
Bj s
B1] < w (k 1) :
Inserting the conditional expectation (2.4) and simplifying yields that in equilibrium this probability is equal to
3
2 Pr a + " <
2 a
+
2"2a
w (k 1) :
As from an ex-ante perspective a + " is normally distributed with mean 0 and variance 2
2a+ 2
2"this probability is
3 2
1 2
2aw
(k 1) : (2.6)
The function is monotonically increasing in but becomes ‡at if is su¢ - ciently large.
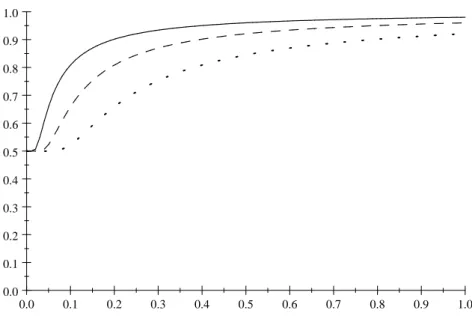
5Figure 2.1 displays plots of function (2.6) for di¤erent degrees of favoritism .
6Note that even very low powered incentive schemes su¢ ce to generate substantial e¢ ciency gains when is not too large. Of course, when the impact of favoritism is large, higher values of become necessary to reduce the bias.
5
Note that lim
!1@ 32 2 21
a w (k 1)
@
= 0.
6
Figure 2.1 shows graphs for w = 10; k = 3 and
2a= 5 and = 0:1; 0:2; or 0:4.
0.0 0.1 0.2 0.3 0.4 0.5 0.6 0.7 0.8 0.9 1.0 0.0
0.1 0.2 0.3 0.4 0.5 0.6 0.7 0.8 0.9 1.0
Figure 2.1: Probability that more able agents are promoted as a function of . Graphs for = 0:1 (solid), = 0:2 (dashed) and = 0:4 (dotted).
2.5 Data and Hypotheses
Our data source is a 2006 employer-employee matched survey conducted by the Great Place to Work Institute and the German Federal Ministry of Labor and Social A¤airs. The dataset is a representative sample of 305 German
…rms employing a minimum of 20 workers. For each …rm the management provided company-level information on organizational facts, strategic goals and corporate values as well as on various management practices and the structure of compensation. Most of this information is provided separately for managers and workers in each …rm.
7In addition to this …rm-level information, a representative employee- survey was conducted in each sampled …rm yielding over 36,000 observations in total. The employee survey includes 58 standardized items to be answered on a 5-point Likert scale which are designed to measure the level of trust, pride, and cooperation within …rms. More precisely the items focus on the
7
More speci…cally, answers were provided for employees in supervisory function and
the largest group of nonmanagerial employees, i.e. the core occupational group.
relationship among employees, between employees and management, and on the work environment.
Due to the random sampling process the 305 …rms are almost evenly spread across the di¤erent industries in Germany. The majority of the sam- pled …rms are small or medium sized. While the average number of employees is 430, the median lies at 157. However, roughly 10% of the …rms employ more than 1,000 workers including the largest …rm in the sample with 14,000 workers.
The management survey includes detailed information on the structure of incentive pay in each …rm. Each management representative stated whether wages for managers and workers in the corresponding …rm include a perfor- mance related pay component. For both, managers and workers, we know the share of the average wage (in %) determined by performance related pay (henceforth PRP).
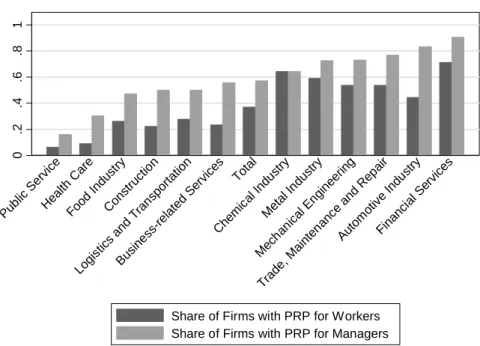
8Figure 2.2 gives a descriptive overview of PRP usage across industries displaying the share of …rms using PRP for managers and workers. While only less than half of all sampled …rms use variable pay components for workers, the use of manager PRP varies from only 16% in the public sector to 90% in …nancial services. In total 168 out of 296 (57%) …rms use PRP for their managers.
9In addition to the information on the strength of performance related pay components, the management survey also includes information on whether there is a gain sharing scheme or managers hold company assets. In contrast to manager PRP, this information is only provided as a binary variable which we label as Manager Gain Sharing. 36 out of 295 (12%) …rms used such gain sharing plans for their managers. Together with manager PRP this variable will serve as our main independent variable in the upcoming analysis.
108
To be precise, the items are “Does the compensation of the employees encompass a performance-based part? (yes/no)”and “How big is the variable share on average (in %)”
and “What are the shares of the following measures of success in this variable compensation component ? (company success, success of the organizational unit (team, working group), personal performance, or other)” . It is important to note that this does not refer to the actual payments in the studied year but the general structure of the compensation scheme.
9
9 out of the 305 sampled …rms did not provide information on PRP.
10
Note that manager PRP and manager gain sharing are two di¤erent ways of tying man-
0.2.4.6.81
Pub lic Service
Health Care
Food Indust ry
Constructio n
Logis tics
and Tran sportation
Busine ss-related
Services Total
Chemic al Indu
stry
Metal In dustry
Mech anical
Engineering
Trade , Mainten
anc e and Rep
air
Autom otive
Indu stry
Financi al Se
rvices
Share of Firms with PRP for Workers Share of Firms with PRP for Managers
Figure 2.2: Utilization of Performance related Pay across German Industries
Typically, it is very hard to assess the quality of promotion decisions empirically. One reason is that the counterfactual, i.e., the performance of the non-promoted employees on the considered position is never observable.
Furthermore, personnel records such as personal assessments or employees’
past performances (data that are usually hard to obtain) may not reveal which candidate best meets the requirements for the speci…c position to be
…lled. However, employees in a company are in a good position to judge whether indeed the best people are promoted.
Complementing the …rm level information provided by the management, we therefore exploit the employee surveys conducted in each …rm to mea- sure the quality of promotion decisions.
11The survey item “Promotions go to those who best deserve them” measures the perceived promotion quality
agers’pay to company performance. The two variables show only a weak and insigni…cant correlation of r = 0:07.
11
In …rms with less than 500 employees all employees were asked to participate. In
larger …rms a representative 500-employee sample was drawn. For sampling details see
Hauser et al. (2008).
within a …rm. The item is to be answered on a 5-point Likert scale ranging from 1 “almost always untrue” to 5 “almost always true” and refers to the company as a whole.
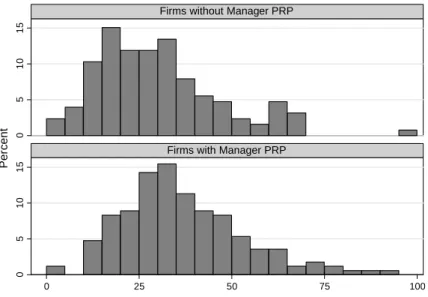
Figure 2.3 shows the distributions of the proportion of employees per
…rm who agree with the statement “Promotions go to those who best deserve them”(by having chosen a 4 or a 5 (Top Boxes) on the Likert scale). The up- per (lower) panel illustrates the distribution for …rms without (with) manger PRP.
12According to the Wilcoxon/Mann-Whitney rank-sum test the data do not stem from the same distribution (p = 0:000). The descriptive evi- dence for …rms with and without manager gain sharing plans in …gure 2.4 looks similar. Again we can reject the null hypothesis that data come from the same distribution (p = 0:000). These patterns of empirical distributions are in line with our theoretical prediction, suggesting that the quality of pro- motion decisions is indeed higher when …rms provide monetary incentives for their managers.
In section 2.6 we test this prediction by running ordered probit regres- sions. The existence and strength of managers’pay for performance and the existence of gain sharing plans are our main explanatory variables. In section 2.6.2 we address …rm heterogeneity by using detailed …rm-level information about human resource and management practices and demographic informa- tion. Tables 2.5 and 2.6 in the Appendix display descriptive statistics for all variables on the …rm and individual level.
2.6 Results
2.6.1 Managerial Incentives and Favoritism
In this section we estimate the relation between managerial incentives and our measure of promotion quality controlling for key …rm and employee charac- teristics. Since employees stem from 305 …rms, we cluster the standard errors on …rm level. The results of the ordered probit regression are presented in
12
Since employees’ answers are not independent, we aggregate on …rm level to report
descriptive statistics.
051015051015
0 25 50 75 100
Firms without Manager PRP
Firms with Manager PRP
Percent
Top Boxes: Promotions go to those who best deserve them
Figure 2.3: Histogram of Proportions of positive Answers in Firms with and without Manager PRP
0510152005101520
0 25 50 75 100
Firms without Manager Gain Sharing
Firms with Manager Gain Sharing
Percent
Top Boxes: Promotions go to those who best deserve them
Figure 2.4: Histogram of Proportions of positive Answers in Firms with and
without Manager Gain Sharing Plans
table 2.1. Starting with a basic model we successively add further controls.
In column 1 we regress the survey item on a dummy indicating whether a
…rm provides performance related pay to its managers and a set of stan- dard …rm controls including two …rm size dummies, 11 industry dummies, and a dummy indicating whether a …rm has established a works council.
13Manager PRP is positively related to the measure of promotion quality, so employees in …rms with manager PRP are signi…cantly more likely to state a very strong agreement with the item “Promotions go to those who best deserve them ” and signi…cantly less likely to state a strong disagreement.
In column 2 we alternatively use the presence of a manager gain sharing plan as explanatory variable and again …nd a highly signi…cant and positive coe¢ cient. Moreover, when including both explaining variables in speci…ca- tion (3), coe¢ cients remain stable in statistical signi…cance, indicating that both are separately related to the quality of promotion decisions, i.e., …rms which use both instruments have a higher perceived quality of promotions as compared to …rms which use only one of them.
1413
According to German law, …rms are obliged to set up a works council when this is demanded by employees.
14
There is no detectable interaction e¤ect between manager PRP and manager gain
sharing when an interaction term is included.
Dep ende n t V ar iable "P romotions g o to th ose who b est de serv e th em" Or d er ed Pr ob it P rob it (1) (2) (3) (4) (5) Man ag er PRP 0. 254*** 0. 250*** 0. 241*** 0.0 828*** (0. 0560) (0. 0571) (0.05 93) (.0 218) Man ag er G ain S . 0 .217** 0. 209** 0. 241*** 0.0 972 *** (0. 0958) (0. 0941) (0.0 828) (.0 292) In te rn al Sta¢ ng (%) 0. 00105 0.0 00485* (0. 000650) (.0 00256 ) W ork s Coun cil -0.163* ** -0.165* ** -0.166* ** -0 .145*** -0.0516 *** (0. 0509) (0. 0526) (0. 0488) (0.04 60) (.0 184) So cio econ omi cs No No No Y es Y es Obse rv ations 2 8,373 2 8,373 2 8,373 25, 917 25, 917 Cluste rs (F irms) 294 294 294 2 74 274 Chi
2517. 2 431. 2 550. 9 924.6 771. 6 Ps eud o R
20.0 2 0.0 2 0.0 2 0.03 0.0 5 *** p < 0.0 1, ** p < 0.0 5, * p < 0.1 , cl u stered stand a rd er ror s on … rm lev el in p ar en the ses Column 1-4: O rdered Probit re gr ession, column 5: Probit re gr ession, marg in a l e¤ ec ts F u rthe r con trol s: 2 … rm si ze d ummies and 1 1 in dus tr y du mmies So cio econ o mic s inc lu de te n u re , sex, o ccup at ional st atus , job ty p e (blue coll ar, white co llar ) Ref erenc e category : full-ti me emp lo y ee in a small … rm (0-99 emp lo y ees) in th e fo o d in du str y T a b le 2 .1 : T h e R el a ti o n sh ip b et w ee n M a n a g er ia l In ce n ti v es a n d F a v o ri ti sm
Probab ilit y of P romotion Qualit y (P Q ) Pr(PQ= 1) Pr(PQ= 2) Pr(PQ =3) Pr( P Q =4) Pr( P Q =5) Marginal E¤ ects for Col u mn 1 Dumm y Manager P RP -0.0520 -0.0379 0. 00276 0 .0607 0 .0265 Dumm y Manager Gai n S. In te rn al Sta¢ ng (%) W ork s Coun cil 0. 0299 0. 0251 0. 00368 -0.039 0 -0.01 96 Marginal E¤ ects for Col u mn 2 Dumm y Manager P RP Dumm y Manager Gai n S. -0.0382 -0.0335 -0.0075 6 0 .0515 0 .0277 In te rn al Sta¢ ng (%) W ork s Coun cil 0. 0303 0. 0253 0. 00377 -0 .0394 -0.02 00 Marginal E¤ ects for Col u mn 3 Dumm y Manager P RP -0.0511 -0.0374 0. 00265 0 .0599 0 .0260 Dumm y Manager Gai n S. -0.0367 -0.0324 -0.0070 7 0 .0498 0 .0263 In te rn al Sta¢ ng (%) W ork s Coun cil 0. 0303 0. 0256 0. 00381 -0.039 7 -0.01 99 Marginal E¤ ects for Col u mn 4 Dumm y Manager P RP -0.0472 -0.0371 0. 00160 0 .0585 0 .0242 Dumm y Manager Gai n S. -0.0397 -0.0381 -0.0105 0 .0582 0 .0301 In te rn al Sta¢ ng (%) -0 .000196 -. 0000165 -8 .053e-06 0. 000257 0. 000112 W ork s Coun cil 0. 0255 0. 0229 0. 00361 -0.035 3 -0.01 67 Or d ered pro b it mar ginal e¤ ects column 1-4, ta b le 2.1 T a b le 2 .2 : O rd er ed P ro b it M a rg in a l E ¤ ec ts
In speci…cation (4) we control for the socioeconomic background (tenure, age, and education) and the percentage of managerial positions …lled inter- nally (Internal Sta¢ ng), since higher internal sta¢ ng quotas may be corre- lated with our explaining variables and cause an upward bias in the respec- tive answers. While we see that manager gain sharing plans as well as higher internal sta¢ ng quotas are also signi…cantly positively related to higher pro- motion quality, the coe¢ cient of our main variables of interest remains stable and highly signi…cant. Table 2.2 shows the ordered probit marginal e¤ects of the estimates from column 1-4 in table 2.1. The bottom panel in table 2.2 shows that employees in …rms which apply manager PRP, are 2.4% (5.9%) more likely to choose 5 (4) on the Likert scale and are less likely to make negative statements (choose 1 or 2). Similar, employees in …rms with man- agerial gain sharing plans are 3.0% (5.8%) more likely to make the respective statement.
To develop a more intuitive way for evaluating the economic signi…cance of the relationship in question, we dichotomized the dependent variable and created a dummy variable which has value 1 if an employee chooses one of the two highest levels of agreement to the statement that promotions go to those who best deserve them. We regress this dummy on the explanatory variables from the speci…cation in column 4 in table 2.1 in a simple binomial probit regression model. Column 5 in table 2.1 shows the marginal e¤ects of the binomial probit estimation.
15A worker is 8.3% more likely to agree that promotions are based on merit if her …rm uses manger PRP and a further 9.7% more likely when manager gain sharing is used.
But what does this increase in probability mean for a …rm? To obtain an additional economic interpretation we aggregate the data and run an OLS regression on …rm level with explanatory variables from table 2.1, column 1-4.
The percentage of employees who agree that promotions are based on merit (i.e., ticking 4 or 5) serves as dependent variable. The results are shown in the Appendix in table 2.7. In …rms with manager PRP (manager gain sharing plan) 5.7% (6.7%) more employees have a positive opinion about their …rm’s
15
Running linear models on the discrete outcome variable, as considered by Angrist and
Pischke (2009), yields similar results.
promotion practice.
16The predicted fraction of employees agreeing to that statement at the mean of all other explanatory variables is equal to 30.7%
(33.3%) when there is no manager PRP (gain sharing). This rate increases to 36.4% (40%) when manager PRP (gain sharing) is applied. Overall, in …rms which apply one or both instruments, substantially more employees believe that promotions are based on merit.
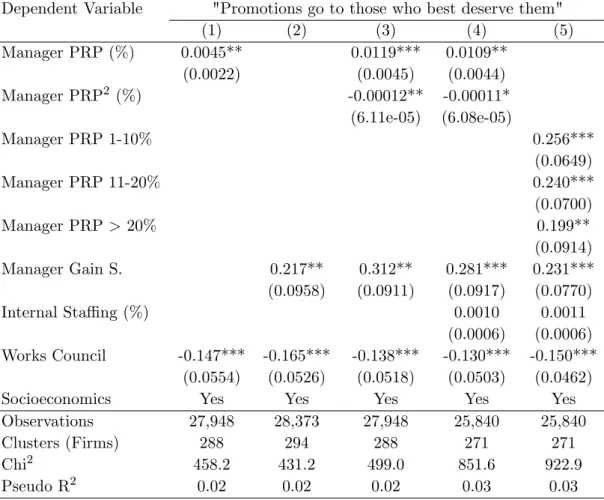
In the next step we consider the e¤ect of the strength of managerial incen- tives. The key independent variable is now the average percentage of manager PRP. The theoretical model in section 2.3 predicts that higher managerial incentives should lead to less favoritism. However, as indicated by …gure 2.1, for higher manager PRP, additional gains in promotion quality should decline in the size of manager PRP. For instance, when preferences for favoritism are not too strong, already weak managerial incentives lead to good promotion decisions. Any further increase in managerial incentives may provide only little further improvement.
In table 2.3 we therefore regress our main dependent variable on the strength of manager PRP (column 1 & 2). In column 3 we include a squared term, while column 4 includes 3 interval dummies for the strength of manager PRP with the reference category being …rms without manager PRP.
The coe¢ cients in columns 1 & 2 in table 2.3 again indicate a positive relationship between the two incentives schemes and the likelihood of a pos- itive statement. The negative and signi…cant square term in column 3 and 4 indeed reveals decreasing returns to performance pay. In column 5 we use dummies for …rms which use weak (1%-10%), moderate (11%-20%) or strong (>20%) manager PRP, where …rms without managerial PRP serve as base category. The three dummy coe¢ cients are all statistically signi…cant and similar in size. Promotion quality in …rms with moderate or high managerial incentives is higher than in …rms from the base category but as high as in
…rms with low incentives.
17In sum, the results in table 2.3 …t the theoretical prediction that even weak incentives are associated with substantially higher
16
Ticking 4 or 5 on the Likert scale we describe as positive, ticking 1 or 2 we describe as negative judgement.
17
Note that the coe¢ cients of the interval dummies are not signi…cantly di¤erent from
one another.
Dependent Variable "Promotions go to those who best deserve them"
(1) (2) (3) (4) (5)
Manager PRP (%) 0.0045** 0.0119*** 0.0109**
(0.0022) (0.0045) (0.0044)
Manager PRP
2(%) -0.00012** -0.00011*
(6.11e-05) (6.08e-05)
Manager PRP 1-10% 0.256***
(0.0649)
Manager PRP 11-20% 0.240***
(0.0700)
Manager PRP > 20% 0.199**
(0.0914)
Manager Gain S. 0.217** 0.312** 0.281*** 0.231***
(0.0958) (0.0911) (0.0917) (0.0770)
Internal Sta¢ ng (%) 0.0010 0.0011
(0.0006) (0.0006)
Works Council -0.147*** -0.165*** -0.138*** -0.130*** -0.150***
(0.0554) (0.0526) (0.0518) (0.0503) (0.0462)
Socioeconomics Yes Yes Yes Yes Yes
Observations 27,948 28,373 27,948 25,840 25,840
Clusters (Firms) 288 294 288 271 271
Chi
2458.2 431.2 499.0 851.6 922.9
Pseudo R
20.02 0.02 0.02 0.03 0.03
*** p < 0.01, ** p < 0.05, * p < 0.1, clustered standard errors on …rm level in parentheses Ordered Probit regression, further controls: 2 …rm size dummies and 11 industry dummies Reference category: 0-99 employee …rm in the food industry
Reference category in model (4): Firms without manager PRP
Socioeconomics include tenure, sex, occupational status, job type (blue collar, white collar)
Table 2.3: The Relationship between Managerial Incentives and Favoritism
- Quadratic and Nonparametric Models
promotion quality.
2.6.2 Robustness and Potentially Omitted Variables
Of course it is important to discuss to what extent the observations reported in the above may be due to unobserved …rm heterogeneity rather than a causal relationship between incentive schemes and promotion quality. A com- peting non-causal explanation for our cross sectional evidence might be that the management’s willingness to use modern Human Resource Management practices causes better promotion quality, which in turn is correlated with our explanatory variables. For example, a …rm may have invested more in setting up a professional HR department which at the same time advocates the use of PRP and performance appraisal procedures that help to promote the most able employees. Or, a …rm with higher growth rates may have a higher willingness to share pro…ts with managers and at the same time pro- vides more promotion opportunities which leads the workforce to conclude that many capable employees can be promoted. While our dataset does not provide a variable that is suitable in a sensible manner as an instrument in an IV regression (all possible candidates violate the exclusion restriction with- out imposing untenable assumptions), we have rich information on other HR practices used by the …rms. By controlling for management and HR practices we can provide strong evidence that rules out many potential non-causal in- terpretations of the results described in the above. The key advantage of our data is that we have two combined data sources and, in a narrow sense, the management practices are exogenous when viewed from the perspective of an individual employee whose perceptions we measure and use as dependent variable.
We extend the speci…cation from column 4 in table 2.1 by stepwise adding
further controls in table 2.4. In column 1 we add a dummy for the presence of
performance related pay for non-managerial employees and expect a positive
sign, since worker PRP needs a system to evaluate performance and this may
induce higher promotion quality. However, worker PRP is not correlated
with perceived promotion quality. Moreover, the coe¢ cients for manager
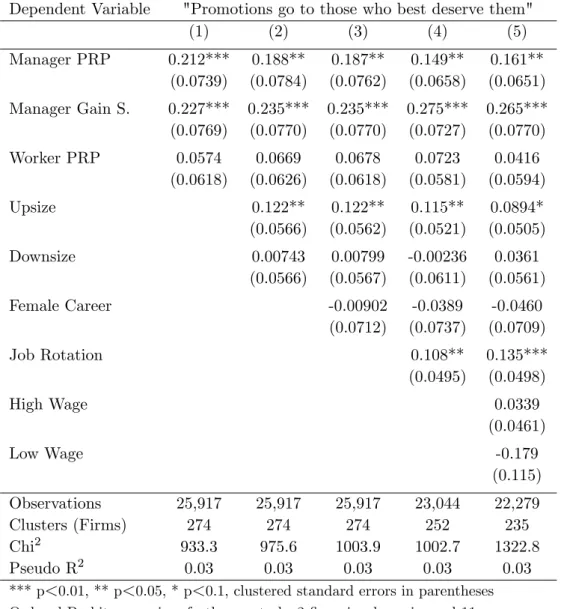
Dependent Variable "Promotions go to those who best deserve them"
(1) (2) (3) (4) (5)
Manager PRP 0.212*** 0.188** 0.187** 0.149** 0.161**
(0.0739) (0.0784) (0.0762) (0.0658) (0.0651)
Manager Gain S. 0.227*** 0.235*** 0.235*** 0.275*** 0.265***
(0.0769) (0.0770) (0.0770) (0.0727) (0.0770)
Worker PRP 0.0574 0.0669 0.0678 0.0723 0.0416
(0.0618) (0.0626) (0.0618) (0.0581) (0.0594)
Upsize 0.122** 0.122** 0.115** 0.0894*
(0.0566) (0.0562) (0.0521) (0.0505)
Downsize 0.00743 0.00799 -0.00236 0.0361
(0.0566) (0.0567) (0.0611) (0.0561)
Female Career -0.00902 -0.0389 -0.0460
(0.0712) (0.0737) (0.0709)
Job Rotation 0.108** 0.135***
(0.0495) (0.0498)
High Wage 0.0339
(0.0461)
Low Wage -0.179
(0.115)
Observations 25,917 25,917 25,917 23,044 22,279
Clusters (Firms) 274 274 274 252 235
Chi
2933.3 975.6 1003.9 1002.7 1322.8
Pseudo R
20.03 0.03 0.03 0.03 0.03
*** p < 0.01, ** p < 0.05, * p < 0.1, clustered standard errors in parentheses Ordered Probit regression, further controls: 2 …rm size dummies and 11 industry dummies. Socioeconomics include tenure, sex, occupational status, and job type (blue collar, white collar). Reference category: full-time employee in a small …rm (0-99 employees) in the food industry
Table 2.4: The Relationship between Managerial Incentives and Favoritism
- Controls I
PRP and manager gain sharing are basically una¤ected. If our results were largely driven by the general willingness to use modern HR practices we should observe a substantial drop in the coe¢ cients which is not the case.
In the next step we add information on whether the …rm up- or downsized within the last 3 years. In particular, both promotion opportunities and the willingness to share pro…ts may increase in …rms with high growth rates. The dummy Upsize (Downsize) equals 1 if the number of employees increased (decreased) by more than 5% in the last 3 years. As can be seen in column (2) Upsize is positively correlated with the promotion quality, though this e¤ect vanishes in the following richer speci…cations. Again the coe¢ cients for manager PRP and gain sharing are hardly a¤ected. We additionally control for the existence of a speci…c woman career plan and job rotation program, which both potentially a¤ect promotion decisions and promotion quality.
Ortega (2001), Arya and Mittendorf (2004) and Eriksson and Ortega (2006) argue that …rms learn about employees’productivity and speci…c capabilities via job rotation and that employer learning increases promotion quality. The e¤ect of woman career plans is ambiguous. The selective promotion of high ability women might increase the promotion quality, but male employees may feel discriminated and thus perceive a lower promotion quality. In column (3) and (4) we add dummies for both measures. Only job rotation is positively correlated with our measure of promotion quality. In column (5) we add dummies for companies paying above or below the respective union wages, where companies with above union wages show higher perceived promotion quality.
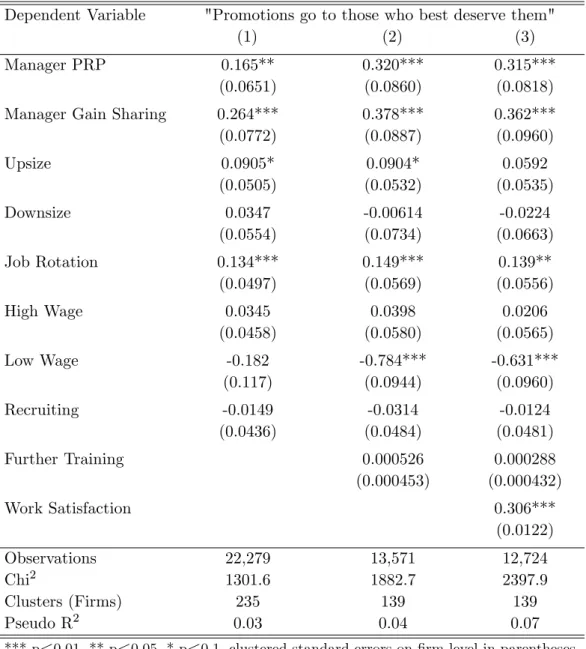
We add further controls in speci…cations reported in table 2.8 in the
Appendix. For instance, we control for the average number of days of further
employee training as this should be a suitable proxy for a …rm’s willingness
to invest in human resources (which may a¤ect promotion quality and the
willingness to share pro…ts). As several …rms did not report this key …gure
the number of observations drops substantially. However, it is interesting
to note that the coe¢ cients for manager PRP and gain sharing increase
substantially in size and remain highly signi…cant. Finally, we control for the
general work satisfaction of employees as higher perceived promotion quality
may be simply due to higher work satisfaction. As can be seen in column (8), work satisfaction is indeed highly correlated with promotion quality, but does not a¤ect the association between manager PRP or gain sharing and perceived promotion quality.
2.7 Conclusion
When performance is not perfectly observable promotion decisions are fre- quently based on subjective performance evaluations. If managers have per- sonal preferences for certain workers they have an incentive to distort perfor- mance ratings which promotes favored workers rather than most able workers.
We theoretically show that favoritism can reduce company pro…ts not only by putting the wrong people into management positions but also by reducing incentives for workers to exert e¤ort in promotion tournaments. Managerial incentives can constrain favoritism in promotion decisions by realigning man- agers’ and …rm’s interest and even rather weak managerial incentives may generate strong e¢ ciency gains.
We empirically tested the theoretical prediction using an unique represen-
tative matched employer-employee dataset. The empirical analysis con…rms
our theoretical result as promotion quality is signi…cantly higher in …rms in
which managers receive performance related pay or participate in gain shar-
ing plans. Indeed this higher perceived quality of promotion decisions should
translate in higher company performance as, not only the probability that
the best and not the best liked employees are promoted increases, but also
because stronger merit-based promotions should lead to a more motivated
workforce.
2.8 Appendix to Chapter 2
Explanatory V ar iable s: Fi rm Lev el Name Desc ription Min Max Me an S d N Man ager PRP =1 if … rm us es manageri al inc en tiv es 0 1 0. 57 .50 2 94 Man ager PRP % of total w age d ep en ding o n v ari ab le pa y me n t 0 80 4. 56 8.81 2 92 Man ager G ain S. =1 if m a n agers rece iv e gai n sh ar ing/ h ol d … rm as sets 0 1 0. 12 0.33 2 94 W ork er PRP =1 if … rm us es w or k er P RP 0 1 0. 37 .48 2 94 W ork s Coun cil =1 if w or ks counc il in the … rm 0 1 0. 60 0.49 2 94 In ter n al Sta¢ ng % of man ag er ial v acan cies … ll ed with in ternal hires 0 100 52. 20 37.78 27 4 Ind us tries 12 ind us try du mmies 1 12 - - 3 05 Fi rm S iz e 3 … rm size du mmies: 0-99, 100-499 and > 500 emp lo y ees 1 3 - - 305 In ter n al Promot ion % of p os itions … lled wi th in ternal st a¤ 0 100 52. 19 37.8 27 4 Ups iz e d umm y for a > 5% emplo y ee up size from 2003 -20 06 0 1 0.33 0. 47 305 Do wns iz e d umm y for a > 5% emplo y ee do wn size 200 3- 2 006 0 1 0.28 0. 45 305 F emal e career d umm y for fe mal e career p lan in g 0 1 0.0 65 0.25 2 94 Job Rotati on d umm y for a … rm wide job ro tation p rogra m 0 1 0. 48 0.50 2 75 Hig h W age d umm y for w age lev el a b o v e co rresp on ding u nion w age 0 1 0. 33 0.47 2 68 Lo w W a ge d umm y for w age lev el b elo w co rresp on ding u nion w age 0 1 0.0 37 0.19 2 68 F u rth er tr aining a v er age n u m b er of tr aining da ys p er emp lo y ee an d y ear 0 321 14. 10 44.25 1 71 Rec ru iting d umm y for str ategically rec ru it ing exp ert s 0 1 0. 26 0.44 27 5 T a b le 2 .5 : D es cr ip ti v e S ta ti st ic s o f V a ri a b le s o n F ir m L ev el
Explan a tory V ari ab le s: Ind iv idu al L ev el Name D escriptio n Min M ax M ean S d N T en ure em plo y ee’ s … rm ten ure 1 > 21 11. 2 7.11 34, 697 Male gen der d umm y 0 1 0.5 7 0 .50 34, 697 Leade r d umm y for manageri al emplo y ees 0 1 0.2 8 0 .45 34, 592 P a rt-time d umm y for par t-time o ccup ati on 0 1 0.1 7 0 .38 34, 731 Ed uc categori cal v ar iable for 9 ed ucation typ es 0 8 - - 33, 577 W ork Sati sfaction gen eral w or k satisf acti on ; 7-p oin t Lik ert scale 1 7 5.0 1 1 .15 32, 848 T a b le 2 .6 : D es cr ip ti v e S ta ti st ic s o f V a ri a b le s o n In d iv id u a l L ev el
Dep ende n t V ar iable "Pr omotions go to those who b est d ese rv e them" Prop ort ion o f emplo y ees stating agr eeme n t (0-100) (1) (2) (3) (4) Man ag er PRP 7.110* ** 6.801* ** 5 .665*** (2. 294) (2. 275) (2.08 8) Man ag er G ain S hari n g 8.093* ** 7.572* ** 6 .787*** (2. 627) (2. 593) (2.59 3) In te rn al Sta¢ ng (%) 0 .0533** (0. 0249) W ork s Coun cil -6. 775*** -6.1 50*** -6.5 21*** -4.433 ** (2. 044) (2. 145) (2. 048) (2.09 7) So cio econ omi cs No No No Y es Cons tan t 37.63* ** 38.93* ** 36.44* ** 5 1.29*** (4. 274) (4. 285) (4. 360) (5.60 9) Obse rv ations 294 294 294 274 R
20.19 0.18 0.21 0.31 *** p < 0.0 1, ** p < 0.0 5, * p < 0.1 , robu st stand ar d err ors in par en th eses OL S regr ession: furt h er con trols: 2 … rm si ze d ummies and 11 in du str y d ummies Ref erenc e category : 0-99 emplo y ee , … rm in the fo o d ind ustry So cio econ o m ic s inc lu de a v er age te n u re & share of males a m o n g re sp on den ts T a b le 2 .7 : T h e R el a ti o n sh ip b et w ee n M a n a g er ia l In ce n ti v es a n d F a v o ri ti sm - O L S A n a ly si s
Dependent Variable "Promotions go to those who best deserve them"
(1) (2) (3)
Manager PRP 0.165** 0.320*** 0.315***
(0.0651) (0.0860) (0.0818)
Manager Gain Sharing 0.264*** 0.378*** 0.362***
(0.0772) (0.0887) (0.0960)
Upsize 0.0905* 0.0904* 0.0592
(0.0505) (0.0532) (0.0535)
Downsize 0.0347 -0.00614 -0.0224
(0.0554) (0.0734) (0.0663)
Job Rotation 0.134*** 0.149*** 0.139**
(0.0497) (0.0569) (0.0556)
High Wage 0.0345 0.0398 0.0206
(0.0458) (0.0580) (0.0565)
Low Wage -0.182 -0.784*** -0.631***
(0.117) (0.0944) (0.0960)
Recruiting -0.0149 -0.0314 -0.0124
(0.0436) (0.0484) (0.0481)
Further Training 0.000526 0.000288
(0.000453) (0.000432)
Work Satisfaction 0.306***
(0.0122)
Observations 22,279 13,571 12,724
Chi
21301.6 1882.7 2397.9
Clusters (Firms) 235 139 139
Pseudo R
20.03 0.04 0.07
*** p < 0.01, ** p < 0.05, * p < 0.1, clustered standard errors on …rm level in parentheses Ordered Probit regression, Further controls: 2 …rm size dummies,
11 industry dummies, works council, worker PRP, female career Socioeconomics include tenure, sex, occupational status, education
Table 2.8: The Relationship between Managerial Incentives and Favoritism
- Controls II
Chapter 3
When Higher Prizes Lead to Lower E¤orts - The Impact of Favoritism in Tournaments 1
3.1 Introduction
Since the seminal contribution of Lazear and Rosen (1981), numerous pa- pers have explored the incentive e¤ects of tournaments. One of the most prominent results in the literature is that higher tournament prizes lead to higher e¤orts. A key assumption in most of these tournament models is that the agent with the highest output always wins the tournament. However, in reality, tournament outcomes are often based on subjective decisions by in- dividuals. For instance, in organizations managers decide upon promotions.
Or in sports contests, referees or judges either directly determine the winner or make decisions which crucially a¤ect the tournament outcome. In these settings not only output, but also personal preferences towards the agents may a¤ect the choice of the winner. We show in a simple extension of the standard Lazear/Rosen framework that the existence of favoritism can re- verse the relationship between the tournament prize and e¤ort choices. The e¤ect of higher prizes are then twofold: On the one hand, higher prizes make
1