Printed in Great Britain.
@ 1994 IUPAC
INTERNATIONAL UNION OF PURE AND APPLIED CHEMISTRY
APPLIED CHEMISTRY DIVISION
COMMISSION O N ATMOSPHERIC CHEMISTRY
*
ASSESSMENT OF UNCERTAINTIES IN THE PROJECTED CONCENTRATIONS
OF METHANE IN THE ATMOSPHERE
(Technical Report)
Report based on Proceedings of the International Workshop held in Moscow, Russia, July 20-21,1992. Organized by the Russian Academy of Science, Siberian Branch and the
Netherlands Energy Research Foundation, ECN, Petten, Netherlands. Co-sponsored by the International Institute for Applied System Analysis, IIASA, Laxenburg, Austria
Prepared for publication by
J. SLANINA', P. WARNECK', N. M. BAZHIN3, H. AKIMOT04 AND W. M. KIESKAMP' 'Netherlands Energy Research Foundation (ECN), P.O. Box 1, 1755 ZG, Petten, Netherlands 2Max-Planck-Institute fur Chemie, P.O. Box 3060 D-6500 Mainz, Germany
31nstitute of Chemical Kinetics and Combustion, 630090, Novosibirsk, Russia
4Research Center for Advanced Science and Technology, University of Tokyo, 4-6-1 Komaba, Meguro-ku, Tokyo 153, Japan
with participation of the f o l l o w i n g invited speakers
M. A. K. Khalil (USA), J. G. Calvert (USA), E. Matthews (USA), L. Barrie (Canada), M. Wahlen (USA), S. E. Schwartz (USA), X. Tang (PR China) and 0. N. Singh (India)
*Membership of the Commission during the period (1991-1995) in which the report was prepared was as follows:
Chairman: 1985-1993 J. Slanina (Netherlands); Secretary: 1987-1995 P. Warneck (Germany); Titular Members: H. Akimoto (Japan; 1987-1995); L. Barrie (Canada; 1991-1995); N. M. Bazhin (Russia;
1991-1995); R. H. Brown (UK; 1991-1995); X. Tang (China; 1987-1995); Associate Members:
E. H. Adema (Netherlands; 1991-1995); J. G. Calvert (USA; 1991-1995); K. H. Eickel (Germany;
1989-1993); J. A. Kerr (UK; 1987-1995); L. Klasinc (Croatia; 1991-1995); 0. Lindqvist (Sweden;
1989-1993); L. F. Philips (New Zealand; 1991-1995); H. I. Schiff (Canada; 1991-1995); S. E. Schwartz (USA; 1991-1995); Wm. E. Wilson (USA; 1989-1993); National Representatives: T. M. Tavares (Brazil; 1992-1993); H.-J. Grosse (Germany; 19861993); B. Bonsang (France; 1990-1993); S. Glavas (Greece; 1991-1993); L. Horvgth (Hungary; 1990-1993); 0. N. Singh (India; 1989-1993); I. Allegrini (Italy; 1991-1993);
0.
Hov (Norway; 1985-1993); Y. Y. Lee (Korea; 1991-1993); U. Ozer (Turkey;1987-1993).
Republication of this report is permitted without the need for formal IUPAC permission on condition that an acknowledgement, with full reference together with IUPAC copyright symbol (0 1994 IUPAC),. is printed.
Publication of a translation into another language is subject to the additional condition of prior approval from the relevant IUPAC National Adhering Organization.
Assessment of uncertainties in the projected concentrations of methane in the atmosphere (Tech n ica I Report)
Abstract
-
Sinks and sources of methane have been examined in the papers presented at the IUPAC sponsored Workshop held in Moscow in July 1992. The conclusion reached was that very large uncertainties exist in the assessment of sources. The emissions from wetlands and rice paddies could be much lower than formerly assumed. The emissions from other sources, e.g. from landfills, could be larger. The most important sink, oxidation by OH-radicals in the atmosphere, has an uncertainty of 40% or more and cannot be used to evaluate the quality of the emission data.As a consequence, it is very difficult to predict future atmospheric concentrations, as function of changes in land use and economic activities. The prediction of the radiative balance of the earth is very difficult not only because of the uncertainty in future greenhouse gas concentrations but also because important factors, like the influence of aerosols, are insufficiently characterized.
CONTENTS
Introduction (J. Slanina and P. Warneck)
Trends of atmospheric methane (M.A.K. Khalil and R.A. Rasmussen) Tropospheric CH,: uncertainties in its chemical loss rate (J.G. Calvert) Assessment of methane sources and their uncertainties (E. Matthews) Global methane emissions from biomass burning and comparison with other sources (M.O. Andreae and P. Warneck)
Methane emissions from northern wetlands: source strength and uncertainties in estimates
(N.T.
Roulet and L.A. Barrie)Climate forcing by gases and aerosols (S.E. Schwartz) Sources of methane in Russia (N.M. Bazhin)
Emissions of methane in Japan (H. Akimoto) Methane emission in China (X. Tang)
Indian methane budget and its global perspective (O.N. Singh)
139 143 148 154
162
170 178 188 191 195 197
138
INTRODUCTION J. Slanina' and P. Warneck'
'
Netherlands Energyresearch Foundation (ECN) P.O.box 1, 1755 'ZG, Petten, Netherlands*
Max-Planck-Institut fur Chemie, P.O.box 3060 D-6500 Mainz, Germany 1. General backgroundInfrared active gases in the atmosphere keep earth's surface temperatures in a range which is comfortable to life. The gases intercept and partly store thermal radiation that otherwise would be lost directly to space. The concentrations of many of these so-called greenhouse gases are currently increasing with the consequence that the global radiative balance is influenced. Methane, the most important greenhouse gas next to carbon dioxide in the atmosphere is projected to contribute about 19% to total greenhouse warming compared to 50% for CO, (Slanina, 1991). The mixing ratio of methane has been rising at a rate of about 1% per year during the past decade and has now reached
1.7 pmoVmol of air. Other greenhouse gases whose mixing ratios have been found to increase are the chlorofluorocarbons, ozone and nitrous oxide. Human activities are largely held responsible for these effects. Model calculations predict a global temperature rise on the order of 3 K over the next century, and this has led to an intense debate concerning possibilities of climatic changes.
As a sequel to a very successful workshop dealing with uncertainties of future carbon dioxide concentration in the atmosphere (Slanina & Okken, 1991), IUPAC has now sponsored a meeting designed to assess uncertainties in the projected concentrations of methane in the atmosphere. This workshop, which was cosponsored by the International Institute of Applied Systems Analysis, took place in Moscow in July 1992. The programme was organized jointly by the IUPAC Commission on Atmospheric Chemistry (VI.4) of the Applied Chemistry Division, the Netherlands Energy Research Foundation, and the Institute of Chemical Kinetics and Combustion of the Russian Academy of Science, Siberian Branch. The workshop was to review the current knowledge of sources and atmospheric behaviour of methane in order to identify major areas of uncertainty. Leading experts, invited to report on recent developments, included drs. M.A.K. Khalil, E. Matthews and M. Wahlen.
In addition, members of the Commission on Atmospheric Chemistry were asked to review specific subjects and, in particular, the situation in Russia and the Asian countries. The full programme is shown in Table 1.
TABLE 1. Programme of the workshop on uncertainties in the projected concentrations of methane in the atmosphere.
J. Slanina M.A.K. Khalil J.G. Calvert, E. Matthews P. Warneck L. Barrie M. Wahlen S.E. Schwartz N.M. Bazhin H. Akimoto X. Tang O.N. Singh
~ ~~~ ~ ~~
Climatic consequences from observed and projected increases in greenhouse gases.
Trends, cycles and relation to sources and sinks of observed mixing ratios of atmospheric methane.
Tropospheric CH, uncertainties in its chemical loss rate.
Assessment of methane sources and their uncertainties.
Methane emissions from biomass burning.
Methane emissions from northern wetlands source strength and uncertainties in estimates.
Use of isotopes in defining the budget of methane in the atmosphere.
Climate forcing by aerosols.
Sources of methane in Russia.
Emissions of methane in Japan.
Emissions of methane in China.
Indian methane budget and its global perspective.
The important role of methane in climatic forcing has been highlighted in the literature. The emissions of methane could rise very considerably in the future, due to increasing agricultural and industrial production and population growth.But many uncertainties exist in our present estimates of temperature changes, due to the enhanced greenhouse effect.
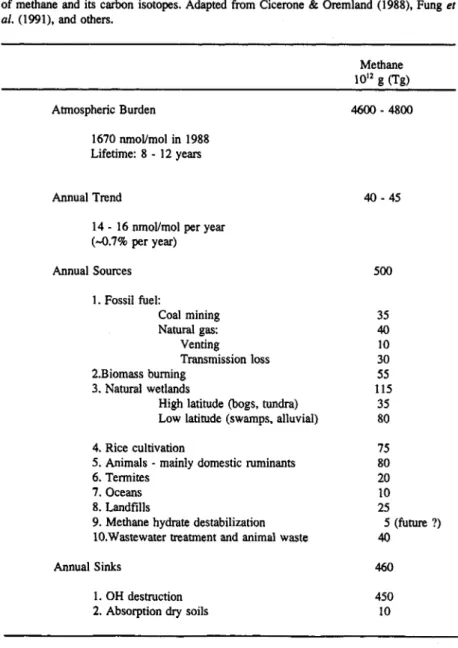
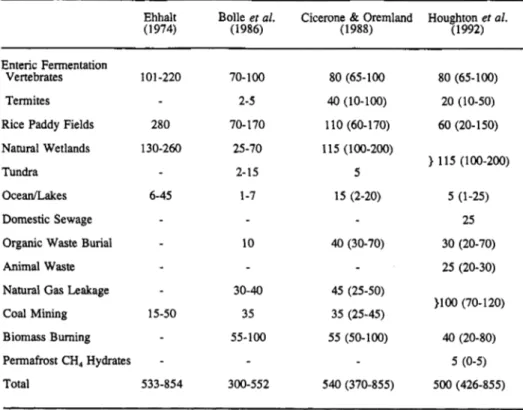
Measurements of methane in Greenland and Antarctic ice cores indicate pre-industrial CH, mixing ratios in the atmosphere of about 0.65 pmol/mol. Wetlands have perhaps been the dominant source of methane under these conditions with an estimated global source strength of 180-380 Tg/a. The current total source strength is estimated to be about 500 Tg/a. Table 2 gives the present estimates of the source strength for the most important methane emissions.
140 COMMISSION ON ATMOSPHERIC CHEMISTRY
TABLE 2. Sources of methane in the atmosphere and global strength estimates ("@a').
Fossil fuel Coal mining Natural gas
venting
transmission losses Biomass burning
Natural wetlands
High latitude (bogs, tundra) Low latitude (swamps, alluvial) Rice cultivation
Animals (mainly domestic ruminants) Termites
Oceans Landfills TOTAL
35 40 10 30 35 115 35 80 100 80 20 10 25
500
TABLE 3. Parameters of a simplified calculation of future greenhouse gas emissions. Expressed as % change per year.
Northern Southern
Hemisphere Hemisphere
economic growth 2 4
population growth -0.1 2
emission reduction 1 0.5
These data indicate that about 70% of methane arises from human activities. But the uncertainties in these estimates are very large. Recently indications were presented that the estimates for the emissions of wetlands and rice paddies could be much lower that formerly assumed. Sources like landfills and winning and distribution of natural gas could be more important. An assessment of the uncertainties of these sources has been made during this workshop.
In the atmosphere, methane is attacked by OH radicals and is then oxidized toward CO and CO,.
Although these processes are well understood, the direct measurement of OH concentrations is difficult, and, consequently, the rate of destruction of methane is quite uncertain.
Continuing economic development, following the existing patterns, and population growth will lead to a very large increase in the concentration of greenhouse gases in the atmosphere. If it is assumed that the current estimates of emissions are correct, that limited economic growth will take place in the future and that the population will increase at the present level, a very sharp increase in the concentrations of greenhouse gases is predicted.
The parameters of a very simple model are given in Table 3. In this simple scenario the emissions of methane increase in the Northern hemisphere with approx. 70% over the period 1990 to 2040, but the increase in the Southern hemisphere is one order of 'magnitude. The total emissions of greenhouse gases (expressed in C02 equivalents) as deduced by this simple linear model is given in Fig. 1.
The consequences of such an increase in the emission of greenhouse gases could be enormous. It is very important to establish whether the present estimates of the emissions are correct, whether a linear relation between economic activity, emission controls and population growth can be assumed in order to assess the future situations. These items were discussed in depth during this Workshop.
2. Conclusions regarding uncertainties in sources
The overview of
Dr.
Schwartz (Climate forcing by aerosols) provided a general introduction to the radiation balance of the earth and showed that many uncertainties exist in our present estimates of temperature changes, due to the enhanced greenhouse effect. It can be argued that most of the climatic forcing by greenhouse gases during the last century has been compensated by cooling due to increased concentrations of aerosols in the atmosphere.In the atmosphere, methane is attacked by OH radicals and is then oxidized toward CO and CO, (J.G.
Calvert, Tropospheric CH, uncertainties in its chemical loss rare). Hydroxyl radicals, OH, are generated in a reaction of excited oxygen atoms with water vapour, the oxygen atoms being formed by
'
The correct symbol for year is 'la'' rather then "yr", but because "yr" is widely recognised, this symbol will also be used in this report.photolysis of ozone in ultraviolet sunlight. The direct measurement of OH concentrations is difficult, and the OH concentration field has to be calculated. Although most of the input data are reasonably well known, it was surprising to learn how much uncertainty still exists in this respect.
An overview of the present estimates of methane emissions (see Table 2) was presented by E.
Matthews (Assessment of methane sources and their uncertainties). It was emphasized that the uncertainties in a number of sources is very large, even to the point that the uncertainties at present are about in the same magnitude as they were 5 years ago.
Biomass burning is an important source of methane emissions (P. Warneck, Methane emissions from biomass burning), but it is very difficult to extrapolate the few data which are available, to global estimates of the strength of this source.
Methods available for estimating the strengths of sources generally combine emission factors determined by field measurements with statistical data on the extent of source areas, animal populations, etc.. The errors involved in deriving such estimates can be appreciable. Therefore one has looked into other data that might conceivably provide further constraints to the methane budget, as is the case for carbon isotope ratios (M. Wahlen, Use of isotopes in defining the budget of methane in the ahnosphere). For example, fossil methane would be depleted in radiocarbon compared with methane of recent biological origin, since the source of I4C is the interaction of cosmic radiation with atmospheric nitrogen, and I4C has a half life of 5700 years. A wide variety of data on carbon and hydrogen isotopes in methane from various sources and in the atmosphere is now available.
Unfortunately, this additional information still leaves the relative contributions of many biogenic sources undefined.
Measurements of methane in Greenland and Antarctic ice cores indicate pre-industrial CH, mixing ratios in the atmosphere of about 0.65 pmoVmol (M.A.K. Khalil, Trends, cycles and relation to sources and sinks of observed mixing ratios of atmospheric methane). Wetlands must have been the dominant source of methane under these conditions with an estimated global source strength of 180-380 Tg/a. The current total source strength is estimated to be about 500 Tg/a. Table 2 gives a breakdown into individual processes that contribute to the global budget. The data make evident that about 70% of methane arises from human activities. Methane is produced naturally by microbial breakdown of organic material under anaerobic conditions. Whereas methanogenic bacteria are strict anaerobes, a host of other bacteria feed on methane once it reaches aerated strata in water-logged
GREENHOUSE GASES
Northern and Southern Hemisphere
-A- TgCeq - - 0 - - TgCeq
--+--
TgCeqnorth south total
0 ' I I I I I I I I I I
1990 1995 2000 2005 2010 2015 2020 2025 2030 2035 2040 Fig. 1. Projected emission of greenhouse gases
142 COMMISSION ON ATMOSPHERIC CHEMISTRY
soils, thereby reducing the flux of methane escaping to the atmosphere. Thus, shallow ponds, alluvial wetlands, rice paddy fields, etc.. are the most important source areas. In addition methane is microbially produced in the intestines of and exhaled by cattle sheep and other domestic animals.
Table 2 shows that more than 60% of human related sources are associated with agricultural practices, only 25% stem from coal mining and other fossil fuel related activities. There can be no doubt that the recent growth in the concentration of methane in the atmosphere is due to an expansion of agricultural activities that were needed to feed a growing human population. Indications exist that no longer a 1 to 1 correlation can be observed between increase of methane concentration in the atmosphere and population growth. This correlation has been observed during a period of several decades.
The latest reports about the emissions of Northern Wetlands,
0..
Banie, Methane emissions from northern wetlands source strength and uncertainties in estimates) indicate that these emissions are substantially lower as formerly assumed. The emissions of Northern wetlands are probably in the order of 20 Tg/a instead of 80.It is of great importance that the main rice growing countries have been alerted to the problem of methane increase in the atmosphere, and more detailed information on the contribution of rice cultivation to atmospheric methane is now being sought on the basis of an improved knowledge of local conditions (O.N. Singh, Indian methane budget and its global perspective). An unexpected conclusion of the workshop was that India, one of the main rice growing countries, contributes no more than 7% of global emissions from rice crops, because most Indian paddy crop is taken from irrigated field and only a small portion from water-logged fields.
The losses of natural gas in Russia (N.M. Bazhin, Sources of methane in Russia), during exploration and transport, are certainly not as large as assumed in some West-European studies (up to 25%). So leakage of natural gas in Siberia cannot fill, according Russian data, the gap in emission strength, caused by the much lower emissions of wetlands and rice paddies.
On the other hand, the emissions of landfills could be much larger as previously assumed, based on the first results of measurements in China (X. Tang, Emissions of methane in China). The first observations in China indicate that the emissions of rice paddies is lower than assumed previously, analog to the Indian observations.
Japan has started environmental programs for abatement of methane emissions (H. Akimoto, Emissions of methane in Japan). The emissions in Japan are not as high as expected, based on former estimates, again because of lower emissions of rice paddies.
3. Recommendations for research
It is clear that large uncertainties exist regarding the emissions of methane and that the uncertainty in atmospheric oxidation is so large (in the order of 40% according the estimates of Dr. Calvert) that this mechanism cannot be used to check our emission inventories. Better estimates of reaction rates and OH concentration fields are needed.
Measurement of isotope ratios (14C/'2C and I3C/l2C) can also provide data to validate emissions, but at present this technique is insufficiently precise to check detailed emission inventories
These measurements should be carried out in background as well in polluted areas to check local emission inventories.
Specific validation measurements, to evaluate emissions on regional and (sub)continental scale are required to check whether the extrapolation of measurements of methane emissions, carried out on very small scale, to global dimensions has been carried out correctly in the past.
References
Slanina, J. Uncertainties in atmospheric carbon dioxide concentrations. Chem.Int.. 13, 10-14 (1991)
Slanina. J & Okken, P. (eds) Assessment of uncertainties in the projected concentrations of carbon dioxide in the atmosphere. Proceedings of the IUPAC Workshop, Petten, 1991. Pure & AppLChern.. 63,763-7% (1991)
TRENDS OF ATMOSPHERIC METHANE M.A.K.Khali1 and R.A.Rasmussen
Global Change Research Center, Department of Environmental Science & Engineering Oregon Graduate Institute, Beaverton, Oregon 97006, USA
1. Introduction
The observed concentrations of atmospheric methane result from two factors - processes that release methane into the atmosphere and processes that remove it. When these processes are out of balance methane concentrations rise or fall or undergo cyclical variations. On the time scale of a year, methane concentrations undergo seasonal variations that are large at high latitudes and smaller at tropical and equatorial latitudes. The entire global burden of methane undergoes seasonal variations.
On longer time scales during recent years, the trends of methane are characterized by persistently increasing concentrations. This paper is about the increasing trends and the possible reasons for the increases.
2. Past and present trends
There are three types of data currently available to address the trends of methane. Data on concentrations before the early decades of the 20th century come from analyses of bubbles of old and ancient air preserved in polar ice. This record now extends back to some 160,OOO years. The detailed record over recent millennia comes from Greenland and Antarctic cores, while the very long term record back the last glacial maximum comes from the core drilled by Soviet scientists at Vostok station in Antarctica (Rasmussen & Khalil, 1984; Stauffer et al., 1988; Raynaud et al., 1988;
Chappellaz et al., 1990). For the 1950s to recent times, methane concentrations have been calculated from stored solar spectral plates. During the decades of the 1960s and 1970s direct measurements of methane were taken sporadically by many investigators using reliable gas chromatographic instrumen- tation. These data show considerable variability because of differences in absolute calibration and the quality of instrumentation (Khalil ef al., 1989). From about 1979 onwards there are several indepen- dent records of careful, systematic global measurements of atmospheric methane (Rasmussen &
Khalil, 1981; Khalil & Rasmussen, 1983, 1987, 1990; Steele et al., 1987; Blake & Rowland, 1988).
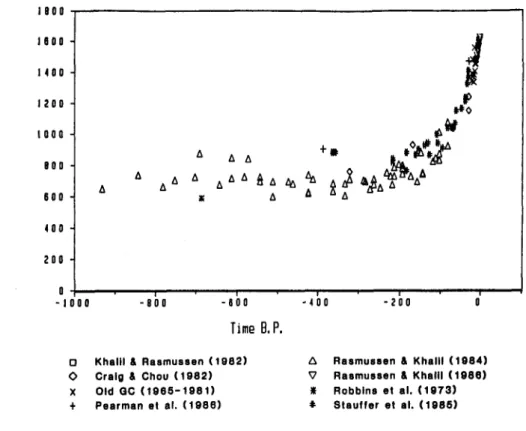
Figures 1-4 show the records of methane during various periods from about 1OOO years
B.P.
to the detailed records of the last decade (from Khalil & Rasmussen, 1987, 1990; and Khalil et al., 1989).From these records we can conclude the following:
1. The concentration of methane appears to be only about 350 nmoYmol during glacial times, which is about half of the natural inter-glacial levels.
2. The natural inter-glacial concentrations of methane are 650-700 nmol/mol.
3. Methane started to increase rapidly only during the last 100-200 years. Before that time the concentrations appear to have been stable at the levels characteristic of inter-glacial periods.
4. During the last decade or so, concentrations of methane have been increasing at relatively fast rates of about 1% per year or about 16 nmol/mol.yr. Present globally averaged concentrations are 1685 nmol/mol (in 9/1988) or about two and a half times higher than natural inter-glacial levels.
Several independent data sets have mutually verified these conclusions which are currently taken as fact. There are, however, remaining questions about the icetore data that leave open the possibility that the true pre-industrial and glacial concentrations may be different from those reported in the scientific literature. In contrast, the global trends over the last decade are incontrovertible since they are based on direct and highly precise atmospheric measurements.
144 COMMISSION ON ATMOSPHERIC CHEMISTRY
I 0 0 0 I 6 0 0
-
I 4 0 0
-
1 2 0 0
-
l o o 0 -
0 0 0
-
6 0 0
-
4 0 0
-
2 0 0
-
0 4 1 I I I a
- 1 0 0 0 - 8 0 0 - 6 0 0 - 4 0 0 - 2 0 0 0
Time B.P.
o Khalil 6 Rasmussen (1982) 6 Rasmussen 6 Khalll (1084) 0 Craig 6 Chou (1982) V Rasmussen 6 Khalll (1888) X Old QC (lQ86-1981) I Robbins et al. (1973) t Pearman et al. (1986) 9 Stauffer et al. (1086)
Fig. 1. The concentrations of methane during the last lo00 years.
3. Details of present trends
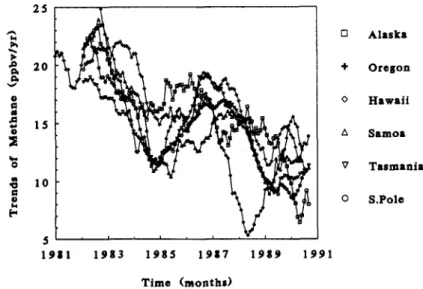
The data during the last decade are so detailed that they record not only the overall decadal average trends but also the changes in the trends. These data show several features; the most significant is that the rate of increase of methane is slowing. The rate of increase has been slowing from the very beginning of the systematic measurements in 1979. The change has been quite dramatic. In the early part of the data, the trend was about 20 nmol/mol.yr, and in recent years it is about 10 nmol/mol.yr or about half as much.
The slowdown of the trends was first reported by Khalil & Rasmussen (1990), including evidence from other published data. Figure 5 shows the slowdown of the global average concentration. In this graph the trends are shown as the linear rates of increase during 3-year overlapping periods (unpublis- hed data). In these calculations the first point is the trend during months 1 to 36, the second point is the trend for months 2 to 37, and so on.
There are yet other features in the detailed data sets that show the changing nature of current trends.
The Cape Meares record shows four features:
1. As for data from all sites, the rate of increase is slowing.
2. The rate of increase is higher in winter than in summer. This is equivalent to an increasing amplitude of the seasonal cycle.
3. The rate of increase is higher at middle and higher northern latitudes compared to southern latitudes.
4. The trend is likely to be affected by natural events such as the El Nino. Methane concentrations may decline during El Nino events from a combination of factors. The higher sea surface temperatures may lead to more water vapour in the tropics and hence to a greater production of OH radicals that remove methane, and possibly to a shift of rainfall patterns that may leave more dry soils that remove methane. Thus, the reduced concentration of methane during El Ninos may result from more efficient removal.
All these effects, except the slowdown of the rate of increase, are small and are still under investigati- on. If these effects exist, they provide new challenges that may sharpen our knowledge of the sources and sinks of atmospheric methane. Global mass balance models would have to include these effects that will put constraints on the estimates of global emission rates.
4. Facts and speculations on the causes behind the trends
As stated in the beginning, the causes for these trends must lie with either changes of sources or the removal processes (also called sinks). The main processes that remove methane from the atmosphere are reaction with tropospheric OH radicals and removal at the earth's surface by dry soils. There are some other lesser processes that remove small amounts of methane. The main sources affected by human activities are cattle, rice fields, biomass burning, landfills, and leakages from natural gas use.
The main natural source is the wetlands with smaller contributions from the oceans, lakes and tundra.
A number of other natural and anthropogenic sources of methane also exist.
There is considerable evidence that the change of methane concentrations from about 700 nmoVmol a hundred or so years ago to the 1650 nmoVmol today is caused mostly by increasing sources and to a much lesser extent by decreasing OH (see Khalil & Rasmussen, 1985; Levine et al., 1985; Thompson
& Cicerone, 1986; Pinto & Khalil, 1991; Lu & Khalil, 1991).
The decrease in the trend is of particular importance in deciding whether the global oxidizing capacity is changing (or equivalently that OH is increasing) or whether some of the sources controlled by human activities are no longer increasing as rapidly or perhaps even decreasing. In this paper we can only make qualitative arguments in favour of changing sources rather than changing sinks.
It is noteworthy that it was generally believed that the OH concentrations should be decreasing (this would cause the trend of methane to increase, all other factors being the same). The decrease of OH was expected because CO and CH, were both increasing and these gases can are the major sinks of
A w
0 a
v 0
1200
1960 1965 1970 1 9 7 5 1980
Time (Yrs)
Khelil i Reclrnuesen Steel0 et .I.
Blake i Rowland
1977 1979 I981 1983 1985 1987 1989
T i m e (Months)
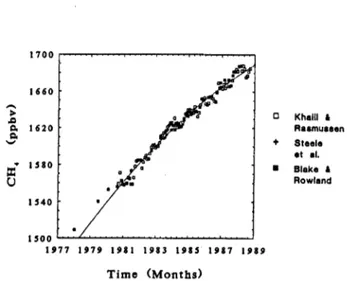
Fig. 2. Trends and concentrations during the 1960s and
1970s. the recent decade, 1979-1989.
Fig. 3. Global average concentrations of methane during
146 COMMISSION ON ATMOSPHERIC CHEMISTRY
Rate of Change of Methane
1700-1984 A.D.
k
i e\ P
n n
12
.i;
U
5 0
0 K Q c
4
1874-1884 1882-1973 1927-1956 1804-1825 1800-1800 1700-1800
Time Periods
Ice Core
-
CalculatedMsaruremantr Mar8 Balance
Fig. 4. The past trends of atmospheric methane.
OH. Now it appears that these factors may be compensated by enhanced production of OH, particular- ly because of increasing tropospheric 0, and also because of other considerations. It appears that the OH concentrations are stabilized against changes (see Pinto & Khalil, 1991; Lu & Khalil, 1991).
If an increase of OH is not the main cause for the slowdown in the methane concentration, then it must be explained by the changes of sources. In fact, it is now evident that the area of rice agriculture is no longer expanding. Higher yields are being achieved by use of hybrid species and artificial fertilizers; neither is likely to increase methane emissions. Thus, a slower increase in the area of rice planted may lead to a lesser increase of methane emissions from this source. Similarly, the world cattle populations are no longer increasing, because of various reasons including lack of suitable range lands. It seems, therefore, that the two major sources affected by human activities, rice agriculture and domestic cattle (and perhaps also other animals), are no longer increasing because of natural limitations on these activities. Cattle and rice agriculture were the major causes of the increase of methane over the last century; these sources increased with increasing population. The lack of increase in these large sources over the last decade may well be the cause of the slowdown in the trends of methane.
1 I
2 0
I5
10
5 t " ' ' ' ' '
1 9 1 1 1 9 8 3 1 9 8 5 1 9 1 7 1 9 8 9 1 9 9
0
+
0
A
V
0
1
Alaska Oregon Hawaii Samoa Tasmania S.Pole
Time (months)
Fig. 5. ' h e slowdown in the trend of methane. at various latitudes.
If these ideas are correct, two important conclusions emerge:
1. If the sources that contributed to past increases of methane are not increasing any more, then the past record of methane is becoming uncoupled from the future. Future increases of methane will be caused by other (newer) sources that were not important in the past; thus, the past does not serve as an indicator of the future. Population increase, for instance, is no longer an indicator of future methane emissions. Thus, reliable projections of methane concentrations into the future anvirtually impossible at present.
2. The second conclusion is that the global methane trends are slowing without any legislative intervention, most likely from natural limits to growth of the major anthropogenic sources. This aspect is particularly interesting since most control strategies cannot guarantee the reduction of the growth rate by a factor of two within a decade as has already occurred. The notion that any trend of an atmospheric trace gas can continue for decades or centuries has no philosophical or scientific basis but is commonly assumed in many assessments of the future levels of man-made trace gases, including methane.
It is clear that the current data on the global trends of methane are challenging conventional predictions of future methane concentrations and leading to refinements of the current global budget.
Acknowledgements: We thank M.J. Shearer, F. Moraes, Y. Lu, R.M. MacKay, D. Steams, and R.W. Dailuge for their contributions to research on the methane cycle. Portions of this work were supported by the National Science Foundation, Department of Energy (DE-FG06-85ER603 l), and the National Aeronautics and Space Administration (NASA). The U.S. Environmental Protection Agency provided support for the analysis of Cape Meares data through a contract to Andan Co. Additional support was provided by the Biospherics Research Corporation. The authors and not the sponsors are solely responsible for the contents of this paper.
References
Blake, D. & Rowland, F.S. Continuing worldwide increase in tropospheric methane, 1978-1987. Science, 239 1129-1131 Chappellaz, J. Bamola, J.M., Raynaud, D., Korotkevich, Y.S. & Lorius, C. Ice core record of atmospheric methane over Khalil, M.A.K. & Rasmussen, R.A. Causes of increasing methane: depletion of hydroxyl radicals and the rise of emissions.
Khalil, M.A.K. & Rasmussen, R.A. Atmospheric methane: Trends over the last 10,OOO years. Ams.Environ.. 21 Khalil, M.A.K. & Rasmussen, R.A. Atmospheric methane: Recent global trends. Environ.Sci.& Technol., 24, 549-553 Khalil, M.A.K. & Rasmussen, R.A. Sources, sinks and seasonal cycles of atmospheric methane. J.Geophys.Res., 88 Khalil, M.A.K., Rasmussen, R.A. & Shearer, M.J. Trends of atmospheric methane during the 1960s and 1970s.
Levine, J.S., Rinsland, C.P. & Tennille, G.M. The photochemistry of methane and carbon monoxide in the troposphere in
Lu, Y. & Khalil, M.A.K. Tropospheric OH: Model calculations of spatial, temporal and secular variations. Chemosphere,
Pinto, J.P. & Khalil, M.A.K. The stability of OH during ice ages, inter-glacial epochs and modem times. Telluc. 43B, Rasmussen, R.A. & Khalil, M.A.K. Atmospheric methane: Trends and seasonal cycles. J.Geophys.Res., 86, 9826-9832 Rasmussen, R.A. & Khalil, M.A.K. Atmospheric methane in the recent and ancient atmospheres: Concentrations, trends Raynaud, D., Chappellaz, J., Bamola, J.M., Korotkevich, Y.S. & Lorius, C. Climatic and methane cycle implications of Stauffer, B., Lochbronner, E., Oeschger, H. & Schwander, J. Methane concentration in the glacial atmosphere was only Steele, L.P., Fraser, PJ., Rasmussen, R.A., Khalil, M.A.K., Conway, TJ., Crawford, A.J., Gammon, R.H., Masarie, K.A.
Thompson, A.M. & R.J. Cicerone. Possible perturbations to atmospheric CO, CH, and OH. J.Geophys.Res., 91, (1988)
the past 160,OOO years. Nature, 345, 127-131 (1990) Armos.Environ., 19, 397-407 (1985)
2445-2452 (1 987) ( 1990)
5131-5144 (1983)
J.Geophys.Res., 94, 18279-18288 (1989) 1950 and 1985. Nature, 318,254-257 (1985) 23,397-444 (1991)
347-352 (1991) (1981)
and interhemispheric gradient. J.Geophys.Res. , 89, 11599-1 1605 (1984)
glacial-interglacial CH, change in the Vostok ice core. Nature, 333, 655-657 (1988) half that of pre-industrial holocene. Nature, 332, 812-814 (1988)
& Thoning, K.W. The global distribution of methane in the troposphere. J.Armos.Chem., 5, 125-171 (1987)
10853-10864 (1986)
148 COMMISSION ON ATMOSPHERIC CHEMISTRY
TROPOSPHERIC CH,: UNCERTAINTIES IN ITS CHEMICAL LOSS RATE J.G. Calvert
Atmospheric Chemistry Division, National Center for Atmospheric Research Box 3000, Boulder, Colorado, 80307, USA
1. Introduction
Methane has been identified as the most important of the trace gas species (excluding H20 and CO,) in contributing to the greenhouse warming of the Earth (Ramanathan et al., 1985; Mitchell, 1989).
There is concern today since its concentration in the troposphere has continued to rise at an average rate of about l%/yr from 1980 to 1988 (Steele et al., 1987; Khalil & Rasmussen, 1987, 1990; Blake
& Rowland, 1988). The reasons for the observed trends in atmospheric methane concentration are not
well established. Of course the rate of growth of CH, in the troposphere is equal to the rate of input from all methane sources minus the rate of its removal by all sinks. Our understanding of the magnitude and location of all sources and sinks of methane has increased greatly in recent years (Cicerone & Oremland, 1988; Taylor, et al., 1991), but a definitive assignment of source strengths and sinks remains an unattained goal of atmospheric scientists. Methane enters the atmosphere by a variety of pathways: emissions from wetlands, rice paddies, fossil fuels, animals, biomass burning, landfills, termites, oceans, and other sources; these are addressed by others in this series of articles. Here we will review our understanding of the atmospheric methane removal processes and the uncertainties in these which remain today. Some loss of atmospheric methane occurs from soil oxidation processes, but this is currently thought to be much less important than the atmospheric chemistry; Keller et al., (1986) estimate that about 3% and Seiler & Conrad (1987) about 6-10% of the total global CH, emissions are lost through soil oxidation processes. By far the largest of the loss terms for methane results from its atmospheric chemistry.
2. The gas-phase chemistry of methane removal in the troposphere
It is the consensus of scientists today that the major loss of methane in the atmosphere (90-97%) comes from its reaction with the HO-radical, and this reaction is thought to occur largely within the lower 6 km of the troposphere. There is general agreement that the elementary reaction (1) describes this process well:
The rate coefficient (k,) for this reaction has been determined by a number of different investigators over the past 25 years. However only a few of these studies relate directly to the conditions of the troposphere. Recently measurements of k, by Ghyanshyam & Ravishankara (1991) have shown that for the temperatures of the troposphere the rate coefficient is described well by the function, k,
-
1.59x 10" PE4 exp(-978/T) cm3 molecule-' s-' (precision, S%, 20; accuracy unknown); this gives estimates of k, at typical tropospheric temperatures (273 K) which are about 15% smaller than the values which have been accepted until recently. This finding is of major importance in that it suggests that 490 Tg yr" of CH, removal by reaction (1) occurs rather than the 590 Tg yr" based upon the earlier k, estimates. Alternatively, if the previously suggested 590 Tg yr-' tropospheric input of CH, is correct, then there must be a large missing sink for CH, in the troposphere.
The isotopic composition of tropospheric methane can be used as a marker to test the consistency of the suggested importance of the various sources and the removal reactions for methane in the troposphere. This is based upon the fact that many of the different sources of methane have a characteristic "CHdI3CH, ratio (e.g., see: Stevens & Rust, 1982; Tyler, 1986; Stevens & Engelkemeir, 1988; King et al., 1989) which can be compared with that seen for methane collected in the troposphere in various regions. The observed atmospheric "CHdI3CH, ratio depends not only on the
distribution and strength of the various sources, but on the extent of discrimination between the two isotopic species which is shown by the HO-radical in its reactions (la) and (1 b) and in soil oxidation as well:
HO
+
l2CH,+
H,O+
',CHI HO+
"CH,+
H,O+
"CH,The ratio k , , / k,, has been determined in several studies (Stevens & Rust, 1982; Davidson er al., 1987; Cantrell et al., 1990). In the most recent of these, Cantrell ef al. (1990) give: k,, / k,,
-
1.0054& 0.0009, independent of temperature (0-80'C). The kinetic isotope effect for soil oxidation of methane is significantly larger (klZCH4 / k1wH4
-
1.021). These kinetic data and source strength and sink inventories have been used to test our estimates of the magnitudes of the various sources and sinks, but the large uncertainties in the estimates available today, do not allow an unambiguous check on their consistency.The carbon-containing species formed as HO reacts with CH, are indicated in Fig.1. Each of transformation reactions has been reasonably well characterized in previous studies and evaluated in a recent review by Ravishankara (1988). It can be seen in Fig.1 that the transformation of CH, into CO and ultimately into CO, occurs following a series of intermediate reactions. Transient reactive species, including the HO-,
H0,-
and CH,O,-radicals, are involved in the transformation, and these radicals lead to molecular products including methyl hydroperoxide (CH,O,H), methanol (CH,OH), methyl- peroxynitrate (CH,O,NO,), and formaldehyde (CH,O). The interaction of these molecular products and radicals influence the level of ozone in the atmosphere. Not shown in the Fig.1 are the reactions of the transient peroxy radicals with NO in which NO, and ultimately 0, are formed in the chain reaction sequence (2) through (6); 0, is destroyed in (7) and (8):HO,
+
NO+
HO + NO, CH,O, + NO+
CH,O+
NO, CH,O + 0, + CH,O+
HO,NO, + hy -+ o(~P)
+
0,O(~P) + 0, (+OD,) + 0,
w m
HO
+
0, + H 0 2 + 0, HO,+
0, -+ HO + 20,Whether ozone is made or destroyed in the troposphere depends largely on the magnitude of [NO,]
([NO]
+
[NO,]) which is present (Liu & Trainer, 1988). [NO,] is highly variable in the troposphere, reflecting variations in the magnitudes of the anthropogenic and natural inputs of NO,. Whether the local [NO,] results in 0, formation or destruction is a very important question, since the concentration of ozone is critical in determining the rate of the methane loss; see the following discussion.3. Estimation of the methane tropospheric loss rates
It may seem at first sight that the problems of estimating the rate of methane loss should not be great, since there is a single reaction (1) which dominates methane's destruction in the troposphere, and its rate coefficient is known reasonably well today. At any point within the troposphere the rate of methane loss should be given simply by: QH4 = k,[CH,][HO]. However accurate estimates of the rate of reaction (1) which occur in the troposphere are nontrivial, since these require not only a knowledge of the rate coefficient, but also concentrations of both reactants in (l), including the transient hydroxyl (HO) radical. The HO-radical concentration is determined by the complex chemical interactions of many trace gases present in the troposphere including the many products of the oxidation of methane itself. Clearly the accurate estimation of tropospheric methane loss rates is fraught with difficulties.
150 COMMISSION ON ATMOSPHERIC CHEMISTRY
Fig. 1. The transformation pathways of the carbon-containing species in the HO-radical initiated oxidation of methane in the troposphere
A. The theoretical estimation of tropospheric methane loss rates. Although various methods for the direct detection of HO-radicals in the troposphere have been developed (e.g., Felton et al., 1990;
Ehhalt et al., 1991; Eisele & Tanner, 1991; Hofzumahaus et al. 1991; Mount & Eisele, 1992), these methods have been employed to date in very restricted use to measure [HO] at isolated ground positions; they are not now suitable to make measurements throughout the troposphere which will be representative of all seasons and locations for the variety of conditions (various latitudes, longitudes, altitudes, cloud cover, aerosol content, solar zenith angle, overhead 0, column, etc.) which are commonly present. Direct measurements will probably be an important input for our use in the near future. For now we must rely on more indirect methods of [HO] estimation. Atmospheric chemists often model the chemistry of the troposphere to derive theoretical [HO] distributions and average hydroxyl radical concentrations which can be used to estimate CH, removal rates (e.g., see the summary Table 1 of Taylor et al., 1991). The accuracy of such theoretical estimates is unknown, but their uncertainty is very high in view of the many unknown yet important parameters (reactant concentrations, cloud cover, etc.) which must be estimated.
The generation of ozone in the troposphere is key to the rate of methane removal in reaction (l), since the photodecomposition of ozone is the major atmospheric source of the HO-radical through reactions (9) and (10):
0, + hv(k330 nm)
-+
O('D)+
O,('A, or 'Xi)O('D) + H,O
+
2 H 0OOD) + M(N,.o,)
+
OCP) + M(9) (10) (1 1 )
The narrow band of wavelengths from about 290-330 nm which penetrates the earth's ozone layer and arrives within the troposphere is responsible for the occurrence of reaction (9). The O('D) atom produced is an electronically excited oxygen atom (O-singlet D) which is highly reactive toward gaseous water molecules; each O('D) atom forms two HO-radicals in nearly every collision with a water molecule. However quenching of the O('D)-atom occurs as it collides with the more abundant molecules of oxygen and nitrogen in the atmosphere (reaction 11). The resulting encounter creates a ground state oxygen atom (O(3P)) which quickly associates with an oxygen molecule to reform ozone in (6). For many reasons which we will discuss, it is the estimation of the rate of HO-radical generation which introduces the greatest uncertainty in the estimation of the methane loss rate in the troposphere.
Commonly the rate of O('D) formation in the atmosphere, jo3, is calculated from equation (12) and a knowledge of the ozone cross sections, o(h), the quantum yields,
$(A),
of O('D) formation from 0, photodecomposition, and the spectral actinic flux, S(h), in the troposphere (e.g., Madronich & Granier, 1992):jQ
-
p ( M o ) W ) d h (12)The integral in (12) extends over all wavelengths where the product o(h)$(h)S(h) is non-zero. The rate of HO-radical generation from reaction (10) can be determined using the calculated j,,, and equation (1 3):
Rate of HO generation from (10)
-
[0,I2j,,{kt,[H,O]/(k,,[H,O]+
k,,[M])} (13) Reaction (10) is not the only source of OH-radicals, but there are sereral minor sources as well; e.g., HO,+
NO+
HO+
NO,. The estimation of the total rate of HO-radical generation requires additional information on these processes (e.g., [HO,], [NO], rate coefficients, etc.). The total rate of HO-radical generation, RHWtotal)r is somewhat greater than given by equation (13). The calculation of the concentration of OH at a given location in the troposphere through equation (14) requires a knowledge of HO-radical loss terms as well as RHatota,):Here ki is the rate constant for the reaction of HO-radical with Xi, the ith component of the trace gases in the troposphere which is reactive toward HO. Xi represents the many HO-reactive species including methane, carbon monoxide, formaldehyde, methanol, methyl hydroperoxide, hydrogen peroxide, oxides of nitrogen, etc. Obviously if we are to calculate [HO] accurately at many representative locations within the troposphere, then we must know or estimate the local concentration of the major reactants with HO ([Xi]) as well as the local [O,] and [H,O]. This is a very complicated and seemingly impossible task; resort of modellers to the use of approximate modelling efforts is understandable.
If one utilizes equations (13) and (14) to derive the rate of HO generation and the concentration of HO, respectively, then major inaccuracies result from the uncertainties in the experimental estimates of o,
4,
and S. Current recommendations show a combined uncertainty in the product o$ of 40%(DeMore et aE., 1990). Uncertainties in the values of S, the actinic flux, are also probably high and variable in magnitude as atmospheric conditions change. Clear sky values of S have been estimated from solar flux measurements by extrapolation from high altitude measurements by attenuating the radiation using the measured 0, columns for the particular location and appropriate molecular and aerosol scattering (e.g., Luther & Gelinas, 1976; Demerjian et al., 1980; Michelangeli et al. ,1992).
The presence of clouds in the troposphere, a common occurrence, introduces further uncertainties in calculations as a result of the change in albedo in regions above the clouds and changes (increase or decrease) in the intensities of light transmitted and scattered through the clouds in regions below clouds (e.g., Madronich, 1987; Harrison et al., 1990; Hartmann & Doelling, 1991). There are some relatively unexpected complications in estimating the appropriate S values in atmospheres rich in aerosols. For example, Michelangeli et al. (1992) estimate theoretically that one consequence of a volcanic eruption similar to that of El Chichon in 1982 is an increase in the midday surface actinic flux at 20"N latitude, summer, by as much as 45% in the jo3-sensitive region at 290 nm.
The decrease in stratospheric ozone and the increase in tropospheric ozone concentrations which have been noted in recent years add further complications to the theoretical estimation of tropospheric jo3 values. Liu & Trainer (1988), Gery (1989), and Thompson (1992) have examined various aspects of the sensitivity of tropospheric chemistry to UV changes resulting from stratospheric ozone depletion and tropospheric ozone increases. Madronich (1 992) has estimated from the ozone depletion reflected in the total atmospheric ozone measurements of Herman et al. (1991) and Stolarski et al. (1991), that the extent of penetration of the short wavelength UV is expected to have increased substantially in
152 COMMISSION ON ATMOSPHERIC CHEMISTRY
recent years, particularly at mid and high latitudes of both hemispheres. Madronich & Granier (1992) have shown in theory that the zonally and annually integrated trends in the tropospheric jm values are +3.8 f 2.9% per decade in the Northern hemisphere and +4.1 f 2.7% per decade in the Southern hemisphere. They note that this effect alone could account for a large part of the slowing in the rate of increase of methane (about 4.7-11.8% per decade) which has been reported in a recent
W M O
assessment (1 992).
Note in equation (13) that not only the jm values are critical to the estimation of HO levels, but also the [H,O] in the given region of the atmosphere is directly involved as well. Local water concentrati- ons in specific regions of the troposphere have been determined in many previous studies. However [H,O] estimates for locations throughout the troposphere are usually of uncertain accuracy, since they are derived by extrapolation from the very limited number of rather site specific measurements which may or may not be representative. One must conclude that theoretical estimations of the rate of reaction (1) in the troposphere must be highly uncertain, largely as a result of the great uncertainties in the estimations of jm.
B. Estimation of tropospheric methane loss rates through j m experimental estimates. Both the theoretical and experimental determinations of j have inherent problems which lead to significant uncertainties; however the direct measurement of jm in the troposphere offers an attractive alternative to its theoretical calculation described above. One can determine jm values experimentally at specific points in the atmosphere through the use of specially designed actinometers. Chemical actinometer methods have been employed in some previous determinations. Bahe et al. (1979), Dickerson et al.
(1982), and Blackburn (1984) have exposed dilute mixtures of ozone in N,O to sunlight; the 0, photolysis and the subsequent rate of product generation from the O('D) reactions (15) and (16) with N,O constitute the scientific basis for the use of the instruments in j,, measurements:
03.
O('D)
+
N,O+
2NO (15)(16)
Bahe et al. measured N, formed in (16), while Dickerson et al. and Blackburn measured the products of the reaction of 0, with the NO produced in (15). Both methods require a knowledge of the fraction of the O('D) which reacts by each of two channels. DeMore et aL(1990) estimate that the uncertainty in k,, and k,, is about 30%; the required ratios, (kI5
+
kI6)/kl5 or (kI5+
k,6)/k,6, probably have a somewhat lower uncertainty, since only ratios of reactant and products are required. New estimates of these ratios should be made so that j,, and [HO] can be made with less uncertainty from actinometric data in the future.O('D)
+
N,O+
N,+
0,In view of the experimental complications in the measurement of jm over wide regions of the earth and for the many atmospheric conditions which are encountered, the use of calibrated radiometers appears to offer an attractive alternative. However a suitable radiometer should have the following characteristics: (1) it should integrate with equal efficiency the light independent of the angle of incidence; i.e., it should have either a 4n angular response or have combined 2n-upward looking and 2n-downward looking detectors (not a flat-plate receiver); 2) it should be calibrated at regular intervals with a reliable chemical actinometer system; and 3) it should have a wavelength response very similar to the action spectrum of ozone within the troposphere (290-330 nm). A radiometer which appears to satisfy most of these requirements has been employed to derive jm estimates in the atmosphere at the surface of the Atlantic Ocean from 50"N to 30"s during September and October, 1988 (Brauers &
Hofzumahaus, 1991).
An alternative approach which combined measurements and theory has been used by Hanser & Sellers (1980) to estimate jm in the 1977 GAMETAG flights. An ultraviolet spectro-inadiometer was used to measure downward-going solar flux in the 290 to 410 nm spectral region. Broadband pyranometers were used to measure the ratio of upward-going to downward-going flux in the 300 to 400 nm range to derive a ground albedo. These data were combined with atmospheric scattering calculations, and published values of o and Q to derive local estimates of j,. They concluded that the accurate determination of jm requires measurement of UV fluxes.