http://dx.doi.org/10.1351/PAC-CON-13-03-04
© 2013 IUPAC, Publication date (Web): 29 June 2013
[Ru(bpy) 3 ] 2+ * and other remarkable metal-to- ligand charge transfer (MLCT) excited states*
David W. Thompson
1, Akitaka Ito
2,†, and Thomas J. Meyer
2,‡1Department of Chemistry, Memorial University of Newfoundland, St. John’s, Newfoundland A1B 3X7, Canada; 2Department of Chemistry, The University of North Carolina at Chapel Hill, Chapel Hill, NC 27599-3290, USA
Abstract: In 1974, the metal-to-ligand charge transfer (MLCT) excited state, [Ru(bpy)3]2+*, was shown to undergo electron transfer quenching by methylviologen dication (MV2+), inspiring a new approach to artificial photosynthesis based on molecules, molecular-level phenomena, and a “modular approach”. In the intervening years, application of synthesis, excited-state measurements, and theory to [Ru(bpy)3]2+* and its relatives has had an outsized impact on photochemistry and photophysics. They have provided a basis for exploring the energy gap law for nonradiative decay and the role of molecular vibrations and solvent and medium effects on excited-state properties. Much has been learned about light absorption, excited-state electronic and molecular structure, and excited-state dynamics on timescales from femtoseconds to milliseconds. Excited-state properties and reactivity have been exploited in the investigation of electron and energy transfer in solution, in molecular assem- blies, and in derivatized polymers and oligoprolines. An integrated, hybrid approach to solar fuels, based on dye-sensitized photoelectrosynthesis cells (DSPECs), has emerged and is being actively investigated.
Keywords: excited-state chemistry; metal-to-ligand charge transfer; photochemistry;
tris(bipyridine)ruthenium(II) cation.
INTRODUCTION
The metal-to-ligand charge transfer (MLCT) excited states of [Ru(bpy)3]2+(bpy is 2,2'-bipyridine) and related polypyridyl complexes of RhIII, IrIII, RuII, OsII, and ReIhave a notable history and outsized impact in photochemistry and photophysics [1–7]. The impact is clear, evidenced by 10 000s of publi- cations to date and a wide range of applications in sensing, displays, electroluminescence, electro- chemiluminescence, photoelectrochemistry, and artificial photosynthesis [8–12]. MLCT excited states have crossed the divide between theory and experiment with the results of time-dependent perturbation theory applied to excited-state dynamics and spectroscopic measurements providing deep insight into excited-state electronic and molecular structure and the role that they play in excited-state reactivity and dynamics.
*Pure Appl. Chem.85, 1257–1513 (2013). Paper based on the acceptance lecture for the 2012 Porter Medal, presented at the XXIVthIUPAC Symposium on Photochemistry, Coimbra, Portugal, 15–20 July 2012.
†Current address: Department of Chemistry, Graduate School of Science, Osaka City University, Osaka 558-8585, Japan
‡Corresponding author
Coordination chemistry
Progress has come by integrating synthesis, excited-state measurements, and theory. The synthetic chemistry of RuIIand OsIIpolypyridyl complexes begins in the 1940s and 1950s in a series of papers by Dwyer, Gyarfas, and their co-workers, including Alan Sargeson and David Buckingham. They devel- oped synthetic routes and established a systematic basis for the coordination chemistry [13–20].
Synthesis was further elaborated at The University of North Carolina at Chapel Hill, in the 1970s, notably by Pat Sullivan, and has been extended since by many with notable contributions, for example, by Constable, Balzani, and others [21–26].
The properties of these second- and third-row transition metal dπ6complexes are ideal for stud- ies of excited states and electron transfer. Their electronic configurations and the large ligand-field split- tings between dπand dσ* orbitals (t2gand egin Ohsymmetry) inhibit ligand substitution. Slow ligand exchange poses a challenge for synthesis but, once complexes are made, they are stable which is essen- tial for studies in photochemistry and electron transfer. For polypyridyl complexes of Ru and Os, coor- dinative stability extends to other electronic configurations, to dπ5and dπ4complexes of MIIIand MIV, and even to dπ3complexes of MV[27,28]. Coordinative stability for non-macrocyclic ligand systems is lost for analogous first transition metal complexes of Fe. For FeII, the ligand-field splitting between dπ and dσ* orbitals is decreased by ~30 % compared to Ru. Barriers to ligand substitution are lower and lability greater, which causes a loss of coordinative stability and ligand scrambling.
In strong field ligand environments, notably with backbonding CO ligands, spectroscopically accessible MLCT excited states exist in complexes of other dπ6metals such as [M(bpy)(CO)4] (M = Mo, W) and [Re(bpy)(CO)3(py)]+(py is pyridine). Because of their low oxidation states, stabilization of the dπlevels by backbonding to CO is required for stability and for creating an appropriate dπ- π*(bpy) energy gap for accessing lowest-lying MLCT excited states. However, oxidation of these com- plexes and loss of dπ-π*CObackbonding labilizes the CO ligands leading to coordinative instability limiting their use in electron-transfer and excited-state applications [7,29,30].
Coordinative stability in multiple oxidation states for Ru and Os has provided a remarkably rich, high oxidation-state chemistry for these metals, largely oxo-based dπ4, dπ3, and dπ2MIV, MV, and MVI oxo and di-oxo complexes [27,28,31]. The polypyridyl ligands are also redox active based on low-lying π* acceptor levels on the ligands. These levels provide the electronic basis for intramolecular charge transfer and the appearance of accessible MLCT excited states.
Coordinative stability has provided a basis for controlled synthetic modification and with it, the use of synthesis to modify and control light absorption and excited-state properties and excited-state electron and energy transfer systematically. Ligand-based organic synthesis has opened the door to mul- tiple linkage strategies for incorporating MLCT excited states into preformed polymers and peptides, and in ligand-bridged molecular assemblies [32]. Related strategies have been employed to link ground- state precursors to the surfaces of conductors and semiconductors where they provide the light absorp- tion/injection/electron transfer properties at the heart of device applications in dye-sensitized solar cells (DSSCs) and dye-sensitized photoelectrosynthesis cells (DSPECs).
Why are MLCT excited states of interest?
In the early 1970s, Fujishima and Honda made a remarkable discovery [33]. They reported that direct band gap excitation of anatase TiO2with an applied bias in a photoelectrochemical cell (PEC) resulted in water splitting into hydrogen and oxygen. Although limited to UV excitation, their observation was provocative in suggesting a way to mimic the natural photosynthetic apparatus in using sunlight to cre- ate high energy fuels through “artificial photosynthesis”.
In 1974, excited-state electron transfer by [Ru(bpy)3]2+* was first reported [34]. Excited-state electron transfer had been developed earlier by Weller and co-workers for organic excited states in a series of studies [35], and Adamson and co-workers had suggested that excited-state quenching of
[Ru(bpy)3]2+* by CoIIIammine complexes occurred by electron transfer earlier [36], but their results could also be explained by energy transfer.
Electron-transfer quenching of [Ru(bpy)3]2+* by methylviologen dication, MV2+, Scheme 1, was demonstrated at UNC by use of conventional flash photolysis [37]. Excitation of dπ6[Ru(bpy)3]2+gave the 3(dπ5π*bpy1) MLCT excited state, [Ru(bpy)3]2+*, and it was sufficiently long-lived, ~1 μs, to undergo diffusional electron-transfer quenching by MV2+, Scheme 1.
The series of reactions in Scheme 1 could be analyzed as the key energy conversion steps under- pinning another approach to artificial photosynthesis. In this approach: (i) Molecular-level light absorp- tion by [Ru(bpy)3]2+to give [Ru(bpy)3]2+* is a “light-harvesting” step with the incident light transiently stored as excited-state free energy. (ii) Electron transfer quenching of the excited state converts 2.1 eV of excited-state free energy into 1.7 eV of transiently stored redox energy as [Ru(bpy)3]3+and MV+. (iii) With their redox potentials—E°' = 1.23 V (vs. NHE) for the [Ru(bpy)3]3+/2+couple and E°' = –0.4 V for the MV2+/+couple—the quenching products are thermodynamically capable of splitting water into hydrogen and oxygen over an extended pH range. This initial observation, and others that soon followed, gave rise to the concepts “chemical approaches to artificial photosynthesis” [8,9,38] and
“artificial photosynthesis and solar fuels” with sunlight used to convert water into hydrogen and oxy- gen or to reduce CO2into a reduced carbon source—CO, CH3OH, or hydrocarbons [12,39,40].
Given its diffusional nature, electron transfer quenching by itself was unproductive. Excitation and quenching are followed by back electron transfer, Scheme 1, and the transiently stored redox equiv- alents are lost as heat. Exploitation requires integrating a light absorption/electron transfer capability into an architecture where the separate half-reactions for water oxidation and reduction can be driven while minimizing competition from back electron transfer.
Artificial photosynthesis. Attempts to carry out artificial photosynthesis and implement new energy technology strategies have taken on a new sense of urgency driven by the goals of energy secu- rity and a sustainable energy future and concerns about environmental damage from the use of hydro- carbon fuels. Photosynthesis in green plants is an inspiration, but also an object lesson in complexity. It is amazingly complex with 5 integrated, membrane-bound assemblies—photosystem I (PSI), photo- system II (PSII), ... —involving thousands of atoms bound in the thylakoid membrane of chloroplasts with the external Calvin cycle used for CO2reduction and has remained unchanged for 2.4 B years.
Water oxidation occurs at the reaction center in PSII [33,41–52]. In the first step, the antenna complex sensitizes a chlorophyll excited state, 1P680*, triggering a cascade of five coupled electron- transfer events with timescales ranging from ps to μs. The net result of electron transfer quenching is to drive electron transfer from the oxygen evolving complex (OEC) in the reaction center over a dis- tance of ~50 Å to plastoquinone to give the semiquinone PQ–(QB–) for later transport to PSI as the Scheme 1Photochemical events in the electron-transfer quenching of [Ru(bpy)3]2+* by MV2+.
hydroquinone, PQH2. At this distance, back electron transfer is sufficiently slow that it does not inter- fere with the water oxidation cycle, which requires three more photon activation steps and three addi- tional oxidative equivalents to reach the OEC and O2production to occur [49].
There is a need for a far simpler approach or approaches that can be implemented on vast scales with inexpensive materials in accessible architectures while minimizing environmental impact and overcoming complications from longevity, production, and distribution. At the device level, the basic principles are understood: light absorption; excited-state electron transfer; separation of electron trans- fer generated oxidative and reductive equivalents by free energy gradients; electron transfer activation of catalysts for multi-electron, multi-proton solar fuel half-reactions; integration/incorporation in a working device.
“Chemical approaches to artificial photosynthesis” based on a “modular approach” provides a way to meet these challenges based on molecular excited states and molecular assemblies [8,9,53]. The modular approach offers the advantage of investigating individual components for light absorption, etc., maximizing their performance, and integrating them into appropriate architectures. The modular approach offers the advantages of rapid iteration by chemical synthesis and the ability to study indi- vidual components separately [53–55].
ELECTRONIC STRUCTURE
The major focus of this account is to summarize what we know about the ubiquitous excited state, [Ru(bpy)3]2+*, and its cousins, and what makes them behave as they do. At first glance, the story seems simple. Following visible near-UV excitation of [Ru(bpy)3]2+, [Ru(bpy)3]2+* appears, seemingly as a single excited state, sufficiently long-lived to be at equilibrium with its surroundings with its own char- acteristic free energy content (2.19 eV) and redox potentials with E°' = 0.85 V (vs. SCE in CH3CN at I= 0.1 M) for the excited state as an oxidant at room temperature, [Ru(bpy)3]2+* + e–→[Ru(bpy)3]+, and E°' = –0.92 V (vs. SCE in CH3CN atI= 0.1 M), for the excited state as a reductant, [Ru(bpy)3]3++ e–→[Ru(bpy)3]2+*, (“MLCT Excited States: Redox Potentials” section). As described in the “Excited- State Reactions” section, excited-state redox potentials for [Ru(bpy)3]2+* have been estimated by a kinetic quenching technique with application of electron-transfer theory [56], or, more straightfor- wardly, by a Franck–Condon analysis of emission band shapes as described in the “MLCT Excited States: Redox Potentials” section [57,58].
However, as we will see below, describing [Ru(bpy)3]2+* as a single state is deceiving. Its elec- tronic structure is remarkably complex.
A room temperature absorption spectrum in CH3CN is shown in Fig. 1 [59]. Visible light absorp- tion is dominated by MLCT transitions of relatively high absorptivity, with molar extinction coefficients in the 10 000s M–1cm–1. Light absorption into these transitions gives MLCT excited states that are largely singlet in character, 1(dπ6) ⎯⎯hν→1(dπ5π*1). Although difficult to discern for [Ru(bpy)3]2+, a low absorptivity shoulder also appears on the low-energy (long-wavelength) side of the lowest-energy MLCT absorption band manifold. It arises from a direct MLCT transition from the ground state to a lowest-energy MLCT triplet state (or states, see below), 1(dπ6) ⎯⎯hν→3(dπ5π*1) (MLCT(1)), to give the
“[Ru(bpy)3]2+*” by direct excitation. From spectroscopic measurements, the energy splitting between the lowest (dπ5π*1) singlet and triplet states is 1700 cm–1[60].
In the spectrum in Fig. 1a, an additional MLCT band appears in the near-UV between 300 and 350 nm. It arises from a second set of MLCT transitions to the π*2 level on the bpy ligands,
1(dπ6)⎯⎯hν→3(dπ5π*21) (MLCT(2)). The corresponding triplets for these bands appear at lower-energy and are masked by overlapping absorptions. Absorptivity in the UV is dominated by ligand-based π → π* transitions.
The band shapes of the MLCT absorption bands include contributions from multiple vibronic contributors. These bands are largely broadened into single, broad absorption bands at room tempera- ture with evidence for vibronic structure. Figure 1b shows the results of a single-mode Franck–Condon
analysis of the low-energy MLCT band, which gives the characteristic parameters E0, the ν= 0 to ν* = 0 energy gap, the vibrational spacing, ω, and the band width at half-maximum, Δν∼1/2. The spectral fit- ting procedure will be discussed in more detail for emission in the “Emission spectral fitting” section.
At lower temperatures, dramatically at 4.2 K in single crystals, a complex vibronic structure appears in the spectra [61,62]. As discussed in the “MLCT Excited States: Molecular Structure” section, it arises from a series of coupled medium-frequency ν(bpy) modes with Ru-N and bpy ring torsional modes con- tributing at lower frequency.
The appearance of nominally spin-forbidden 1(dπ6) ⎯⎯hν→3(dπ5π*1) transitions in the absorption spectrum of [Ru(bpy)3]2+is due to spin-orbit coupling. Spin-orbit coupling mixes orbital and spin char- acter in the electronic wave functions with the extent of singlet character dictating absorptivity. Singlet- triplet mixing depends on the square of the spin-orbit coupling constant, ζ, which for Ru and Os are ζRu= 1100 cm–1and ζOs= 3000 cm–1. Spin-orbit coupling results in 10 % singlet character in the low- est “3MLCT” state for [Ru(bpy)3]2+*, ~30 % for [Os(bpy)3]2+*. Its impact on absorption spectra is illustrated by the comparison between [Ru(bpy)3]2+ and two OsII complexes in Fig. 2. The greatly enhanced 1GS →3MLCT absorptivities for the OsIIcomplexes is due to the dependence of the transi- tion dipole on ζ2[60,63].
Fig. 1Absorption spectrum of [Ru(bpy)3](PF6)2in CH3CN at room temperature (a) and enlargement for its MLCT absorption band (black in (b)). Gray curve represents the one-mode Franck–Condon theoretical fit with E0= 21 940 cm–1, Δν∼1/2= 1770 cm–1, ω= 1610 cm–1, and S= 0.68. See the “MLCT Excited States: Molecular Structure”
section for details.
Fig. 2 Absorption spectra in CH3CN illustrating the low-energy 1[(dπ)6] → 3[(dπ)5(π*)1] transitions for [Ru(bpy)3](PF6)2(solid curve), [Os(bpy)2(Ph2PCH2PPh2)](PF6)2(broken curve), and [Os(bpy)2(CH3CN)2](PF6)2 (dotted curve). Adapted from ref. [59].
A closer look: Multiple MLCT states and transitions
A coordinate axis system for [Ru(bpy)3]2+* is shown in Fig. 3. It illustrates the three bpy ligands, labeled as p, q, r, with the excited electron in the lowest triplet MLCT state—3(dπ5π*1) 3MLCT—in π*1of bpy ligand p. The corresponding hole in dπ5is shown aligned along the π* acceptor where it maximizes electrostatic interactions with the excited electron.
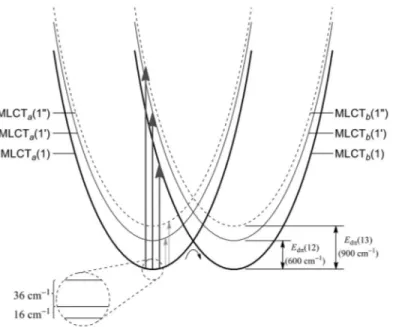
Figure 3 illustrates the donor/acceptor orbital pair for the lowest of three degenerate 3MLCT states, 3MLCT(1). With the excited electron held at bpy p, there are two additional MLCT excited states at higher energy. In these states, 3MLCT(1') and 3MLCT(1"), the hole in the dπ5core is rotated away from the electron in the acceptor bpy ligand. As noted below in Fig. 4, these states lie ~600 and
~900 cm–1above 3MLCT(1) for [Os(phen)3]2+* (phen is 1,10-phenanthroline). For all three states, the labels 1, 1', 1" refer to occupation of the lowest π*(bpy) level on one of the three bpy ligands with the hole in one of three different dπlevel.
The electronic structure of [Ru(bpy)3]2+* is further complicated by the presence of three iso-ener- getic π* acceptor levels—on the separate bpy ligands, bpya, bpyb, and bpyc, labeled as p, q, and rin the original drawing in Fig. 3. Consequently, in [Ru(bpy)3]2+* there are three degenerate lowest-lying
3MLCT(1) states, 3MLCTa(1), 3MLCTb(1), and 3MLCTc(1). The added labels define the bpy ligand occupied by the excited electron. Each of these states has two additional higher-energy states with the Fig. 3Coordinate axis system for [Ru(bpy)3]2+illustrating the bpy ligands—p, q, r—and the lowest-energy MLCT state with the dπ5hole aligned along the electron acceptor ligand p.
Fig. 4Transient near-IR spectrum of [Os(phen)3]2+in CD3CN at 298 K (obtained 20–40 ns after 450-nm laser flash excitation) and energy diagram illustrating the orbital basis for the low-energy 3MLCT(1) →3MLCT(1) absorption at 5460 cm–1. Spectrum adapted from ref. [64].
hole rotated away from the excited electron, 3MLCTa(1'), etc. and 3MLCTa(1"), etc. All told, there are three lowest-energy, degenerate MLCT excited states and six more MLCT statessufficiently low-lying to be appreciably populated at or near room temperature and contribute to excited-state properties.
As shown in Fig. 4, there is experimental evidence for multiple MLCT excited states. It shows a transient near-IR spectrum obtained following laser flash MLCT excitation of [Os(phen)3]2+in CD3CN [64]. In the spectrum of the MLCT 3(dπ5π*1) excited state(s), characteristic transient features appear in the visible including a broad bleach with λmin= 440 nm arising from loss of ground-state OsII→phen MLCT absorption. A low intensity feature also appears at λmax~ 600 nm from (phen•–) →OsIIIligand- to-metal charge transfer (LMCT) [65]. As shown in Fig. 4, in addition to the visible absorption features, a new, Gaussian-shaped band appears in the near-IR at λmax= 1830 nm (ν∼= 5460 cm–1) with εmax≥ 5000 M–1 cm–1and Δν∼1/2= 1840 cm–1[64]. Transient absorption measurements show that this absorp- tion feature decays exponentially with k= 6.1 ×10⁶s–1(τ= 160 ns) in reasonable agreement with k= 8.3 ×10⁶s–1(τ= 120 ns) for [Os(phen)3]2+* excited-state decay by transient emission measurements.
Consistent with the electronic structure model and Fig. 4, the near-IR band at 5460 cm–1 for [Os(phen)3]2+can be assigned to a composite of three overlapping transitions that interconvert the low- lying MLCT states in [Os(phen)3]2+*; 3MLCT(1), 3MLCT(1'), and 3MLCT(1"). All three are spin- allowed, triplet–triplet transitions with the spin character of the excited states highly mixed by spin- orbit coupling.
• At low energy, there is a contribution from degenerate inter-MLCT transitions, 3MLCTa(1)⎯⎯hν→
3MLCTb(1)—3(dπ12dπ22dπ31π*1,a1) ⎯⎯hν→ 3(dπ22dπ32dπ11π*1,b1)—and 3MLCTa(1) ⎯⎯hν→
3MLCTc(1). These transitions result in net dipole rotation and interconversion between the three components of 3MLCT(1). For 3MLCTa(1) ⎯⎯hν→3MLCTb(1), simultaneous transfer of electrons occurs from dπ1to dπ3and π*1,ato π*1,b.
• At intermediate energy, excitation results in electron transfer from π*1,ato π*1,b, π*1,cwith the hole unchanged—3(dπ12dπ22dπ31π*1,a1) ⎯⎯hν→3(dπ12dπ22dπ31π*1,b1). This is a ligand-to-ligand charge transfer (LLCT) transition with conversion from 3MLCT(1) to 3MLCT(1').
• At still higher energy, excitation of 3MLCT(1) to 3MLCT(1") occurs—3(dπ12dπ22dπ31π*1,a1)
⎯⎯hν→3(dπ12dπ21dπ32π*1,b1). This transition also involves simultaneous dπ →dπand π* → π* electron transfer and dipole rotation.
The intensity of the absorption band at 5460 cm–1is dominated by the LLCT transition since it involves single electron excitation and has significant radial character. It is fully allowed with its inten- sity dependent on the extent of π*1,a-π*1,belectronic wave function mixing through OsIII.
Splitting the triplet states
There is an additional complication based on the nominal “triplet” character of the lowest MLCT state(s). As shown by Crosby and co-workers, from temperature-dependent emission lifetime measure- ments, the lowest 3MLCT “state” is really a manifold of three states. Each of the 3MLCT(1) states,
3MLCTa(1), etc., are further split by electron-exchange interactions and spin-orbit coupling into three sublevels [66]. Based on a theoretical analysis by Kober et al. [60,67], the lowest of the three is a pure spin triplet with the additional sublevels lying 10 and 61 cm–1higher in energy [68].
Low-temperature spectra
The complexity of excited-state structure is further shown in the polarized, 8 K single crystal spectra in Fig. 5. Also shown in Fig. 5 is a molecular orbital scheme used to fit the spectra. Based on the results of this analysis, transitions to 24 excited states of varying singlet and triplet character, split by spin-orbit coupling and electron exchange appear in the visible MLCT spectrum [60].
What exactly is [Ru(bpy)3]2+*?
The results of the analysis of electronic structure are both revealing and disconcerting. What we com- monly refer to as “[Ru(bpy)3]2+*” is really a manifold of three degenerate 3MLCT states having dif- ferent orbital compositions and excited-state dipole orientations. The triplet components of each are fur- ther split by spin-orbit coupling and electron-exchange interactions. There are two additional sets of degenerate states—3MLCT(1') and 3MLCT(1")—populated at or near room temperature.
As discussed in the “Excited-state dynamics: Dipole reorientation and ILET” section, time- dependent polarization measurements show that the degenerate MLCT states are dynamically intercon- verted with rotation of the excited-state dipole occurring in tens of picoseconds [69]. For most purposes, describing [Ru(bpy)3]2+* as the excited state “3MLCT” with electronic configuration 3(dπ5π*1) is ade- quate. However, in lower-symmetry complexes, containing mixed polypyridyl ligands, e.g., [Ru(bpy)(bpy')(bpy")]2+, additional sets of non-degenerate π* acceptor orbitals are introduced and the degeneracy among 3MLCT states is lifted, resulting in more complex excited-state dynamics, poten- tially influencing excited-state reactivity.
As an example, in molecular assemblies with derivatized ligands having attached substituents for electron or energy transfer, interconversion among the low-energy MLCT states can play a dynamic role. This occurs in the anthracene-derivatized complex, [Ru(dmb)2(4-Me-4'-(CH2CH2An)bpy)]2+
(dmb is 4,4'-dimethyl-2,2'-bipyridine; 4-Me-4'-(CH2CH2An)bpy is 4-methyl-4'-(9-anthrylethyl)-2,2'- bipyridine). Analysis of ultrafast absorption-time traces following laser flash excitation in CH3CN showed kinetic components for the appearance of –3An on timescales of 23 and 72 ps [65]. In one inter- pretation of the data, the rapid component arises from excitation along the Ru–bpy–An axis followed by rapid, 3[RuIII(bpy•–)]–An →[RuII(bpy)]–3An, energy transfer. The slow component arises from Ru- dmb excitation followed by dipole reorientation, 3[(bpy•–)RuIII(bpy)]–An →3[(bpy)RuIII(bpy•–)]–An, and then energy transfer. Dipole reorientation dynamics will be discussed in the “Excited-state dynam- ics: Dipole reorientation and ILET” section.
Fig. 5Polarized absorption spectra for [Ru(bpy)3]2+in a single crystal at 8 K and the energy level scheme used to assign the spectra, adapted from ref. [60].
Localized or delocalized?
In 3(dπ5dπ*1) [Ru(bpy)3]2+* there is an inherent mixed-valence character with a single excited electron and three acceptor ligands. This ligand-based mixed-valence character is analogous to the metal-based mixed-valence character found in ligand-bridged mixed-valence complexes such as the famous “Creutz- Taube ion”—[(NH3)5Ru(pyrazine)Ru(NH3)5]5+[70–73].
In one limiting description of [Ru(bpy)3]2+*, the excited electron is “localized” on a single bpy ligand, [RuIII(bpy•–)(bpy)2]2+*, with a corresponding decrease in symmetry from D3in the ground state to C2 in the excited state. In the other, the excited electron is delocalized over all three ligands, [Ru(bpy1/3–)3]2+*, with the D3symmetry of the ground state preserved in the excited state.
The factors dictating localization or delocalization, both experimentally and theoretically, are understood [74–77]. In the absence of electronic coupling between sites, either metal–metal or lig- and–ligand, the difference in electron content—between RuII and RuIII or bpy and bpy•–—causes intramolecular structural differences and polarization changes in the surrounding solvent. With elec- tronic coupling and mixing of electronic wave functions, the excess electron is more equally shared between sites, decreasing these differences. In the classical limit, the transition between localization and delocalization occurs when 2HDA > λ with λ the classical reorganization energy, the sum of the intramolecular (λi) and solvent reorganization energies (λo) in the absence of electronic coupling. HDA is the resonance energy. Because of the difference in timescales between the coupled intramolecular and solvent modes, the transition between localized and delocalized can be complex and time-dependent [72,78].
The electronic structure model used to describe [Ru(bpy)3]2+* assumed localization in the excited state. The question of localization vs. delocalization has been the subject of controversy in the past with different interpretations given to the same sets of data [72,79–82]. Theoretical models have been devel- oped that assume delocalization [83], yet, as noted above, a localized model successfully predicts spec- tral properties. There is other evidence to support localization.
Solvent dependence
MLCT absorption bands are solvent-dependent. Figure 6 shows a plot of the visible MLCT absorption band maximum for [Ru(bpy)3]2+(Emax) plotted vs. the dielectric function in eq. 1 in 19 solvents. The relationship in eq. 1 arises from dielectric continuum theory with application of a “dipole-in-a-sphere”
model, which is also illustrated. In this model, the initial D3symmetry of the ground state is instanta- neously maintained in the solvent even after localized MLCT excitation occurs to give the C2excited state. On the timescale for the optical transition, ~10–15s, the orientational and translational motions of the surrounding solvent molecules are frozen with only the optical (electron cloud) part of the solvent
dielectric responding. As shown in the figure, following excitation, the solvent polarization reorients to the equilibrium distribution for the thermally relaxed excited state.
In eq. 1, Dopis the optical dielectric constant andμ
ethe vector dipole moment for the transition.
Based on the slope of the solvent dependence in Fig. 6 and eq. 1,μ
e= 14 ± 6 D and the transition length, the vector sum of all vector electronic displacements, is 2.4–3.0 Å.
(1) Stark (electric field) effect
The results of the Stark effect, electric field, measurements on [Ru(bpy)3]2+by Oh and Boxer [85] are also consistent with instantaneous localization and C2 symmetry in initially excited [Ru(bpy)3]2+*.
Based on an analysis of their data, the charge-transfer distance in the excited state was estimated to be 1.6 Å. With a center-to-center distance between Ru and the bpy ligand of 3.1 Å, the extent of charge transfer in the excited state was estimated to be ~0.6 [85].
Transient resonance Raman (TR3) and transient infrared (TRIR)
There is direct spectroscopic evidence for localization in thermally equilibrated 3[Ru(bpy)3]2+* in H2O and CH3CN based on the results of transient resonance Raman measurements, initially by Woodruff et al. [86]. In these experiments, Raman scattering, with resonance enhancement from the π → π*(bpy•–) absorption of the excited state at 355 nm was observed for a series of mid-IR ν(bpy) bands from 900 to Fig. 6Effect of solvent on the visible MLCT λmaxfor [Ru(bpy)3](PF6)2in 19 solvents, showing the variation in Emaxwith the solvent dielectric function in eq. 1, with a schematic illustration of the “dipole-in-a-sphere” model.
Data obtained from ref. [84]. The straight line in the plot represents the linear least-squares best fit with a slope of 3670 cm–1.
1700 cm–1. Raman band shifts to lower energy were observed consistent with localization on a single bpy ligand in the excited state [87,88].
The results of a transient mid-infrared (TRIR) study on [Ru(phen)3]2+* from 1450 to 1800 cm–1 on the nanosecond time in CD3CN [89] are shown in Fig. 7. This figure shows ground-state (top) and transient absorption difference spectra (bottom). There is clear evidence for localization in the differ- ence spectrum. For example, a band at 1413 cm–1splits into components at 1408 and 1421 cm–1in the excited state consistent with both phen and phen•–and the localized description [Ru(phen•–)(phen)2]2+* rather than [Ru(phen1/3–)3]2+*.
CONTROLLING LIGHT ABSORPTION: BLACK MLCT ABSORBERS
With the synthetic chemistry in place and a detailed understanding of electronic structure, it is possible to control light absorption and excited-state properties of polypyridyl complexes with a high level of control. The impact of ligand variations on other excited-state properties will be a major theme in future sections. The impact that they can have on light absorption is illustrated in the UV–vis spectra in Fig. 8.
The key to manipulating light absorption lies in the influence of the ligands on the energy gap between donor dπand ligand-based π* acceptor levels, note Scheme 2. σand πdonating ligands—X–, OH–, ...—mix with metal-based dσand dπorbitals increasing their energy which decreases the MLCT energy gap. Backbonding to ligands like CO, CN–, and PR3 stabilizes the dπ levels increasing the energy gap. Electron-withdrawing substituents on the bpy acceptor ligand(s) (–COOR, –NO2, …) decrease the energy gap and electron donor substituents (–NR2, –R, …) increase the energy gap.
Given the charge-transfer nature of the absorptions, there is a direct relationship between the absorption energy and redox potentials for metal-based dπ5/dπ6couples and ligand-based π*10/π*11 couples. This concept and the impact of the ligand set on MLCT light absorption and redox potentials have been developed in detail by Lever and co-workers who have provided a systematic basis for pre- dicting spectra and redox potentials based on a series of ligand-defined “Lever parameters” [90–92].
The dramatic effect that ligands can have on spectra is illustrated in Fig. 8 which compares spec- tra for three complexes—[Ru(bpy)3]2+, [Ru(4,4'-(COOEt)bpy)(dmb)(Et2dtc)]+ (4,4'-(COOEt)bpy is Fig. 7Gound-state (a) and TRIR difference spectra (b) of [Ru(phen)3](PF6)2in CD3CN at 298 K. Adapted from ref. [89].
2,2'-bipyridyl-4,4'-dicarboxylic acid diethyl ester; Et2dtc– is diethyldithiocarbamate anion), [Ru(4,4'- (COOEt)bpy)(dpb)(Et2dtc)]+(dpb is 2,3-bis(2-pyridyl)benzoquinoxaline). Ligand structures are illus- trated in the figure [93,94]. Introduction of the withdrawing ester substituents in 4,4'-(COOEt)bpy intro- duces a low-lying π* acceptor orbital and the electron-donating dithiocarbamate (dtc–) anion increases the dπenergy shifting the lowest-energy MLCT band into the low-energy visible. The dmb ligand intro- duces a second set of π* acceptor levels further broadening MLCT absorption.
The dpb complex is a true “black absorber” with light absorption occurring with relatively high absorptivity throughout the visible into the near-IR. Assignment of the prominent visible absorption features is also indicated for this complex in Fig. 8 with absorption dominated by MLCT transitions to π*1(dpb), π*1(4,4'-(COOEt)bpy), and π*2(dpb) at increasingly higher energies [93,94].
MLCT EXCITED STATES: MOLECULAR STRUCTURE
MLCT excitation to dπ5π*1 [RuIII(bpy•–)(bpy)2]2+* causes partial oxidation at the metal decreasing Ru–N bond distances [95,96]. The results of recent studies using picosecond X-ray absorption spec- troscopy on [Ru(bpy)3]2+* have revealed that the Ru–N bonds contract by 0.03 Å in the excited state [96]. Oxidation also results in loss of dπ–π*(bpy) backbonding which partly compensates for increased Fig. 8 Absorption spectra of [Ru(bpy)3](PF6)2 (solid curve), [Ru(4,4'-(COOEt)bpy)(dmb)(Et2dtc)]PF6 (dotted curve) and [Ru(4,4'-(COOEt)bpy)(dpb)(Et2dtc)]PF6(broken curve) in CH3CN at room temperature (adapted from ref. [94]). Ligand structures and transitions for the dpb complex are also shown.
Scheme 2Orbital basis for MLCT dπ6⎯⎯hν→(dπ5π*1) absorption.
σ-bonding in the excited state. Because of this effect, in [Os(bpy)3](PF6)2, the average Os–N bond dis- tance actuallydecreasesby 0.010 Å compared to [Os(bpy)3](PF6)3due to loss of back bonding in OsII [97].
Electron occupation of the antibonding π*bpy levels in [Ru(bpy)3]2+* leads to an increase in C–C/C–N bond distances as shown by spectroscopic measurements.
Time-resolved resonance Raman (TR3)
Time-resolved resonance Raman (TR3) measurements on [Os(bpy)3]2+, [Os(bpy)2 (Ph2PCH=CHPPh2)]2+, and [Os(bpy)(Ph2PCH=CHPPh2)2]2+ by Woodruff and co-workers revealed average excited-ground state shifts for 5 ν(bpy) modes of –48, –55, and –59 cm–1, respectively [87,88].
Analysis of the data based on Badger’s rule, which relates force constants and bond lengths in related structures, gave average C–N/C–C bond distance increases from 0.013 to 0.020 Å in the series. The increase correlates with an increase in energy gap from 14 200 to 20 900 cm–1and is due to an increase in the extent of charge transfer [86]. The phosphine ligands increase the energy gap by stabilizing the dπOslevels in the ground state by metal-to-ligand backbonding.
Emission spectral fitting
As shown in Fig. 9, vibrational structure is observed in the 77 K emission spectrum of [Ru(bpy)3]2+* in a 4/1 (v/v) EtOH/MeOH glass. The structure is lost in the room temperature spectrum due to thermal broadening. Also illustrated in the figure is the vibronic origin of the structure with transitions from level ν* = 0 in the excited state to level νin the ground state.
Information about excited-state structural change is also available by Franck–Condon analysis of spectral profiles. In the limit of a single coupled medium- or high-frequency mode, the emission spec- trum is given by eq. 2, which is constructed from a series of vibronic lines of quantum spacing, ω, Fig. 9Corrected emission spectra and spectral fits for [Ru(bpy)3](PF6)2in a 4/1 (v/v) ethanol/methanol glass at 77 K (black) and in CH3CN at 298 K (gray). A schematic illustration of the vibronic contributions is also shown.
Gray broken curves in the spectra are theoretical fits, see text. For the data at 77 K, a two-mode fit gave E0= 17 190 cm–1, Δν∼1/2= 690 cm–1, ωM= 1380 cm–1(SM= 1.08), and ωL= 400 cm–1(SL= 1.41). For the 298 K spectrum, E0= 16 370 cm–1, Δν∼1/2= 1740 cm–1, and ω= 1350 cm–1(S= 1.03).
originating from vibrational level ν* = 0 in the excited state to levels vin the ground state. The expo- nential distribution function broadens the lines by including solvent and low-frequency modes treated classically. λo,Lis the reorganization energy contributed by the solvent and low-frequency modes, ΔGES is the free energy of the excited state above the ground state, kBis the Boltzmann constant, and hcν∼is the energy of the emitted light at ν∼. The additional constants in eq. 2 are Avogadro’s number, NA, the transition dipole moment, μ
, and cthe speed of light.
(2)
Equation 3 provides a convenient way to analyze emission spectral profiles with I'(ν∼) the ratio of the intensity at ν∼to the intensity at the ν* = 0 →ν= 0 energy gap, E0. νand ωare the vibrational quantum number and quantum spacing and Δν∼0,1/2 the band width at half-height for the individual vibronic components. Sis the electron-vibrational coupling constant or Huang–Rhys factor, defined in eq. 4c [98,99].
(3) For [Ru(bpy)3]2+*, a series of 10–12 medium-frequency ν(bpy) ring-stretching modes, a low-fre- quency ring-torsional mode, and lower-frequency Ru–N stretching modes are all coupled to the transi- tion between states [100]. Coupled modes are those for which there is a change in equilibrium dis- placement, ΔQe, or quantum spacing between states. In the single, average mode approximation, contributions from the coupled medium-frequency modes are included as averages in Sand ω, eqs. 4, with the sum over vibrational levels ν. The electron-vibrational coupling constants are related to the reduced mass, M, angular frequency, ω, and equilibrium displacement as shown in eq. 4c. The averag- ing procedure is reasonably accurate if the spread in frequencies in the coupled modes is small com- pared to the average.
(4a) (4b) (4c) (5) In the single-mode approximation, the band width at half-height is given by eq. 5. It includes con- tributions from the solvent reorganization energy, λo, and coupled low-frequency modes treated classi- cally, λL. Application of emission spectral fitting to low-temperature data, such as the resolved vibronic structure for [Ru(bpy)3]2+* at 77 K in a EtOH/MeOH glass in Fig. 9 require inclusion of a second, low- frequency mode to account for low-frequency Ru–N stretching and ring torsional vibrations [86,101–106].
Emission spectral fitting was applied to a series of [Os(bpy)(L)4]2+and [Os(phen)(L)4]2+com- plexes with the energy gap varied by changing the ancillary ligands. Over the series, Sincreased lin- early from 0.65 to 1.2 as E0increased from 13 000 to 20 000 cm–1due to the increasing extent of charge transfer [107].
A similar relationship has been found for a series of ReIcomplexes, [Re(bpy)(CO)3(L)]+(L = py, ...) with Sincreasing from 0.95 at E0= 14 300 cm–1to 1.33 at E0= 18 040 cm–1[108].
Resonance Raman
The most complete analysis of excited-state structure has come from application of a treatment by Heller to the excitation dependence of resonance Raman band profiles [109–112]. Raman measure- ments give the frequency of the coupled modes, νj, and analysis of Raman band profiles Sjallowing for a complete evaluation of the role of individual vibrations on a mode-by-mode basis.
The Heller analysis was applied to the series [Os(bpy)3]2+, [Os(bpy)2(py)2]2+, and [Os(bpy)(py)4]2+with 13 coupled ν(bpy) modes from 1306 to 1006 cm–1, a ring-torsional mode at 662 cm–1, and low-frequency M–L stretching modes at 375 and 280 cm–1[113]. As shown by the com- parisons in Table 1, agreement between Sand ωvalues calculated from the mode-by-mode analysis and by spectral fitting is remarkably good. From the data in Table 1, Svalues, and contributions to the structural difference between ground and excited states for [Os(bpy)3]2+, are dominated by ν(bpy) ring stretching modes at 1558 and 1485 cm–1.
Table 1Comparison of single mode emission spectral fitting parameters in water at 23 °C obtained by emission spectral fitting and by a mode-by-mode analysis with averaging, see text [112].
(a) Simplex fitting routine
[Os(bpy)3]2+ [Os(bpy)2(py)2]2+ [Os(bpy)(py)4]2+
E0/cm–1 13 700 13 147 12 669
ωave/cm–1 1300 1300 1300
Save 0.90 0.67 0.70
Δν∼0,1/2/cm–1 1526 2017 1703
λo/cm–1 1021 1783 1271
(b) Average calculated from multi-mode Raman parameters [Os(bpy)3]2+ [Os(bpy)2(py)2]2+ [Os(bpy)(py)4]2+
E0/cm–1 13 650 13 200.00 12 700.00
ω/cm–1 1369 1370 1357
S 0.87 0.83 0.70
Δν∼0,1/2/cm–1 1799 1799 1799
λo/cm–1 1419 1419 1419
Transient Infrared: TRIR [114]
Application of TRIR to localization vs. delocalization in [Ru(phen)3]2+* was described in the
“Localized or delocalized?” section. A TRIR difference spectrum for 3[Re(bpy)(CO)3(4-Etpy)]+ (4-Etpy = 4-ethylpyridine) in CH3CN from 1850 to 2150 cm–1on the ns timescale is shown in Fig. 10.
A notable feature is the positive shifts in the ν(CO) bands of 40–80 cm–1and the change in ν(CO) band pattern. Both are consistent with the MLCT excited state, [ReII(bpy•–)(CO)3(4-Etpy)]+. The increase in
ν(CO) band energies is consistent with partial oxidation of ReI to ReII in the excited state with decreased dπRe-π*CO backbonding. The local mode compositions of the ν(CO) stretching normal modes are also shown in the figure. The three ν(CO) band pattern in the excited state from the two-band pattern for the ground state is due to the decrease in local electronic symmetry from ~C3v, with three facial pyridyl ligands, to Csin the bpy-reduced excited state [115–119].
Density functional theory (DFT) calculations on both ground and excited states for the series fac- [Re(4,4'-X2bpy)(CO)3(4-Etpy)]+(facis facial; X = CH3, H, and CO2Et) have been used to show how energy gap variations across the series, influence excited-state geometries and electronic structures.
Predicted bond length and angle changes in the excited states point to the importance of Re–CO σ-bond polarization and π*(4,4'-X2bpy)-π*(CO) mixing [120,121].
Solvent
The effect of solvent on MLCT absorption, emission, and excited-state dynamics has been discussed in a critical review [122]. As noted in the “Localized or delocalized?” section, excitation of [Ru(bpy)3]2+
and the change from D3 symmetry in the ground state to C2 symmetry in the excited state, [Ru(bpy)3]2+⎯⎯hν→[Ru(bpy•–)(bpy)2]2+*, creates an excited-state dipole with a significant change in charge distribution in the local environment. The solvent responds through a combination of rotations Fig. 10TRIR difference spectrum, [ReII(bpy•–)(CO)3(4-Etpy)]+* – [ReI(bpy)(CO)3(4-Etpy)]+, in CD3CN at room temperature, also illustrating the normal mode compositions of the CO stretching modes. Spectrum adapted from ref. [116].
of individual solvent molecules (inertial polarization) and collective solvent reorientations (longitudinal polarization).
The quantum spacings for the solvent modes are small for common organic solvents (<50 cm–1), and the solvent contribution can be treated classically at or near room temperature [123,124].
Theoretical treatments of the solvent typically treat the medium as a dielectric continuum characterized by static, Ds, and optical dielectric constants, Dop. Dsis measured from the change in capacitance in the presence and absence of the dielectric, and Dopis the square of the refractive index, Dop= n2.
Absorption
The influence of solvent on MLCT absorption was discussed in the “Localized or delocalized?” section in the context of “localization or delocalization” in [Ru(bpy)3]2+*. From dielectric continuum theory, with application of the dipole-in-a-sphere model in Fig. 6, the difference in absorption energy between solvents, ΔEabs, is given by eq. 6. In this equation,μ
gandμ
eare the point dipole vectors of the ground and excited states, a, is the radius of a spherical cavity enclosing the complex, λois the solvent reor- ganization energy difference between excited and ground states, and Δw(Ds) is the difference in solva- tion energies. As noted in the “Localized or delocalized?” section, the [Ru(bpy)3]2+ground state has D3 symmetry with μ
g= 0, and eq. 6 simplifies to eq. 1.
(6) Application of dielectric continuum theory breaks down in the presence of specific solvent effects. They can arise, for example, from H-bonding between ammine ligands and the solvent in com- plexes such as [Ru(NH3)5(py)]2+[125] and [Ru(bpy)2(NH3)2]2+[126], and by electron pair donation from the cyano ligands in complexes such as [Ru(bpy)2(CN)2] to the solvent [122,127]. Specific effects have been included through explicit first-shell solvent interactions with the ligands and a continuum treatment for the remainder of the solvent [125,128–134].
Emission
For the thermally equilibrated excited state in Fig. 6, emission is the inverse of absorption returning the complex to the D3electronic symmetry of the ground state but with the solvent instantaneously in the C2symmetry of the excited state. Application of the dipole-in-a-sphere model to changes in emission energy with solvent, ΔEem, gives eq. 7b. Experimentally, emission from [Ru(bpy)3]2+* is less solvent- dependent than Eabs. In a study of 12 solvents, application of eq. 7b gave a marginal correlation with R2= 0.59 and slope 3340 (= μ
e2/a3) compared to R2= 0.75 for absorption. A better correlation was obtained by a combined fit to the dielectric function and donor number (DN) defined by Guttman. The DN includes electron pair interactions [135].
Eem= ΔG0(vac) – λi– λo+ Δw(Ds) (7a)
(7b) It has been suggested that specific solvent effects arise for emission from [Ru(bpy)3]2+* due to specific solvent interactions with the partly formed radical anion in the equilibrated excited state, [Ru(bpy•–)(bpy)2]2+* [122]. Dielectric continuum theory works well for absorption in [Ru(bpy)3]2+
because there is no particular orbital basis for specific interactions in the D3ground state and the excited state is formed instantaneously in the solvent environment of the ground state.
MLCT EXCITED STATES: REDOX POTENTIALS
Excitation of [Ru(bpy)3]2+gives (dπ5π*1) [Ru(bpy)3]2+* with both oxidizing (dπRu5) and reducing, (π*bpy1), sites in the same molecule. Compared to its ground state, every excited state has enhanced abilities as an oxidant and reductant. A thermodynamic cycle for calculating the reduction potential for [Ru(bpy)3]2+* is shown in Scheme 3.
In redox potential calculations the free energy content of the excited state above the ground state, ΔGES, is available by analysis of emission spectral profiles as described in the “Emission spectral fit- ting” section, by using eq. 8. In eq. 8, E0is the v= 0 →v* = 0 energy gap, Δν∼0,1/2is the vibronic band width at half-height, and λo,Lis given by eq. 9. Application of emission spectral fitting to [Ru(bpy)3]2+* gives ΔGES= 2.19 eV in CH3CN and 2.19 eV in water, both at room temperature [58].
(8)
λo,L= λo+ λi,L (9)
E°' values for [Ru(bpy)3]2+* in both CH3CN vs. SCE and water vs. NHE (I= 0.1) are summa- rized in the redox potential diagrams in Scheme 4. They are written as reduction potentials and were calculated by using eqs. 10 and 11. Signs are reversed for the half-reactions written as oxidation poten- tials, e.g., for [Ru(bpy)3]2+* →[Ru(bpy)3]3++ e–, E°' = +0.85 V. The potentials in Scheme 4 and eqs.
10, 11 are “formal” potentials, the potential of the half-reaction with the oxidized and reduced forms at equal concentrations in the prevailing medium [136].
E°'([Ru(bpy)3]2+*/+) = E°'([Ru(bpy)3]2+/+) + ΔGES/nF= +0.85 V (10) E°'([Ru(bpy)3]3+/2+*) = E°'([Ru(bpy)3]3+/2+) – ΔGES/nF= –0.92 V (11) Scheme 3Themodynamic cycle for calculating E°' for the [Ru(bpy)3]3+/[Ru(bpy)3]2+* couple.
ELECTRONIC STRUCTURE: OTHER LOW-LYING EXCITED STATES
MLCT bands dominate the visible spectrum of [Ru(bpy)3]2+and related polypyridyl complexes but, depending on ligand composition, metal, and molecular structure, a variety of excited states having dif- ferent electronic origins can appear and play a role.
Upper MLCT excited states
As noted above, light absorption by [Ru(bpy)3]2+ in the UV is dominated by ligand-based π → π* absorptions. Wavelength-dependent quantum yield measurements show that these states undergo rapid interconversion to the lowest-lying MLCT state(s) but, for [Ru(bpy)3]2+*, with less than unit efficiency [137]. In the visible, absorptivity is dominated by MLCT transitions to π*1,bpy(MLCT(1,1',1")) and π*2,bpy (MLCT(2)), “Electronic Structure” section. 3MLCT(1') and 3MLCT(1") are also thermally accessible at room temperature and contribute to excited-state decay, “Excited-State Dynamics” section [138]. Emission at E0= 17 230 cm–1from 3MLCT(2) has been reported in KBr disks [139].
In [Ru(bpy)2(dppz)]2+*, competing π* levels exist in the same dppz acceptor ligand, localized either on the bpy or phenazine fragments (Fig. 11). The bpy-based MLCT state emits while the phenazine-based state is dark. The latter is favored in hydroxylic environments and disfavored in hydrophobic environments, which was exploited by Barton and co-workers in their studies on DNA intercalation [140–143]. The states undergo rapid, <1 ns, interconversion and are at equilibrium on the timescale for ES decay [144,145].
Scheme 4Redox potential diagrams and formal potentials, E°', for [Ru(bpy)3]2+* in CH3CN at I= 0.1 vs. SCE and in water at 0.1 M KNO3vs. NHE at room temperature.
 2 in CH 3 CN at room temperature (a) and enlargement for its MLCT absorption band (black in (b))](https://thumb-eu.123doks.com/thumbv2/1library_info/5129573.1658824/5.810.103.712.126.351/fig-absorption-spectrum-temperature-enlargement-mlct-absorption-black.webp)
![Fig. 4 Transient near-IR spectrum of [Os(phen) 3 ] 2+ in CD 3 CN at 298 K (obtained 20–40 ns after 450-nm laser flash excitation) and energy diagram illustrating the orbital basis for the low-energy 3 MLCT(1) → 3 MLCT(1) absorption at 5460 cm –1](https://thumb-eu.123doks.com/thumbv2/1library_info/5129573.1658824/6.810.101.713.649.835/transient-spectrum-obtained-excitation-diagram-illustrating-orbital-absorption.webp)
![Fig. 5 Polarized absorption spectra for [Ru(bpy) 3 ] 2+ in a single crystal at 8 K and the energy level scheme used to assign the spectra, adapted from ref](https://thumb-eu.123doks.com/thumbv2/1library_info/5129573.1658824/8.810.139.677.120.458/polarized-absorption-spectra-single-crystal-energy-spectra-adapted.webp)
![Table 1 Comparison of single mode emission spectral fitting parameters in water at 23 °C obtained by emission spectral fitting and by a mode-by-mode analysis with averaging, see text [112].](https://thumb-eu.123doks.com/thumbv2/1library_info/5129573.1658824/15.810.195.619.561.852/comparison-emission-spectral-parameters-obtained-emission-spectral-averaging.webp)
![Fig. 13 Light absorption and equilibration following MLCT excitation of [Ru(bpy) 3 ] 2+ in H 2 O at 400 nm.](https://thumb-eu.123doks.com/thumbv2/1library_info/5129573.1658824/22.810.169.647.660.989/fig-light-absorption-equilibration-following-mlct-excitation-ru.webp)
![Figure 15 shows a plot of lnk nr vs. ln[FC(calc)] according to eq. 23. Although there is scatter in the data, the predicted linear relationship between lnk nr and ln[FC(calc)] is observed over the extended range of energy gaps from 13 100 to 19 800 cm –1](https://thumb-eu.123doks.com/thumbv2/1library_info/5129573.1658824/27.810.259.552.616.840/figure-according-scatter-predicted-linear-relationship-observed-extended.webp)
![Fig. 16 Energy-coordinate curves illustrating thermal activation and decay from low-lying MLCT and dd states in [Ru(bpy) 3 ] 2+ * (a) and photochemical ligand loss by MLCT → dd barrier crossing and metal–ligand bond breaking (b).](https://thumb-eu.123doks.com/thumbv2/1library_info/5129573.1658824/29.810.138.683.428.772/energy-coordinate-illustrating-thermal-activation-photochemical-crossing-breaking.webp)
![Fig. 20 Structures of the atactic, derivatized polymers [co-m,p-PS-CH 2 -R] (–R = [Ru(4-Me-4'-(–OCH 2 )- )-bpy)(bpy) 2 ] 2+ (–OCH 2 -Ru II ), –MQ 2+ , and –PTZ.](https://thumb-eu.123doks.com/thumbv2/1library_info/5129573.1658824/36.810.215.603.120.381/fig-structures-atactic-derivatized-polymers-och-och-ptz.webp)
