University of Plymouth
PEARL https://pearl.plymouth.ac.uk
Faculty of Science and Engineering School of Geography, Earth and Environmental Sciences
2019-04-04
In-situ trace metal (Cd, Pb, Cu)
speciation along the Po River plume (Northern Adriatic Sea) using
submersible systems
Illuminati, S
http://hdl.handle.net/10026.1/13708
10.1016/j.marchem.2019.04.001 Marine Chemistry
Elsevier
All content in PEARL is protected by copyright law. Author manuscripts are made available in accordance with publisher policies. Please cite only the published version using the details provided on the item record or
document. In the absence of an open licence (e.g. Creative Commons), permissions for further reuse of content should be sought from the publisher or author.
Manuscript Details
Manuscript number MARCHE_2018_153
Title In-situ trace metal (Cd, Pb, Cu) speciation along the Po River plume (Northern Adriatic Sea) using submersible systems.
Article type Research Paper
Abstract
Information on the distribution and speciation of trace metals is of critical importance for our ability to interpret the links between the bioavailability and uptake of an element, and its biogeochemical cycle in coastal environments. Within the framework of the European Project “In-situ automated Monitoring of Trace metal speciation in Estuaries and Coastal zones in relation with the biogeochemical processes (IMTEC)”, the chemical speciation of Cd, Pb and Cu was carried out along the Po River plume in the period 27 October – 2 November 2002. During the cruise five Voltammetric In-situ Profiling systems and one Multi Physical Chemical Profiler, as well as conventional voltammetric instruments, were successfully applied in order to evaluate the distribution of Cd, Pb and Cu between different fraction (free ion, dynamic, colloidal, dissolved and particulate fractions) and to assess the evolution of these fractions during the estuarine mixing and in the water column. Dynamic concentrations were 0.05-0.2 nmol L-1 Cd, 0.02-0.2 nmol L-1 Pb, and 0.15- 4.0 nmol L-1Cu. Cd was mainly present as dynamic fraction (40-100% of the dissolved Cd). High proportions of Pb (~70%) and Cu (~80%) were presents as colloids of probably biogenic origin. Principal components analysis reveals a strong influence of the Po River discharge on the spatial and vertical distributions of metal species. Almost all the metal fractions globally decreased following the salinity gradient. Metal concentrations are far below (at least one order of magnitude lower) the Environmental Quality Standard established by the Italian law. However, the Cu dynamic fraction showed concentrations likely to be toxic to sensitive phytoplankton community and to have negative effects on larva development of coastal macroinvertebrate species (toxicity data extracted from literature).
Keywords metals; speciation; estuary; voltammetry
Taxonomy Marine Pollution, Metal Biogeochemistry, Environmental Chemistry Substances, Marine Chemistry, Environmental Science
Corresponding Author Cristina Truzzi Corresponding Author's
Institution
Departement of Life and Environmental Sciences, Università Politecnica delle Marche
Order of Authors Silvia Illuminati, Anna Annibaldi, Cristina Truzzi, Marylou Tercier-Waeber, Charlotte Braungardt, Eric Achterberg, David Turner, mauro marini, Tiziana Romagnoli, Cecilia Maria Totti, Flavio Graziottin, Jacques Buffle, Giuseppe Scarponi
Suggested reviewers Roko Andricevic, Matthieu Waeles, Sabina Susmel, Clara Turetta, Ana-Marija Cindric
Submission Files Included in this PDF
File Name [File Type]
CoverLetter.docx [Cover Letter]
Highlights.docx [Highlights]
Illuminati_Me-Speci_AS.docx [Manuscript File]
Fig.1.docx [Figure]
Fig.2.docx [Figure]
Fig.3.docx [Figure]
Fig.4.docx [Figure]
Fig.5.docx [Figure]
Fig.6.docx [Figure]
Fig.7.docx [Figure]
Fig.8.docx [Figure]
Fig.9.docx [Figure]
SupportingInformation.docx [Figure]
Fig.S1.docx [Figure]
To view all the submission files, including those not included in the PDF, click on the manuscript title on your EVISE Homepage, then click 'Download zip file'.
Dear Sirs,
I enclose a manuscript entitled
“In-situ trace metal (Cd, Pb, Cu) speciation along the Po River plume (Northern Adriatic Sea) using submersible systems”
by
Silvia Illuminati, Anna Annibaldi, Cristina Truzzi, Mary-Lou Tercier-Waeber, Stéphane Nöel, Charlotte B. Braungardt, Eric P. Achterberg, Kate A. Howell, David Turner, Mauro Marini, Tiziana Romagnoli, Cecilia Totti, Fabio Confalonieri, Flavio Graziottin, Jacques Buffle, Giuseppe Scarponi to be considered for publication as Research Paper in “Marine Chemistry”.
The manuscript describes and discusses the results on the chemical speciation of Cd, Pb and Cu carried out along the Po River plume, Adriatic Sea
It presents some interesting news: (1) the application of voltammetric sensors (Voltammetric In-situ Profiler and Multi Physico-Chemical Profiler) allowing the evaluation in-situ of Cd, Pb and Cu specie distribution; (2) the assessment of the evolution of metal fractions during the estuarine mixing and in the water column; (3) the multivariate statistical analysis applied to the overall dataset revealed a strong influence of the Po River discharge on the spatial and vertical distributions of metal species;
(4) the metal concentrations are one order of magnitude lower than the Environmental Quality Standard established by the Italian law; (5) the Cu dynamic fraction showed concentrations likely to be toxic to sensitive phytoplankton community and to have negative effects on larva development of coastal macroinvertebrate species.
Please, note that two authors (Fabio Confalonieri and Flavio Graziottin) have the same e-mail addresses, the only available. One of the authors, Kate A. Howell, is dead. Anyway, we would like to include her name in the author’s list, in memory of her strong contribution to the project and…of her smile.
Thanking you in advance for your attention, Yours sincerely,
Dr. Silvia Illuminati
Polytechnic University of Marche – Ancona,
Department of Life and Environmental Sciences,
Via Brecce Bianche, 60131, Ancona, Italy
E-mail: s.illuminati@univpm.it
Research Highlights
- First speciation study on trace metals in the Adriatic Sea
- In-situ speciation by submersible, reliable voltammetric sensors - Metal species distribution mainly affected by Po River outflow - Metal dynamic concentrations below legal limits
- Cu dynamic concentrations toxic to sensitive phytoplankton
1
In-situ trace metal (Cd, Pb, Cu) speciation along the Po River plume (Northern Adriatic Sea)
2
using submersible systems.
3
4 Silvia Illuminatia1, Anna Annibaldia1, Cristina Truzzi*a, Mary-Lou Tercier-Waeberb, Stéphane Nöelb, Charlotte B.
5 Braungardtc, Eric P. Achterbergd, Kate A. Howellc,e, David Turnerf, Mauro Marinig, Tiziana Romagnolia, Cecilia Tottia, 6 Fabio Confalonierih, Flavio Graziottinh, Jacques Buffleb, Giuseppe Scarponia
78 aDepartment of Life and Environmental Sciences, Università Politecnica delle Marche, Italy 9 bCABE, Department of Inorganic and Analytical Chemistry, University of Geneva, Switzerland 10 cSchool of Earth, Ocean and Environmental, University of Plymouth, UK
11 dGEOMAR, Helmholtz Centre for Ocean Research Kiel, Germany 12 eNanotecture Ltd. Epsilon House, Southampton Science Park, UK 13 fDepartment of Marine Sciences, University of Gothenburg, Sweden
14 gInstitute of Marine Science, National Research Council (CNR), Ancona, Italy 15 hIdronaut Srl, Brugherio (MI), Italy
16
17 1Both authors contributed equally to this manuscript 18 Contact information for Corresponding Author
19 *Cristina Truzzi, Department of Life and Environment Sciences, Università Politecnica delle Marche, Via Brecce 20 Bianche, 60131 Ancona, Italy. Phone: +390712204981 Fax: +390712204650. E-mail: c.truzzi@univpm.it
21 22
23 Abstract
24 Information on the distribution and speciation of trace metals is of critical importance for our ability to interpret the links 25 between the bioavailability and uptake of an element, and its biogeochemical cycle in coastal environments. Within the 26 framework of the European Project “In-situ automated Monitoring of Trace metal speciation in Estuaries and Coastal 27 zones in relation with the biogeochemical processes (IMTEC)”, the chemical speciation of Cd, Pb and Cu was carried out 28 along the Po River plume in the period 27 October – 2 November 2002. During the cruise five Voltammetric In-situ 29 Profiling systems and one Multi Physical Chemical Profiler, as well as conventional voltammetric instruments, were 30 successfully applied in order to evaluate the distribution of Cd, Pb and Cu between different fraction (free ion, dynamic, 31 colloidal, dissolved and particulate fractions) and to assess the evolution of these fractions during the estuarine mixing 32 and in the water column. Dynamic concentrations were 0.05-0.2 nmol L-1 Cd, 0.02-0.2 nmol L-1 Pb, and 0.15- 4.0 nmol 33 L-1Cu. Cd was mainly present as dynamic fraction (40-100% of the dissolved Cd). High proportions of Pb (~70%) and 34 Cu (~80%) were presents as colloids of probably biogenic origin. Principal components analysis reveals a strong influence 35 of the Po River discharge on the spatial and vertical distributions of metal species. Almost all the metal fractions globally 36 decreased following the salinity gradient. Metal concentrations are far below (at least one order of magnitude lower) the 37 Environmental Quality Standard established by the Italian law. However, the Cu dynamic fraction showed concentrations
38 likely to be toxic to sensitive phytoplankton community and to have negative effects on larva development of coastal 39 macroinvertebrate species (toxicity data extracted from literature).
40 41
42 Keywords
43 Metals; Speciation; Estuary; Voltammetry 44
45 1. Introduction
46 The Adriatic Sea is a semi-enclosed shelf basin located in the northeast part of the Mediterranean Sea and it is strongly 47 influenced by several riverine inputs. In its northern sub-basin, the freshwater plume of the Po River plays a fundamental 48 role in driving the coastal dynamics and the physical and biogeochemical processes of the whole basin. Crossing the 49 entire northern part of the Italian country, which is one of the most industrialized areas in Europe, the Po river discharges 50 in the Adriatic Sea a remarkable load of pollutants, which in turns affect the Italian coasts even to approximately the city 51 of Ancona (following the prevailing southward marine currents).
52 The Northern Adriatic Sea has been intensely investigated, studying the physical structure of the water column, as 53 well as the circulation patterns (Russo and Artegiani, 1996; Falcieri et al., 2014), the plankton community (Totti et al., 54 2005; Cabrini et al., 2012; Godrijan et al., 2013), the nutrient (Boldrin et al., 2005; Grilli et al., 2013) and trace element 55 distribution in seawater (Annibaldi et al., 2009, 2011, 2015; Cindrić et al., 2015; Tankere and Statham, 1996; Zago et al., 56 2000, 2002).
57 Nowadays, following the enactment of specific EU Directives, there is a growing need to control the quality of coastal 58 waters, which are affected by several anthropogenic activities (building of infrastructure for human settlement, habitat 59 modification, tourism, transport by sea and disposal of industrial and domestic effluents). Combined efforts are requested 60 to develop monitoring and assessment programs in order to survey and guarantee a good chemical and ecological status 61 of the coastal ecosystems, including heavy metals. Heavy metals are ubiquitous in the environment and their 62 concentrations are increased with respect to natural pre-industrial values due to anthropogenic activities, which have 63 modified at the same time, metal biogeochemical cycles on a regional and global scale (Sadiq, 1992). It is well known 64 that the toxicity, bioavailability and mobility of trace metals in seawater depend on their speciation rather than on the only 65 total concentration (Allen and Hansen, 1996). Dissolved trace metals in seawater can exist in different chemical species 66 (forms), such as free hydrated ions, organic and inorganic complexes. The study of the metal species distribution in 67 seawater gives insights on their cycles, as each metal species is characterized by different reactivity and different 68 interactions with organisms. Free hydrated ions are the most reactive and highly bioavailable, but their reactivity, as well
69 as their toxicity can be greatly modified by the presence of organic and inorganic compounds. Thus, to better understand 70 the biogeochemical cycle of a trace metal and its overall mobility in the water column, it is essential to identify and 71 quantify the various species that make up its total concentration.
72 Across much of the world, regulatory limit values (e.g., Environmental Quality Standards in the EU, Water Quality 73 Criteria in the US, Australia, Canada, etc.) for metals in water bodies do not take metal speciation into account. They are 74 mainly based on dissolved metal, since this fraction more closely approximates the bioavailable fraction of the metal in 75 the water column. Recently, thanks to a major refinement in the scientific understanding of the behavior, fate and 76 toxicology of metals in the environment, and to a series of statutory and voluntary risk assessments performed under the 77 existing regulations on pollutant monitoring program, several public administrations started to implement the in-force 78 water quality assessments by introducing a speciation-based approach. The revised Priority Substances Daughter 79 Directive, 2013/39/EU (2013) includes now annual average Environmental Quality Standards (EQS) for nickel and lead 80 in the freshwater environment that refer to bioavailable concentrations. These bioavailable EQS are based on Biotic 81 Ligand Models (BLM), but, at the time of the development of the latest draft of the Water Framework Directive, there 82 was no validated and accepted BLM for some metals, therefore complimentary availability-based approaches were 83 adopted to define the EQS bioavailable. For example, the EQS for lead are based on the availability correction for the 84 dissolved organic carbon (SCHEER-EC, 2017).
85 Very few studies reported chemical speciation of trace metals in the Adriatic Sea, the most of them dealing with the 86 horizontal and vertical partitioning between dissolved and particulate phases (Tankere and Statham, 1996; Tankere et al., 87 2000; Zago et al., 2000, 2002; Annibaldi et al., 2011, 2015; Cindrić et al., 2015). Some authors (Scarponi et al., 1995, 88 1998), through voltammetric titration, studied the distribution of dissolved trace metals between the free fraction (mainly 89 ionic and inorganic complexed metal) and bound fraction (organically complexed metal), as well as the content of ligands 90 complexing metal and the related conditional stability constants.
91 Within the framework of the European Project “In-situ automated Monitoring of Trace metal speciation in Estuaries 92 and Coastal zones in relation with the biogeochemical processes (IMTEC)”, several studies on metal speciation were 93 carried out in different European coastal areas by the partners of the project (University of Geneva, University of 94 Göteborg, University of Plymouth, University of Ancona, University of Neuchatel).
95 This paper focuses on the chemical speciation of Cd, Pb and Cu along the Po River plume, which is particularly 96 significant for the study of physical, hydrological and biological processes that affect trace metal contents and 97 distributions during the estuarine mixing, and for the better understanding of the behaviour and fate of the different metal 98 species. The speciation studies were carried out by applying submersible voltammetric probes, that were developed and 99 tested within the IMTEC project for the trace element monitoring in natural environments.
100 The Voltammetric In-situ Profiling (VIP) probe is the first commercially available instrument (Idronaut, Italy) 101 developed by Tercier and co-workers (Tercier et al., 1998) that combines trace metal speciation analysis of high sensitivity 102 and resolution with automated in-situ operation and options for remote deployment. The VIP allows the long-term, real- 103 time and simultaneous determination of a fraction of the conventional total dissolved trace metal, the so-called “dynamic 104 fraction”, of several trace metals, directly in the water column, with no or minimum pretreatments. The dynamic fraction 105 is defined as the sum of the free metal ions and the sufficiently labile (high dissociation rate) and mobile (high diffusion 106 rate) inorganic and organic complexes of a few nanometers in size (Buffle and Tercier-Waeber, 2005). This metal fraction 107 is of great importance, as it represents the concentration of metals potentially bioavailable, i.e. the dynamic metal 108 complexes may dissociate within the time it takes to diffuse from the bulk medium to an organism’s cell surface receptor 109 site, and hence be readily available (Buffle and Tercier-Waeber, 2005). This is possible due to a specifically designed 110 gel-integrated microelectrode (GIME) that consists of an array of 100 interconnected Ir-based micro-disc electrodes, 111 coated with an antifouling gel membrane of 300 μm thickness (for more details see Belmont-Hebert et al., 1998). The 112 non-dynamic fraction, comprising metals associated with colloidal material cannot be determined by the VIP system 113 (Buffle and Tercier-Waeber, 2005; Braungardt et al., 2011). Generally, colloids are micro particles and macromolecules 114 in the size range of 1 nm to 1 µm with 1nm 1 kDa for globular macromolecules. They can have an inorganic (clays, 115 metal oxides, metal hydroxides, and metal carbonates) or organic (detrital matter, e.g. fulvic and humic acids, and living 116 organism, such as algae, bacteria, virus) nature. Because of their high capacity of adsorbing considerable amounts of trace 117 metals, due to a large specific area and, consequently, of a high number of active sites (Vignati and Dominik, 2003), 118 colloids play a critical role in controlling metal speciation and the cycling of many elements in natural waters. The 119 colloidal fraction of metals can be deduced from the difference between the total dissolved metal concentration and the 120 dynamic concentration, according to Braungardt et al., 2011. A more sophisticated system, called Multi Physical 121 Chemical Profiler (MPCP), has also been developed to extend the capability of the VIP to in situ monitoring of trace 122 metal speciation (Tercier-Waeber et al., 2005). The MPCP allows the simultaneous in situ, autonomous monitoring and 123 profiling (down to 150 m) of three major metal fractions: i) the free metal ion concentration, (i.e. the species related to 124 biological uptake) by means of a particular GIME sensor, the complexing gel integrated micro-electrode (CGIME), which 125 is covered by a thin 3.5 μm layer of a Microchelex chelating resin which in turns is covered by a thick 300 μm antifouling 126 agarose gel (details of CGIME measurement principles and preparation in Noel et al., 2006); ii) the dynamic metal species 127 by a GIME sensor; and iii) the total acid-extractable metal concentration by means of a GIME sensor coupled to a 128 submersible flow-injection analysis (FIA) system (Tercier-Waeber et al., 2005, 2008). The MPCP is coupled with a CTD 129 probe for the measurement of the master variables (pressure, temperature, pH, oxygen, conductivity, salinity, redox 130 potential, turbidity and chlorophyll-a). Both the VIP and the MPCP have been successfully applied in several
131 environments, i.e. freshwater (Tercier-Waeber et al., 1998, 2002; Tercier-Waeber and Buffle, 2000), groundwater, fjord 132 water (Tercier-Waeber et al., 1999), macro-tidal estuaries (Tercier-Waeber et al., 2005; Braungardt et al., 2009) and 133 coastal marine waters (Tercier-Waeber et al., 1999, 2005; Howell et al., 2003; Braungardt et al., 2009).
134 In the autumn 2002 a joint oceanographic cruise was carried out along the Po river plume in order i) to evaluate the 135 metal distribution between different fractions (free ion, dynamic, colloidal, dissolved and particulate fractions) and their 136 relationship with the total content; ii) to assess the evolution of the different metal fractions during the estuarine mixing 137 and in the water column; and iii) to evaluate the effect of the hydrological characteristics of the water column, as well as 138 of phytoplankton, on metal speciation. Moreover, preliminary tests of the CGIME sensor on discrete samples were also 139 carried out. As the validation of new technique measurements in complex media is not straightforward, hollow fiber 140 permeation liquid membrane (HF-PLM) coupled to an inductively coupled plasma mass spectrometer (ICP-MS) were 141 used in parallel to CGIME measurements for comparison purposes. This technique allows the measurements of free metal 142 ions and some lipophilic contribution (Parthasarathy et al., 1997).
143 144
145 2. Materials and Methods 146
147 2.1. Laboratory, apparatus and reagents
148 A clean room laboratory ISO 14644-1 Class 6 (or US Fed. Std. 209e Class 1000), with areas at ISO Class 5 (or US F.
149 S. 209e Class 100) under laminar flow cabinets, was available for trace metal clean working conditions. A portable 150 laminar flow hood was available on board for sample treatments and analyses carried out on-site. Clean room garments, 151 masks and gloves were worn by the personnel, who strictly followed clean room procedures during the most critical 152 analytical steps.
153 Seawater sampling bottles were 8-L and 10-L GO-FLO from General Oceanics (Florida, USA). CTD probes, mod.
154 Ocean Seven 316 CTD and Ocean Seven 301 were from Idronaut (Milan, Italy). The Handheld Salinity, Conductivity 155 and Temperature System, Mod. 30, was from YSI (Yellow Springs, OH, USA). The Portable Turbidimeter Model 966 156 was from Orbeco-Hellige (New York, USA).
157 Filtration systems were the Sulfoflo from Nalgene (Rochester, New York) equipped with 0.45 µm pore size membrane 158 filters (cellulose mixed esters 47 mm, Schleicher & Schuell, Dassel, Germany) and the glassware apparatus with pre- 159 weighted filter membranes. The UV digestion apparatus was the Mod. 705 UV-digester from Metrohm, (Herisau, 160 Switzerland), equipped with twelve 12-mL quartz vessels and a 500 W mercury lamp. The Mod. 290A pH-meter, 161 equipped with an Orion epoxy pH electrode Sure-Flow (Mod. 9165BN) was from Orion (Beverly, MA, USA). For
162 phytoplankton analyses, the inverted microscope, Mod. Axiovert 135, and the epifluorescence microscope Mod. Axioplan 163 were from Zeiss (Milan, Italy). For nutrients, the Technicon Autoanalyzer Traacs 800 system was from Seal Analytical 164 (Norderstedt, Germany). Plastic containers were of low-density polyethylene material (Kartell, Italy). The polyethylene 165 bottles, the quartz vessels, the sampling equipment, the filtration apparatus and all other plastic containers were 166 decontaminated following the procedure reported elsewhere (Illuminati et al., 2015). Details of the decontamination 167 procedure are briefly described in Supporting Information, text S1.
168 The instrumentation for metal speciation consisted of (i) two Metrohm (Herisau, Switzerland) 746 VA Trace Analyser 169 and two 747 VA Stand, each one equipped with a Teflon PFA (perfluoroalkoxy copolymer) cell and a three-electrode 170 system, which includes an epoxy-impregnated graphite rotating disk working electrode (as a support for the thin mercury 171 film electrode, TMFE), an Ag/AgCl, KCl 3 mol L–1 reference electrode (to which all potentials are referred throughout) 172 and a glassy carbon rod counter electrode; (ii) five Voltammetric In-situ Profiling (VIP) systems (Idronaut, Italy), 173 equipped each one with a pressure compensated mini flow-through Plexiglas voltammetric cell comprising a Gel 174 Integrated Mercury-plated Microelectrode (GIME sensor), an Ag/AgCl, KCl saturated gel reference electrode and a built- 175 in platinum ring auxiliary electrode; (iii) one Multi Physical-Chemical Profiler (MPCP) equipped with two VIP systems 176 and one submersible Flow-Injection Analysis (FIA) system; (iv) one Amel potentiostat equipped with a Metrohm cell 177 based on a three-electrode configuration which includes a CGIME sensor, an Ag/AgCl/KCl(satured) reference electrode and 178 a platinum rod counter electrode; and (v) one Hollow Fiber Permeation Liquid Membrane (HF-PLM) device coupled to 179 an ICP-MS. Transferpette variable volume micropipettes from Brand (Wertheim, Germany) and neutral tips were used.
180 Ultrapure water was Milli-Q from Millipore (Bedford, MA, USA). Ultrapure HCl (34.5%), HNO3 (70%), H2O2 (ca.
181 30%), and superpure HClO4 (65%) were from Romil (Cambridge, England; UpA grade). Superpure KCl, Hg(CH3COO)2, 182 hexadistilled mercury, KSCN and NaNO3 were from Merck (Darmstadt, Germany). 1.5% LGL agarose gel was from 183 Biofinex (Neuchâtel, Switzerland). Atomic absorption standards of Cd (II), Pb (II) and Cu (II) were from Carlo Erba 184 (Milan, Italy). Research-grade nitrogen, purity ≥ 99.999%, was from Sol (Monza, Italy). The estuarine water reference 185 material SLEW-3, the nearshore-seawater reference material CASS-4, the seawater reference material NASS-5 for trace 186 metals were from the National Research Council of Canada.
187 188
189 2.2. Study area
190 The Adriatic Sea can be divided in three regional basins (North, Central and South), differing in bathymetry, 191 hydrology, morphology and biogeochemical features (Russo and Artegiani, 1996). The northern basin, with a width of 192 about 75 nautical miles and a mean depth of 30 m (maximum depth about 70 m), is the shallower part of the Adriatic
193 epicontinental shelf. It is characterized by large inputs of freshwaters from several rivers mainly concentrated along the 194 northern and the north-western coast of Italy. The Po River is the Italy’s largest river (with a length of 673 km and drainage 195 basin of 71,000 km2) and it flows through one of the most industrialized regions of the country. It has an annual outflow 196 rate of 1500 – 1700 m3 s-1, accounting for about one third of the total riverine freshwater input into the Adriatic Sea 197 (Marini et al., 2010). Discharge peaks of about 2000 m3 s-1 are generally observed in spring (May-June) following the 198 snow melting, and in autumn (October-November) when intense rainfall contributes to Po river discharge (Boldrin et al., 199 2005; Marini et al., 2008).
200 The oceanographic cruise in the Northern Adriatic Sea was carried out on board of G. Dallaporta vessel (CNR, 201 Ancona, Italy) from October 27th to November 4th 2002, along a transect of six stations from the Po mouth toward the 202 open sea, in direction East – South East (Fig. 1). About five stations were located in the plume while the remaining one 203 was outside. For a better representation of data, the study area was divided into three different zones. According to Falcieri 204 et al., 2014 (who carried out a 8-year simulation of the Po plume mean spatial variability based on data of temperature, 205 salinity and currents collected during September 2002 as initial conditions), we marked the limit for the front between the 206 plume and the sea water at the surface salinity of 36. Here, we called “pro-delta area” the first segment of the transect, 207 which was 10-km away from the Po mouth. This segment was characterized by high fluctuations of salinity (from ~18 to 208 ~29) and it included Stns. 1 and 2. The second segment, called “frontal area”, extended from 10 km to ~40 km from the 209 Po mouth. It was characterized by more stable salinity values (from ~33 to ~36) and it includes Stns. from 3 to 5. Finally, 210 the third segment was called “marine area”, which included the Stn. 6 and it was characterized by marine water masses 211 not influenced by the Po River (Fig. 1). To be noted that Stn. 5 had surface salinity around 36 and it should be part of the 212 marine area, nevertheless, it was included in the second segment of the transect, because at this station most of all the 213 variables studied had a behaviour comparable to the frontal area instead of the marine one.
214
215 2.3. Sample collection and treatments
216 During the oceanographic cruise, two kinds of speciation were carried out. The first type dealt with the in situ-based 217 speciation using several VIPs and one MPCP (equipped with two VIPs and one GIME-FIA system) for the determination 218 of the dynamic (Medyn) and the total acid-extractable (Meac.extr) fractions of Cd, Pb and Cu in the water column. The 219 second type regarded the on board/laboratory-based speciation carried out on discrete samples collected at the same depths 220 of the VIP and MPCP deployment, by means of the conventional Metrohm instrumentations for the total and dissolved 221 metal concentration measurements. Discrete samples were also collected for immediate on-board analysis of both 222 dynamic and total extractable fractions on surface samples, since the VIP and MPCP probes, due to their manufacture 223 characteristics, cannot be used in depths < 1 m (Tercier et al., 1998; Tercier-Waeber et al., 2005).
224 Surface samples were collected manually in polyethylene bottles by a rubber dinghy at 1 km from the oceanographic 225 vessel. Immediately after collection, the samples were divided in various aliquots that were subjected to different 226 treatments in order to obtain the different metal fractions. The first was acidified (raw sample) with ultrapure HCl (2:1000, 227 pH 2) for the determination of the total metal concentration (Metot). An aliquot was filtrated through 0.45-µm pore-size 228 membrane filter and then acidified with ultrapure HCl (2:1000, pH 2) for the determination of the dissolved metal 229 contents (Mediss). Before analysis, all the acidified samples (both raw and filtered) were subjected to photo-oxidative 230 digestion, by UV irradiation for 12 h after the addition of 1:1000 ultrapure H2O2, in order to destroy organic matter, to 231 leach bound metals, and to avoid possible adverse effect on the voltammetric determination (Kolb et al., 1992). Total 232 particulate metal concentration (Mepart) was obtained by difference between the total and the dissolved concentrations, 233 while the metal concentration in the colloidal fraction (Mecoll) was computed as difference between the dynamic and the 234 total dissolved concentration.
235 Aliquots of seawater samples were acidified with ultrapure HCl (2:1000, pH 2) and then analysed on board without 236 UV digestion for the determination of the total HCl-extractable metal fraction to compare it with that measured by the 237 GIME-FIA system. Other seawater aliquots were used, without any treatments, for the determination on board of the free 238 metal ion concentration (Mefree) using both CGIME sensor and the PLM technique. Finally, other seawater aliquots were 239 used to measure turbidity, DOC and nutrients.
240
241 2.4. Metal speciation methodology
242 Cd, Pb and Cu were determined simultaneously using the square-wave anodic stripping voltammetry (SWASV) that 243 was implemented both on conventional laboratory instrumentation and on voltammetric probes for the in-situ 244 measurements.
245
246 2.4.1. In situ-based speciation
247 The dynamic fraction and the in-situ total acid extractable concentration of Cd, Pb and Cu were determined by using 248 the VIP and the MPCP systems.
249
250 VIP system. The voltammetric determination of the metal dynamic fractions required the initial Hg deposition on the Ir 251 substrates of the GIME sensors, by applying a constant potential of −400 mV for 6 min in a N2 de-oxygenated solution 252 of Hg(CH3COO)2 (5 mmol L-1) and HClO4 (10-2 mol L-1) (Belmont-Hebert et al., 1998). The Hg film remained in place 253 for the entire period of the oceanographic cruise. The Hg film was removed by scanning the potential from −300 mV to 254 +300 mV at 5 mV s-1 in a N2 de-oxygenated solution of KSCN (1 mol L-1). The voltammetric analyses were performed
255 in successive steps: (i) sample pumping through the cell for 3 min at 7 mL min-1; (ii) equilibration of the agarose gel with 256 the sample for 5-6 min; (iii) SWASV measurements inside the gel, using the background subtraction technique (Belmont- 257 Hebert et al., 1998), and the following instrumental parameters: deposition potential, Edep = −1100 mV; deposition time, 258 tdep = 10 to 45 min (as a function of the metal concentrations); final potential, Efin = −50 mV in sea water, +120 mV in de- 259 oxygenated NaNO3 (0.1 mol L-1) electrolyte during laboratory calibration; equilibration potential, Eequil = −1100 mV;
260 equilibration time, tequil = 20 s; pre-cleaning potential, Eprecl = −50 mV (in sea water), +120 mV (in NaNO3); pre-cleaning 261 time, tprecl = 20 s; pulse amplitude, ESW = 25 mV; step amplitude, ΔEstep = 8 mV; frequency, f = 200 Hz.
262 MPCP system. The three-channel system of the MPCP constituted of two GIME sensors for the determination of the 263 dynamic fractions (instrumental parameters as for other VIP probes), and a GIME-FIA system for the determination of 264 the in-situ total extractable metal concentrations. The latter were measured in three steps: (1) on-line pre-treatments based 265 on ligand exchanges followed by acidification and heating of the sample to release trace metals complexed and/or 266 adsorbed; (2) equilibration of the sensor agarose gel with the pre-treated sample; (3) SWASV measurements of total 267 extractable metal concentration (Tercier-Waeber et al., 2005). The conditions used for the sample pre-treatment were as 268 follows: ligand stock solution = 150 μmol L-1 of triethylenetetramine (TRIEN); acid stock solution = 3.3 10-2 mol L-1 269 superpure NaNO3; sample, ligand and acid flow-rates = 4.2 mL min-1, 2.4 mL min-1 and 3.2 mL min-1 corresponding to 270 dilution factors of 2.3, 4.1, and 3.1 for the sample, ligand and acid, respectively (i.e. reagents concentration in the pre- 271 treated samples; 36.6 μmol L-1 TRIEN, 9.7 10-3 mol L-1 superpure NaNO3); equilibration time sample+ligand = 2 min;
272 equilibration time sample+ligand+acid at 50 °C = 2 min. The SWASV parameters used were as follows: equilibration 273 time of the agarose gel with the pre-treated sample = 6 min; Edep = −950 mV; tdep = 5 to 15 min (as a function of the metal 274 concentrations, during in situ deployments); Efin = −50 mV in sea water or +120 mV in laboratory calibration in superpure 275 NaNO3; Eequil = −1100 mV; tequil = 20 s; Eprecl = −50 mV to +120 mV; tprecl = 20 s; ESW = 25 mV; ΔEstep = 8 mV; f = 200 276 Hz.
277
278 The quantification of both the dynamic and the total extractable concentration was obtained using the calibration curve 279 method, in N2 degassed 0.1 mol L-1 NaNO3 standard solutions spiked with various concentrations of Cd, Pb and Cu. The 280 resulting slopes were normalized (Tercier-Waeber et al., 1999) after: (1) smoothing of the currents (using Golay-Savitzky 281 moving average); (2) subtraction of the background current from the current signal; (3) peak height quantification; and, 282 where necessary, (4) temperature effect correction on peak current measured in situ (Tercier-Waeber et al., 1998; Howell 283 et al., 2003). The calibration procedure was performed before and at end of the oceanographic campaign, while the validity 284 of slopes was tested during the cruise, on board, by analysing a N2-degassed standard solution previously used in the 285 calibration curve procedure.
286
287 2.4.2. On board/laboratory-based speciation
288 Metrohm system. Total and the dissolved metal fractions were determined in land-based laboratory (within 1-3 months 289 after the sample collection) by conventional Metrohm instrumentation. The procedure involved the pouring of a 10-mL 290 UV-digested sample aliquot into a pre-cleaned voltammetric cell, where the thin mercury film electrode (TMFE) was 291 already prepared and tested (Annibaldi et al., 2007; Illuminati et al., 2013, 2015). The Hg(NO3)2 solution (2.510-2 mol 292 L–1) for the TMFE was obtained by oxidation of hexadistilled mercury with ultrapure nitric acid. The voltammetric 293 analyses were carried out in the background subtraction technique, using the following instrumental parameters:
294 Edep = −975 mV; tdep = 3 to 10 min (as a function of the metal concentrations, during in situ deployments); Efin = 0 mV;
295 Eequil = −975 mV; tequil = 7.5s; Eprecl = −50 mV; tprecl = 5 min; ESW = 25 mV; f = 100 Hz; ΔEstep = 8 mV; tstep = 150 ms.
296 Two-three replicates were carried out with the sample in the cell, after which quantification was obtained using the 297 multiple standard addition method.
298 CGIME sensor. Preliminary tests for the determination of the free metal ion concentration with the complexing gel 299 integrated microelectrode (CGIME) were carried out on discrete samples on board, by using a standard Amel potentiostat 300 with a three-electrode Metrohm cell. First, mercury films were deposited on CGIME sensor, by applying a constant 301 potential of −400 mV for 8 min in a N2 de-oxygenated 5 mmol L-1 Hg(CH3COO)2 and 10-1 mol L-1 HClO4 solution 302 (Tercier et al., 1995). Removal of the mercury film was carried out with the same procedure used for GIME sensors (see 303 above). The measurement of free metal ion concentrations was performed in two steps: (1) equilibration of the sensor 304 with the sample to accumulate trace metals on the Microchelex resin in proportion to free metal ion concentrations in 305 seawater; (2) transfer of the CGIME sensor in a glass cell filled with an acid solution (0.1 mol L-1 NaNO3 + 0.1 mol L-1 306 superpure HNO3). Here, the accumulated metals were released by acid and then, immediately detected by SWASV using 307 the following instrumental parameters (Noel et al., 2006; Tercier-Waeber et al., 2005): accumulation time = 1 to 2 h, with 308 a renewal of the sample in the cell every 15 min; Edep = −900 mV; tdep = 10 to 30 min; Efin = +100 mV; ESW = 25 mV;
309 ΔEstep = 8 mV; f = 50 Hz.
310 HF-PLM technique. Hollow Fiber Permeation Liquid Membrane (HF-PLM) coupled to ICP-MS detection was used for 311 laboratory measurements performed in some discrete samples for comparison purposes with the CGIME measurements 312 of the free metal ion concentrations. The analytical procedure used for the HF-PLM preparation and measurements 313 included different steps (Parthasarathy et al., 1997, 2001): (1) preparation of the hollow fiber which was a loosely, coil, 314 single polypropylene hollow fiber with an inner diameter of 600 µm; (2) impregnating of hollow fiber with the organic 315 metal carrier (0.1 mol L-1 1,10-didecyl diaza 18-crown-6 and 0.1 mol L-1 lauric acid dissolved in a mixture of 316 phenylhexane and toluene); (3) metal separation and pre-concentration, in which the impregnated hollow fiber membrane
317 was immersed in the sample solution placed in a plastic beaker and held vertical by means of a clamp; (4) filling of the 318 lumen side of the hollow fiber with 510-4 mol L-1 CDTA (trans-cyclohexanediamine tetra-acetic acid) strip solution 319 adjusted to pH 6.4 with NaOH; (5) collection of the strip solution by pushing the solution by means of a peristaltic pump:
320 (6) laboratory metal determination by ICP-MS in both the sample and strip solutions.
321
322 2.5. Accuracy tests
323 To ascertain accuracy and to assure comparability of data produced during the cruise, analytical quality control of Cd, 324 Pb and Cu measurements were carried out by analysing several certified reference materials (the SLEW-3 for estuarine 325 water, the CASS-4 for nearshore seawater, and the NASS-5 for open seawater) with all the instrumentations available.
326 Certified reference materials were UV irradiated prior to analysis, as for the seawater samples collected.
327 The results of the systematic measurements carried out on reference materials during the entire period of work, using 328 all the instrumentations available on board and in laboratory, gave (n = 5-7) mean values (± SD) of SLEW-3, Cd 329 0.43 ± 0.01 nmol L-1; Pb 0.046 ± 0.010 nmol L-1; Cu 20 ± 2 nmol L-1; CASS-4, Cd 0.24 ± 0.02 nmol L-1; Pb 0.045 ± 0.008 330 nmol L-1; Cu 9.3 ± 0.8 nmol L-1; NASS-5 Cd, 0.21 ± 0.02 nmol L-1; Pb 0.038 ± 0.006 nmol L-1; Cu 4.6 ± 0.3 nmol L-1, 331 against certified mean values (± 95% confidence interval) of SLEW-3 Cd 0.43 ± 0.04 nmol L-1; Pb 0.043 ± 0.007 nmol 332 L-1; Cu 24 ± 2 nmol L-1; CASS-4 Cd 0.23 ± 0.03 nmol L-1; Pb 0.047 ± 0.017 nmol L-1; Cu 9.3 ± 0.9 nmol L-1; NASS-5 333 Cd 0.20 ± 0.03 nmol L-1; Pb 0.040 ± 0.003 nmol L-1; Cu 4.7 ± 0.7 nmol L-1. Results were in good agreement with certified 334 reference values within the experimental errors, showing a good accuracy of all the measurements.
335
336 2.6. Inter-comparison exercises
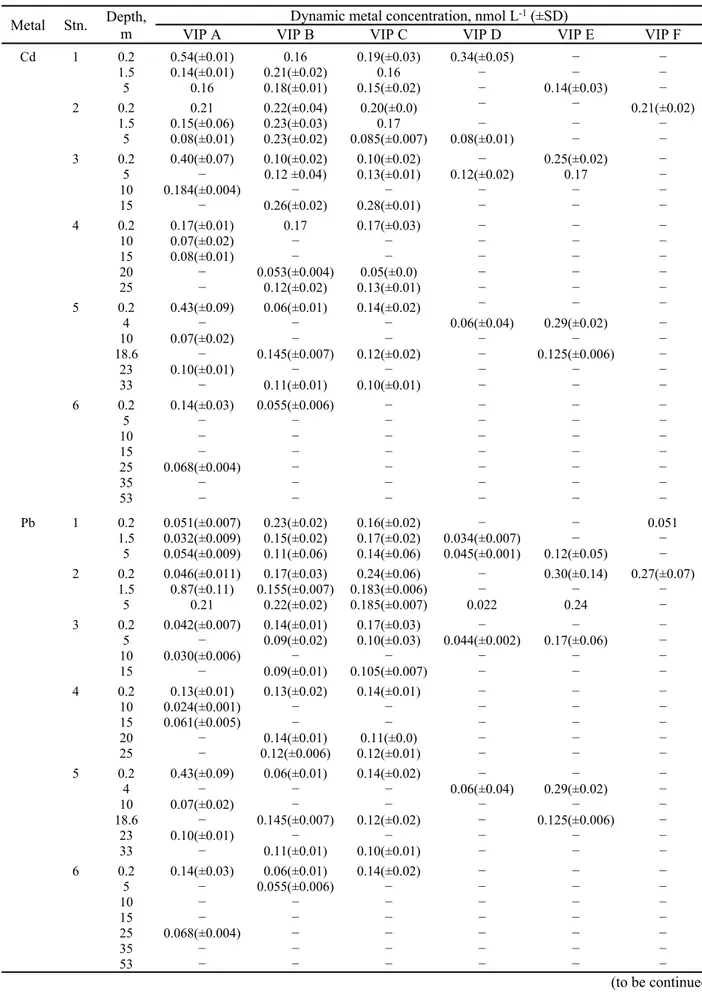
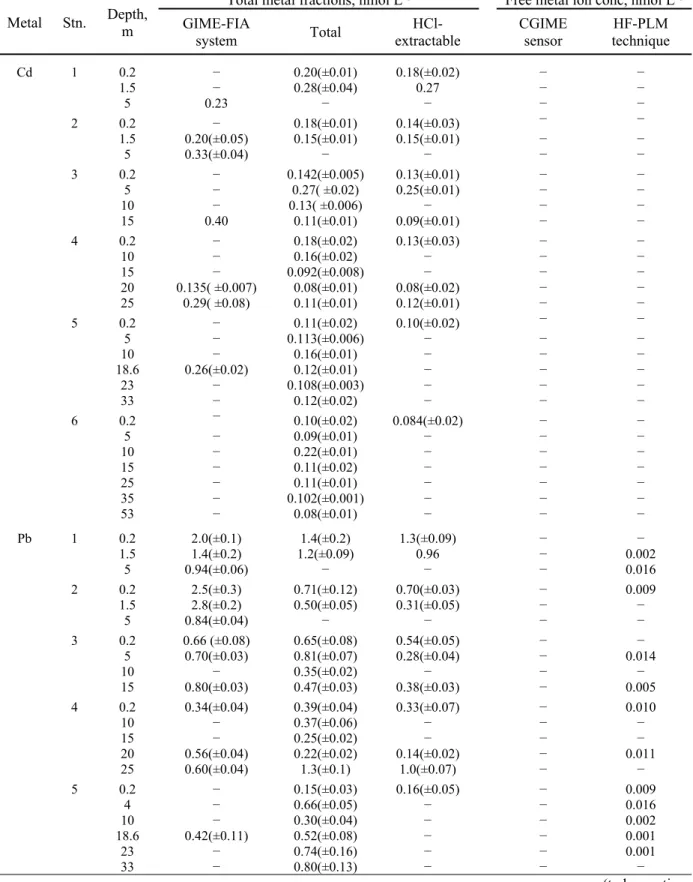
337 During the cruise, laboratory and field-based inter-comparison exercises of all the analytical techniques available were 338 carried out, in order to validate the developed analytical tools with common analytical procedures. Three principal types 339 of field-based inter-comparisons were carried out: (i) the comparison between the different dynamic fractions determined 340 by the GIME sensors available on board; (ii) the comparison between the total and the total HCl-extractable concentrations 341 measured by conventional instrumentations, on one side, and the in-situ total acid extractable concentration measured by 342 the GIME-FIA system, on the other; and (iii) the comparison between the free metal ion concentrations determined by 343 the CGIME sensor and the HF-PLM technique. Some results of the inter-comparison exercises were reported in 344 Braungardt et al. (2009) and Tercier-Waeber et al. (2005). Braungardt et al. (2009) compared the metal dynamic 345 concentrations measured at 5-m depth of the first two stations of the study transect. Tercier-Waeber et al. (2005) compared 346 the results obtained by the in-situ application of the GIME-FIA and the total content measured by the conventional 347 Metrohm instrumentation. Here we extended the comparison between the different voltammetric instrumentations to all
348 the samples collected during the cruise. Results are fully reported in the Supporting Information (Text S2; Tables S1 and 349 S2).
350 As shown in Table S1, a general good agreement was observed between the dynamic fraction data measured by 351 different VIPs available on board. Cd dynamic fraction determined by the VIP-A represented the only exception, showing 352 at the surface very high values, probably related to laboratory contamination. Concerning the total concentrations (see 353 Table S2 in the Supporting Information), although some high values due to possible contamination problems, the in-situ 354 total extractable fraction measured by the GIME-FIA procedure was often consistent with the total metal concentration 355 for Pb. On the contrary, the in-situ total extractable fraction of Cu was comparable to the total acid-extractable fraction 356 measured by conventional Metrohm instrumentation. The few data of GIME-FIA available for Cd were higher than the 357 total concentrations, probably due to contamination problems.
358 The very few data obtained for the free metal ion concentration by the CGIME sensor (values available only for Cu) 359 seemed to be in agreement with values measured by the HF-PLM technique.
360
361 2.7. Ancillary measurements
362 At each station of the 2002-Adriatic cruise transect, continuous water column profiles (vertical resolution of 0.5 m), 363 were sampled for the master hydrographic variables (i.e. temperature, salinity, dissolved oxygen, oxygen saturation, pH, 364 redox potential) using a CTD probe fitted with a fluorometer for the chlorophyll-a vertical profile.
365 Temperature and salinity data obtained from the CTD measurements were used to calculate the density (ρ), and the 366 water column stability. The latter is proportional to the Brunt-Värsälä buoyancy frequency N2(z), which represents the 367 strength of density stratification (Agusti and Duarte, 1999). The depth at which the Brunt-Värsälä buoyancy frequency 368 was estimated to be maximal, which also corresponds approximately to the middle of the pycnocline, represents the Upper 369 Mixed Layer (UML). The value of N2(z) was also taken as a stability index of the water column (i.e. what it is commonly 370 called pycnocline strength).
371 At each station, several discrete samples were also collected at different depths for the determination of turbidity, 372 dissolved organic carbon (DOC), dissolved inorganic nutrients (nitrate−NO‒3, nitrite−NO‒2, ammonium−NH+4, 373 orthophosphate−PO34‒ and orthosilicate−Si(OH)4), and phytoplankton abundance and composition. Nutrient 374 concentrations were measured following modified procedures developed by Strickland and Parsons (1972). Detailed 375 description of the nutrient analysis is reported elsewhere (Campanelli et al., 2012; Marini et al., 2008). Total dissolved 376 inorganic nitrogen (DIN) was calculated as the sum of the NO‒3, NO‒2 and NH+4 concentrations.
377 The analysis of phytoplankton was carried out following the Utermöhl method (Edler and Elbrachter, 2010).
378 Immediately after collection seawater samples were preserved in dark glass bottles by adding 0.8% formaldehyde
379 neutralized with hexamethylenetetramine and stored at 4 °C. In laboratory, 40-100 mL sub-samples were homogenized, 380 settled in a cylinder-chamber complex and then observed using the inverted microscope. During counting procedure, 30 381 random fields were examined at 400-x magnification. All phytoplankton cells larger than 2 µm were identified and 382 counted. Then the entire chamber was observed at 200-x to assess the larger and less frequent organisms. Bio-volume 383 was measured to evaluate the biomass (expressed in μg C L-1) following Menden-Deuer and Lessard (2000).
384
385 2.8. Statistical analysis
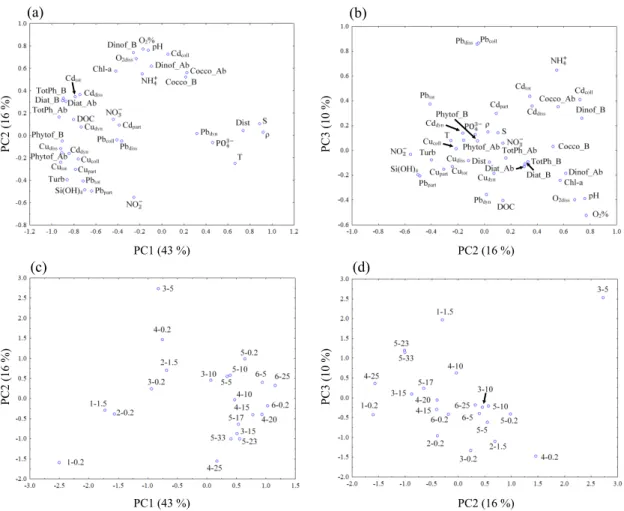
386 Countered sections are plotted using master variable and nutrient data that were gridded using the Data-interpolating 387 Variational Analysis (DiVA) coupled to the software Ocean Data View 4.7.10 (Schiltzer, 2017).
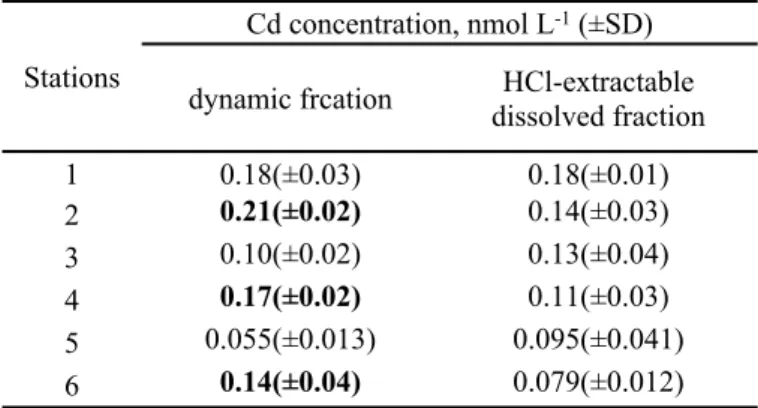
388 Experimental data were elaborated by principal component analysis (PCA), which was carried out on standardized 389 data; significant components were obtained through the Wold cross-validation procedure (Wold, 1978). The 5 m samples 390 of Stns. 1 and 2 were excluded from the dataset, because only the dynamic fractions were determined at this depth. Only 391 three depths of Stn. 6 (0.2 m, 5m and 25 m) were considered, since metal dynamic fractions were measured only at those 392 depth The high (contaminated) values of dynamic Cd were substituted by the HCl-extractable dissolved fraction (obtained 393 by filtering seawater samples on 0.45 µm pore membranes, acidifying with superpure HCl 2:1000 and analysing without 394 UV pre-treatment) which was very close to the Cd dynamic fraction (see data in Supplementary Information, Table S3), 395 and when this fraction was not available (we determined HCl-extractable dissolved fraction only in surface samples), the 396 dissolved Cd values (10- and 15-m depth values of Stn. 3) were used. The free metal ion concentrations were also 397 excluded, because of the very few and sporadic results obtained. The statistical analysis and the PCA were carried out 398 using Statistica package (StatSoft; vers. 8.0), and the differences were deemed statistically significant at p<0.05.
399 400 401
402 3. Results 403
404 3.1. Hydrography, dissolved nutrients and phytoplankton
405 Data on the master hydrographic variables, dissolved organic carbon (DOC), dissolved nutrients and phytoplankton 406 obtained during the cruise in the 2002-Adriatic Sea cruise are shown in Figures 2-4, S1 and Table S4.
407 Temperature and salinity varied from 16.28°C to 19.74°C and from 25.50 to 38.90, respectively (Fig. 2). Density 408 anomalies varied from 18.12 kg m-3 to 28.66 kg m-3 (Fig. S1). Temperature varied within a narrow range (up to 18%
409 variability), thus density variations were essentially due to salinity variations (also confirmed by the high positive
410 correlation coefficient, r = 0.9798, Tab. S4). Within the Po River plume, a stratification of the water column was observed 411 with a very shallow UML (up to 5-m depth) and with a sharp salinity gradient. At this depth, the pycnocline showed a 412 high strength (N2(z) = 557 10-4 s-2), which progressively decreased seawards. In the marine area (Stn. 6) water column 413 became quite homogeneous, the UML extended deeper (50 m), the halocline disappeared, while the thermocline still 414 persisted and was responsible of a very weak pycnocline (N2(z) = 15 10-4 s-2) (Fig. 2).
415 Dissolved oxygen showed concentrations in the range 3.5 – 11 mg L-1, slightly over saturation levels (100%) with 416 percentages ranging between 100 and 138% within the stratified layer (except for Stn.1, Fig. 2). Then, it gradually 417 decreased down to the bottom reaching saturation values of 60%. Values slightly lower than 50%, indicative of hypoxia, 418 were observed only at the Stn. 5 close to the bottom, while in the marine area, dissolved oxygen showed a homogenous 419 vertical distribution and well-oxygenated waters (100% of saturation). Along the longitudinal profile, dissolved oxygen 420 values (as well as saturation percentages) showed a surface maximum at Stn. 4, after which it decreased seawards to 421 values very close to those of the pro-delta stations.
422 pH ranged from 7.94 to 8.39 and showed a longitudinal profile similar to that observed for dissolved oxygen (Fig. 2).
423 In the pro-delta area, pH slightly decreased with depth, except in Stn.1 where it showed an opposite trend in the water 424 column. In the frontal and marine areas, pH remained almost constant within the mixed layer, and then it sharply decreased 425 with depth, even though at the Stn. 6 this decrease was less marked (Fig. S1).
426 Turbidity was high (16 NTU) near the Po mouth, but sharply decreased seawards reaching values close to the 427 detection limit of the instrument. In all the stations studied, turbidity showed a similar trend in the water column; it 428 decreased with depth, but proceedings seawards, higher values (sometimes 2-3 times higher than the surface) were 429 recorded, in the proximity of the bottom (Fig. S1).
430 Chlorophyll-a (Chl-a) concentration measured in situ by the CTD probe ranged between 0.3 and 13.3 mg L-1 and 431 sharply decreased seawards. A clearly defined deep chlorophyll maximum (DCM) of 10 mg m-3 was observed, closely 432 following the pycnocline. In the marine area, Chl-a vertical distribution was homogeneous with very low values, 0.3 mg 433 L-1 (Fig. 3).
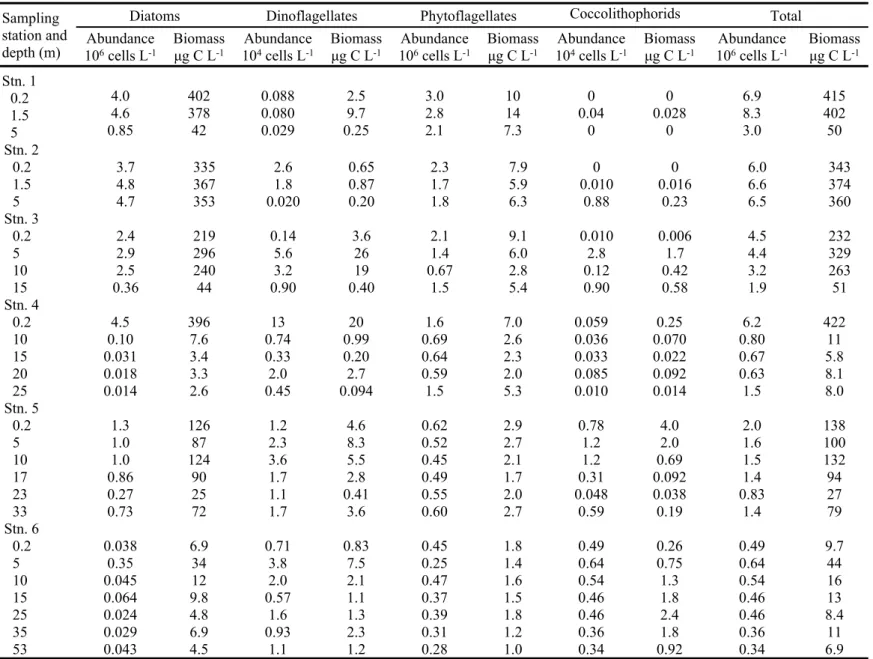
434 The total phytoplankton abundance ranged between 8.3 106 cell L-1 and 3.4 105 cell L-1 (Tab. S4). Spatial 435 distribution of micro-phytoplankton showed a general seaward-decreasing trend, even if a peak (principally due to 436 diatoms) of abundance was observed in the frontal area, with densities similar to those of the stations closer to the Po 437 mouth. The most abundant groups were represented by diatoms and phytoflagellates (ranging from 0.014 to 438 4.8 106 cells L-1 and from 0.25 to 3.8 106 cells L-1, respectively, Tab. S4) in agreement with several previous studies 439 on phytoplankton composition in the northern Adriatic Sea (Totti et al., 2005).
440 DOC concentrations decreased along the Po plume, with values that ranged between 140 μmol L-1 at the Po mouth 441 and 60 μmol L-1 in open sea, with a variation of 60% (Fig. 3). This horizontal decreasing trend of DOC was also 442 observed in the water column, with bottom values that were 40-60% lower than those of the surface. This distribution 443 changed in the marine area, where after a slightly increase within the first 15-m depth, it was quite homogeneous down 444 to the bottom.
445 DIN (ranging from 1 μmol L-1 to 90 μmol L-1) and orthosilicates, Si(OH)4 (ranging from 0.02 to 42 μmol L-1) 446 showed a decreasing trend (98%) seawards (Fig. 4). DIN was represented for the most part by nitrates (60-100% of the 447 total). A very small fraction (ranging from 0.1% to 15%) of the DIN was represented by ammonium, while nitrites 448 represented a more remarkable quote (1-40% of the total). Both DIN and orthosilicates were characterized by a general 449 drawdown of concentrations within the stratified layer. This decreasing trend was more marked in the stations closer to 450 the Po, because of the river influence. Afterward, concentrations remained almost constants with depth, while at the 451 bottom they arose again (the anomalous high seafloor value of nitrates at Stn. 6 was probably due to contamination 452 problems, and thus, it was not considered in the computation of DIN) (Fig. 4).
453 Orthophosphates were generally low, with values ranging from 0.04 μmol L-1 to 0.12 μmol L-1. They showed an 454 opposite trend with respect to nitrogen species and silicates, concentrations increasing of 50% along the transect (Fig.
455 4). Phosphate distribution in the water column varied greatly from station to station. In Stns. 1 and 3 it increased gradually 456 with depth, while at Stn. 2 a gradual decrease was observed. From Stn. 4 to the open sea, phosphates showed a maximum 457 at the pycnocline; afterwards they slightly decreased down to the bottom.
458 459
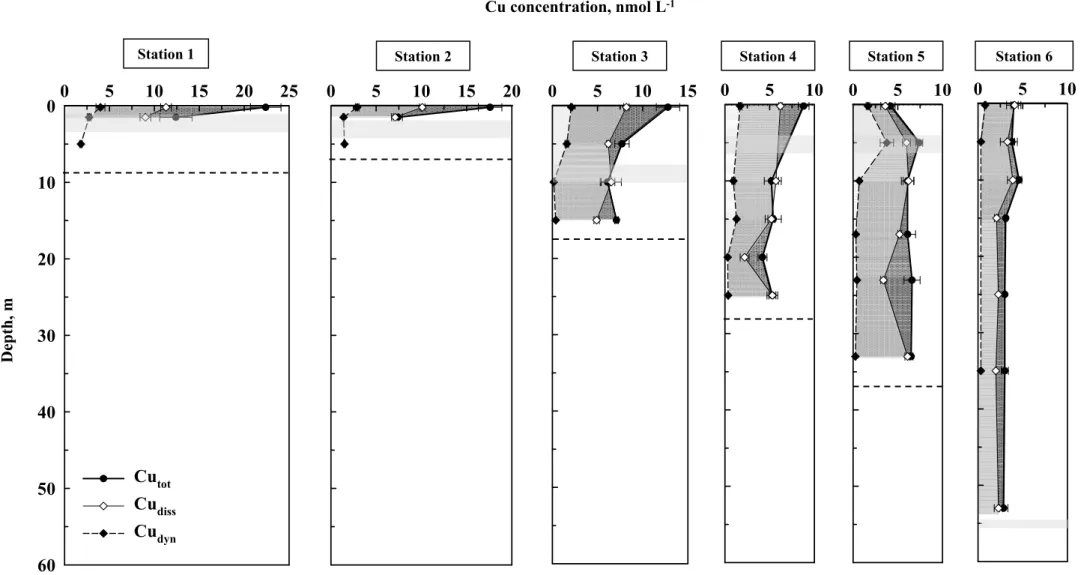
460 3.3. Metal speciation
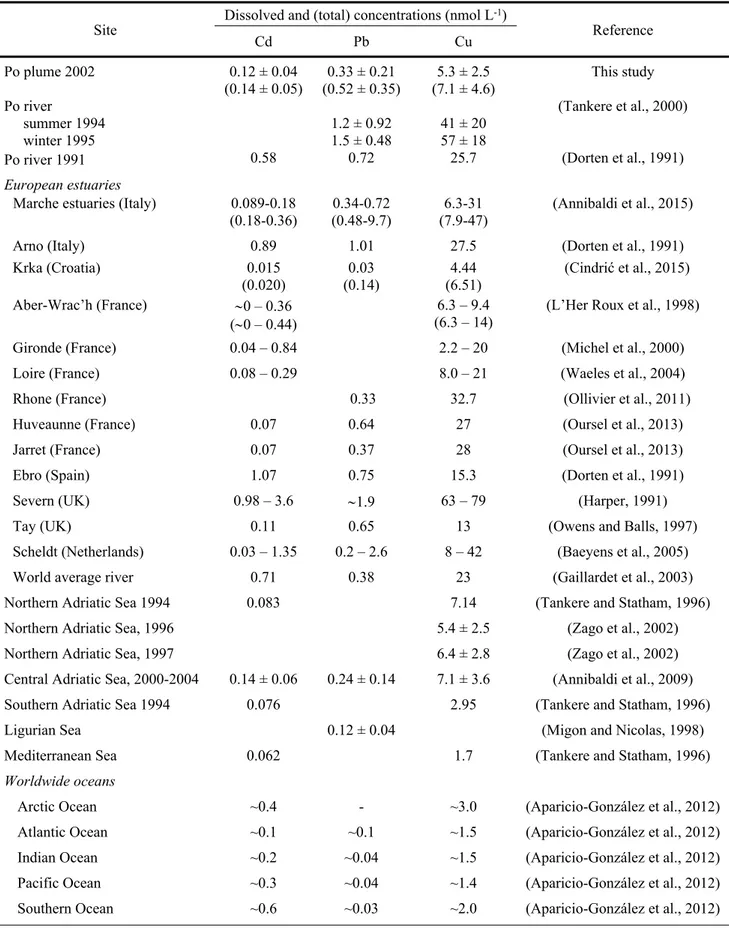
461 The distribution of the different metal fractions along the study transect is reported in Figures 5-8, divided for each metal 462 and for each sampling station. Total, dissolved, particulate, dynamic and colloidal concentrations are given for each 463 element. Also free-ion metal concentrations are discussed, even if these data are reported only in Tab. S2, due to the 464 paucity of the values measured. Data on dynamic fraction are the mean of measurements carried out by each of the VIP 465 systems available on board, with the exception of contaminated samples. It is to be noted that preliminary results on free 466 metal ion concentrations have been previously reported in Tercier-Waeber et al. (2005). Here, we provide a more 467 exhaustive description which includes such data presented previously, as well as the comparison with the other metal 468 fractions and master variables. The metal concentrations here measured are also compared to literature data obtained from 469 several estuaries, deltas, coastal and oceanic waters, worldwide (Table 1).
470
471 3.3.1. Cadmium
472 The Cd content in the waters of the transect was very low with an overall mean (interquartile range) of 0.14 (0.11 – 473 0.16) nmol L-1. Our values are lower than those recorded in previous surveys in the same area and in other Italian rivers, 474 while they are similar to Cd concentrations measured in the whole basin of the Adriatic Sea and in general in the 475 Mediterranean Sea. Further, our values are as in the same order of magnitude as those found elsewhere in European 476 estuaries and, in general, as those measured in oceanic waters worldwide (Tab. 1).
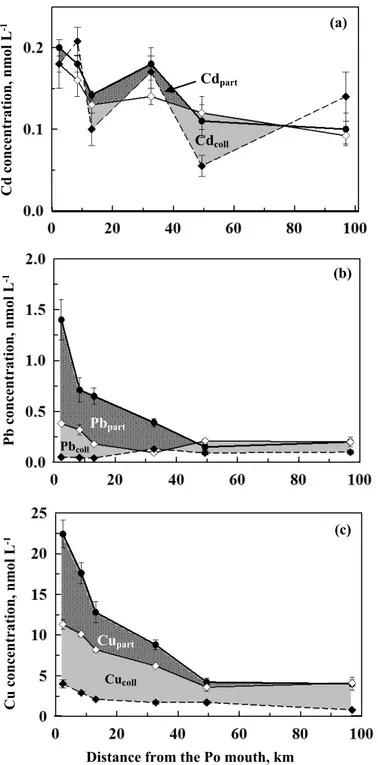
477 A general longitudinal decreasing trend can be observed seaward for all the Cd fractions detected (Fig. 5a). Dissolved 478 Cd (from 0.068 nmol L-1 to 0.25 nmol L-1) constituted the most important fraction of the total (concentrations ranging 479 between 0.080 nmol L-1 and 0.26 nmol L-1). The only exception was present in the stations closer to the Po mouth, where 480 a more marked contribution by particulate fraction can be detected, though Cddiss percentages remained still high (70-90%
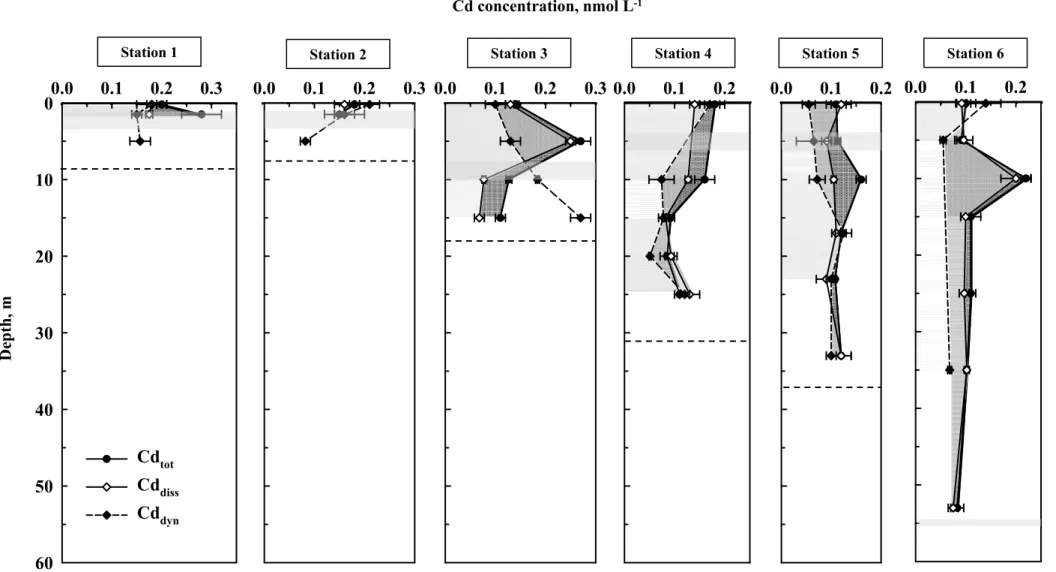
481 of the total). The vertical profile of dissolved Cd showed an almost homogeneous behaviour over the transect, with a 482 maximum (excepting in the pro-delta area) at the DCM (5-10 m depth).
483 Apart from the high values at the surface of Stns. 2, 4 and 6 and at the bottom of Stn. 3, due to possible contamination 484 problems, the Cd dynamic fraction accounted for 40% to 100% of Cddiss (values ranging from 0.05 nmol L-1 to 0.20 485 nmol L-1). The percentage of this fraction with respect to the dissolved concentration was high (90-100%) in the pro-delta 486 area, while it decreased seawards within the UML, reaching in the open sea values about half to the Cddiss (Fig. 6). Below 487 the pycnocline, the concentration of Cddyn increased down to the seafloor, where its percentage was again 90-100% of 488 Cddiss. In the open sea, a quite homogeneous distribution of Cddyn with depth was observed, with a contribution to the 489 dissolved fraction of about 60-70%. An opposite trend was observed for the colloidal Cd fraction, that increased seaward, 490 reaching values 40-50% of Cddiss, and sharply decreased with depth to values close to zero (Fig. 6).
491 Free Cd-ion [Cd2+] concentrations were found to be below the detection limit (~60 pmol L-1, as reported in Noël et 492 al., 2006) for both the CGIME sensor and the HF-PLM system (Tab. S-2).
493
494 3.3.2. Lead
495 Lead speciation changed greatly along the transect (Fig. 5b and Fig. 7). The total concentration of Pb was generally 496 high at the Po river mouth (1.4 nmol L-1) and then decreased seaward, to reach asymptotically an open sea value of 497 0.2 nmol L-1, with an 85% decreasing trend. At the surface of the pro-delta and frontal areas, Pb content was dominated 498 by the particulate fraction (accounting for 70% of the total), since dissolved Pb showed low concentrations (0.40 nmol 499 L-1). Pbdiss initially decreased in the frontal area, passing from 0.4 nmol L-1 at the Po River mouth to 0.09 nmol L-1 up
500 to 30 km off shore from the river. Proceeding seaward, it increased both in absolute and in relative terms reaching values 501 close to those of the Pbtot (0.2 nmol L-1). Therefore, Pbpart greatly decreased along the Po plume, reaching values close 502 to zero in the marine area. Both the total and the dissolved Pb concentrations were in good agreement with data reported 503 in the literature for the same area and for other rivers worldwide (Tab. 1). Obviously, our data are higher than those 504 referred to oceanic waters (sometimes about one order of magnitude) with the exception of the seawater end-member 505 values, which fall within the same order of magnitude of literature data.
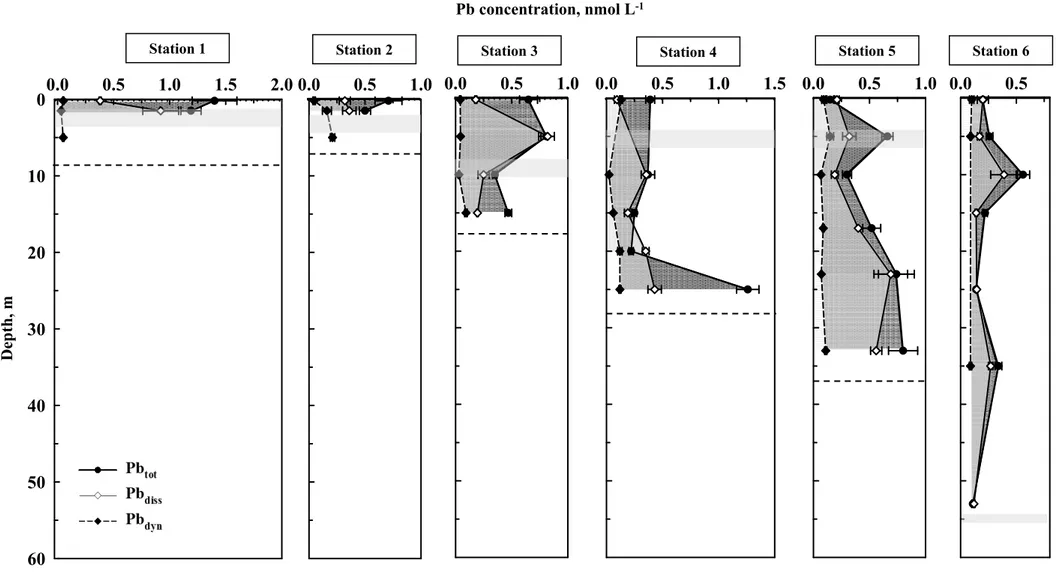
506 In the water column, Pb was mainly present in its dissolved form (70 – 100% of the total) which was also responsible 507 of the maximum of Pbtot at the DCM (5-10 m depths). The particulate fraction returned significant at the seafloor, where 508 its contribution to the total increased up to 70%.
509 The dynamic fraction of Pb ranged between 0.02 nmol L-1 and 0.2 nmol L-1. In general, Pbdyn represented a very 510 small and constant fraction of the Pbdiss (15-20%) within the first 10 km far from the Po mouth, further offshore it greatly 511 increased in both its concentration and percentage reaching at the surface values up to the 50% of the dissolved 512 concentration. The contribution of Pbdyn with respect to the dissolved concentrations increased with depth in the stations 513 close to the Po mouth, while it decreased in the water column with the increasing of the distance from the river. Hence, 514 the colloidal fraction of Pb was dominant (~80% of the Pbdiss) in the pro-delta area and then decreased in the open sea to 515 values half of those of Pbdiss (Fig. 7).
516 The free-ion Pb fraction (no CGIME data are available) showed very low concentration, varying from about 2 pmol L-1 517 near the Po river to 10 pmol L-1 in the open sea (Tab. S-2). It represented a few percentages of the Pbdiss (from 1% to 518 10%), but the contribution to Pbdyn was much higher (from 5% to 40%). Due to the very few data available for this 519 fraction, we are not able to describe in details the behaviour of [Pb2+] in the study area. We can only observe an increasing 520 trend of [Pb2+], both in absolute and in relative terms with the distance from the river and with depth.
521 522
523 3.3.3. Copper
524 Copper showed a marked decreasing trend of all the fractions along the study transect (Fig. 5c, 8).
525 Total Cu concentration varied from 3 nmol L-1 to 20 nmol L-1, and it mainly constituted of the dissolved fraction 526 that ranged from 2 nmol L-1 to ~11 nmol L-1. The contribution of Cudiss to Cutot at the surface increased along the study 527 transect, Cudiss being 100% of the total in the open sea. Both total and dissolved Cu values are similar to those recorded 528 in previous surveys for the northern and central Adriatic Sea (Tab. 1), with the only exception of Tankere et al., 2000 who 529 reported Cu higher values. For the Southern Adriatic Sea and the rest of the Mediterranean Sea (Tankere and Statham,
530 1996) lower values have been reported as well as for the oceanic waters (Tab. 1). Dissolved Cu concentrations were 531 generally lower than those measured in other European estuaries and than the average value of the rivers worldwide (Tab.
532 1).
533 A vertical decreasing trend of Cutot was also observed within the Po plume. At the boundary of the frontal area (Stn.
534 5) and in the marine area, Cutot showed a maximum in the upper 10-15 m of the water column, and then it remained almost 535 constant with depth (Fig. 8). Moreover, Cudiss decreased within the stratified layer; and below it remained almost constant 536 down to the seafloor with values close to Cutot. Therefore, the Cudiss proportion increased with depth reaching values up 537 to 90% of the total. Total particulate Cu was high at the surface in the stations of the pro-delta and decreased seaward 538 and with depth reaching low values (up to 30% in the open sea) (Fig. 8).
539 As for Pb, the dynamic fraction of Cu represented a small fraction (up to ~50% Fig. 5c) of the dissolved concentration, 540 with values ranging between 0.15 and 4.0 nmol L-1. The fraction of dissolved Cu associated to colloidal material was 541 much more significant (~70-100% of the Cudiss). Both Cudyn and Cucoll concentrations decreased seaward, but the 542 contribution of the Cucoll to the dissolved Cu slightly increased along the transect (Fig. 5c).
543 Considering the water column, Cudyn decreased at all the stations within the stratified layer (with the exception of Stn.
544 5 where a maximum at 5-m depth was observed); afterwards it remained almost constant down to the seafloor (Fig. 8).
545 The proportion of Cudyn vs. Cudiss was 30% within the stratified layer, for all the stations, and then it drastically fell to 546 7% near the seafloor. Also Cucoll decreased within the stratified layer, but contrary to Cudyn, below the pycnocline it 547 increased with depth. Its percentage to Cudiss was generally higher than Cudyn and slightly increased in the water column.
548 In the marine area (Stn. 6), although the very few data available on dynamic Cu, a sub-surface decrease and a subsequent 549 homogeneous distribution with depth can be recognized (Fig. 8).
550 The Cu free-ion fraction measured by the CGIME sensor showed very low values ranging between 0.03 nmol L-1 to 551 0.62 nmol L-1 (Tab. S-2). [Cu2+] decreased by 95% along the transect, as well as the proportion of this fraction with 552 respect to the dissolved concentration decreased by 90% seawards. Data available for this fraction are scarce, thus a 553 proper description of Cufree variation in the water column cannot be defined, even if an apparent decrease can be noted.
554 555
556 3.4. Multivariate statistical data analysis
557 The correlation matrix (Pearson’s linear coefficients) is reported in Table S5.
558 Among nutrients, only NO3‒ and Si(OH)4 co-varied positively (highly significant correlation), whereas PO34‒ showed 559 no correlations with the other nutrients, even in the surface layers. Chl-a was associated with O2, pH, total phytoplankton