doi: 10.3389/fenvs.2020.00118
Edited by:
Adam Jerold Reed, University of Southampton, United Kingdom Reviewed by:
Jianfang Hu, Guangzhou Institute of Geochemistry, CAS, China Geoffrey Denis Abbott, Newcastle University, United Kingdom
*Correspondence:
Loeka L. Jongejans Loeka.jongejans@awi.de
Specialty section:
This article was submitted to Biogeochemical Dynamics, a section of the journal Frontiers in Environmental Science
Received:04 March 2020 Accepted:02 July 2020 Published:21 July 2020
Citation:
Jongejans LL, Mangelsdorf K, Schirrmeister L, Grigoriev MN, Maksimov GM, Biskaborn BK, Grosse G and Strauss J (2020) n-Alkane Characteristics of Thawed Permafrost Deposits Below a Thermokarst Lake on Bykovsky Peninsula, Northeastern Siberia.
Front. Environ. Sci. 8:118.
doi: 10.3389/fenvs.2020.00118
n-Alkane Characteristics of Thawed Permafrost Deposits Below a
Thermokarst Lake on Bykovsky Peninsula, Northeastern Siberia
Loeka L. Jongejans1,2* , Kai Mangelsdorf3, Lutz Schirrmeister1, Mikhail N. Grigoriev4, Georgii M. Maksimov4, Boris K. Biskaborn5, Guido Grosse1,2and Jens Strauss1
1Section of Permafrost Research, Alfred Wegener Institute, Helmholtz Centre for Polar and Marine Research, Potsdam, Germany,2Institute of Geosciences, University of Potsdam, Potsdam, Germany,3Section of Organic Geochemistry, GFZ German Research Centre for Geosciences, Potsdam, Germany,4Laboratory of General Geocryology, Melnikov Permafrost Institute, Siberian Branch of the Russian Academy of Sciences, Yakutsk, Russia,5Section of Polar Terrestrial Environmental Systems, Alfred Wegener Institute Helmholtz Centre for Polar and Marine Research, Potsdam, Germany
Rapid permafrost thaw by thermokarst mobilizes previously frozen organic matter (OM) down to tens of meters deep within decades to centuries, leading to microbial degradation and greenhouse gas release. Late Pleistocene ice-rich Yedoma deposits that thaw underneath thermokarst lakes and refreeze after lake drainage are called taberal sediments. Although widespread, these have not been the subject of many studies. To study OM characteristics and degradability in thawed Yedoma, we obtained a 31.5 m long core from beneath a thermokarst lake on the Bykovsky Peninsula, northeastern Siberia. We reported radiocarbon ages, biogeochemical parameters [organic carbon (OC) content and bulk carbon isotopes] and n-alkane distributions.
We found the most degraded OM in frozen, fluvial sediments at the bottom of the core, as indicated by the lowest n-alkane odd-over-even predominance (OEP; 2.2).
Above this, the thawed Yedoma sediments had an n-alkane distribution typical of emergent vegetation, suggesting a landscape dominated by low-centered polygons.
These sediments were OC poor (OC content: 0.8 wt%, 60% of samples<0.1 wt%), but the OM (OEP∼5.0) was better preserved than in the fluvial sediments. The upper part of the Yedoma reflected a transition to a drier, grass dominated environment. Furthermore, this unit’s OM was least degraded (OEP∼9.4). The thermokarst lake that formed about 8 cal ka BP thawed the Yedoma in the talik and deposited Holocene lake sediments containing well-preserved OM (OEP∼8.4) with the highest n-alkane concentrations (20.8µg g−1 sediment). Old, allochthonous OM was found in the thawed Yedoma and frozen fluvial deposits. Using ann-alkane endmember model, we identified a mixed OM input in all units. In our study, the thawed Yedoma sediments contained less OC than reported in other studies for still frozen Yedoma. The Yedoma OM was more degraded compared to previous biomarker research on frozen Yedoma. However, this signal is
fenvs-08-00118 July 18, 2020 Time: 19:19 # 2
Jongejans et al. Biomarkers in Thawed Permafrost
overprinted by the input signal. The fluvial deposits below the Yedoma contained more OM, but this OM was more degraded, which can be explained by the OM input signal.
Continued talik deepening and expansion of this thermokarst lake and others similar to it will expose OM with heterogeneous properties to microbial degradation.
Keywords: Russian Arctic, organic matter degradability, Yedoma deposits, thermokarst lake, talik, molecular biomarkers
INTRODUCTION
Current climate change is causing rapid changes in the Arctic.
Accordingly, permafrost deposits are warming and thawing in many regions including Siberia (Biskaborn et al., 2019). Thawing leads to increased microbial decomposition of the previously freeze-locked organic matter (OM) (Mackelprang et al., 2011;
Schuur et al., 2015). The amount of organic carbon (OC) that may be mobilized from thawed permafrost sediments is constrained by the OM quantity and quality. Top-down thaw by deepening of the seasonally thawed layer (active layer) largely affects OM in the active layer and near surface permafrost, some of which has already been influenced by early Holocene deeper active layer thaw (French, 1999;Lacelle et al., 2019). Deep permafrost thaw processes, however, such as thermokarst development, may expose OM from Late Pleistocene permafrost deposits to microbial degradation down to tens of meters deep for the first time (Heslop et al., 2019;Turetsky et al., 2020).
Ice-rich, syngenetic Yedoma deposits are late Pleistocene permafrost deposits that are widespread in northern Siberia and Alaska (Schirrmeister et al., 2013) and contain a significant OC pool (Strauss et al., 2013; Hugelius et al., 2014). Yedoma deposits that thawin situin taliks underneath thermokarst lakes become diagenetically altered due to ice-loss and compaction.
Following lake drainage, these talik sediments can refreeze again, after which they are called taberal sediments: in situ thawed, diagenetically altered and refrozen sediments (Romanovskii, 1993). Strauss et al. (2013) estimated that about 10% of the Yedoma region is covered by lakes and rivers and 56% by drained lake basins with likely refrozen taberal deposits. After thawing of the Yedoma deposits, anaerobic conditions in the water-logged compacted talik sediments promote methane production (Zimov et al., 1997;Walter et al., 2006). Although spatially widespread, taberal sediments have not been subject of many studies yet and are rarely included in OC storage estimates or studies of OM degradability.
A first estimate of the taberal deposit OC pools suggests
∼114 Gt OC, which is about 25% of the Yedoma domain OC storage (∼398 Gt) (Walter Anthony et al., 2014; Strauss et al., 2017). In several studies, it is also shown that the OM degradability in Yedoma deposits is higher compared to that in Holocene deposits (Knoblauch et al., 2013; Strauss et al., 2015;
Jongejans et al., 2018;Stapel et al., 2018). However, the fate of OM in Yedoma deposits affected by thawing and subsequent qualitative and quantitative changes is poorly understood.
Various studies indicate that OM from thawed Yedoma becomes partially degraded. For example, Wetterich et al. (2009)found
that plant material was further degraded in taberal deposits than in Yedoma deposits in the Dmitry Laptev Strait.
The study of the biomolecules and other OM characteristics can give important insights into OM degradability and could hence greatly improve estimates of permafrost OM mobilization (Andersson and Meyers, 2012;Sánchez-García et al., 2014). A few studies have previously focused on molecular biomarkers in northeastern Siberian permafrost deposits (Zech et al., 2010;
Höfle et al., 2013; Strauss et al., 2015; Stapel et al., 2018). In general, the abundance and distribution ofn-alkanes, which are long-chained, single bonded hydrocarbons, are used as indicator for OM characterization. The length ofn-alkanes is an indicator for OM source. Long chained n-alkanes (>22 carbon atoms) mainly originate from vascular plants, for example in leaf waxes, whereas short chains (12–20 carbon atoms) are produced by bacteria and algae (Killops and Killops, 2013). The ratio of odd to even chains – expressed as carbon preference index (CPI) (Bray and Evans, 1961; Marzi et al., 1993) or odd-over-even predominance (OEP) (Zech et al., 2009;Struck et al., 2019) – is an indicator for OM degradability and decreases with ongoing alteration of the OM. Furthermore, several studies in temperate latitudes showed that relativen-alkane proportions can be used to distinguish between vegetation types. n-C23 andn-C25 are predominant in aquatic macrophytes and Sphagnum mosses (Ficken et al., 1998;Bingham et al., 2010;Bush and McInerney, 2013),n-C27andn-C29are mainly produced by trees and shrubs, andn-C31andn-C33mostly derive from grasses and herbs (Zech et al., 2009; Schäfer et al., 2016). Very few comparable studies were carried out for talik or taberal sediments (Romankevich et al., 2017;Ulyantsev et al., 2017).
Thus, for the first time we present molecular biomarker characteristics from Yedoma deposits thawed in situ in the talik underneath a thermokarst lake. This study aims to answer the following research questions: (1) what is the sedimentation history of the Yedoma deposits at the study site and (2) what is the OM degradation potential of Yedoma deposits already thawed in a talik?
STUDY AREA
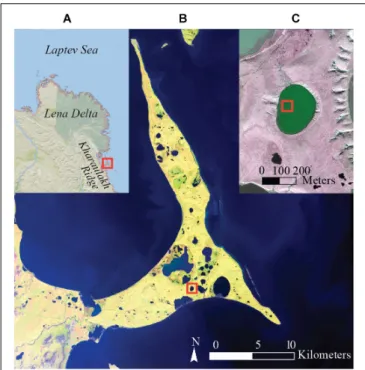
To answer these research questions, we analyzed a 31.5 m long sediment core from sediments underneath Goltsovoye Lake, a thermokarst lake on Bykovsky Peninsula in northeastern Siberia. The Bykovsky Peninsula is a remnant of a former late Pleistocene Yedoma accumulation plane, situated in the foreland of the Kharaulakh Ridge at the Laptev Sea coast (Figure 1).
FIGURE 1 |Bykovsky Peninsula in northeastern Siberia.(A)Bykovsky Peninsula (red square) at the Laptev Sea coast, southeast of the Lena Delta and east of the Kharaulahk Ridge,(B)Goltsovoye Lake (red square) close to southern coast of Bykovsky Peninsula,(C)coring location PG2412 and PG2420 (red square;∼20 m apart) in Goltsovoye Lake. Source imagery: (a) ESRI Basemap: National Geographic World Map, (b) ESA Sentinel-2 False Color Composite (11-8-2) acquired 2019-08-03, (c) World View 3 Image acquired 2019-09-02 (©DigitalGlobe).
The area is characterized by continuous permafrost, which reaches depths down to 600 m (Grigoriev, 1960). The modern surface morphology is characterized mainly by Yedoma uplands (up to 45 m a.s.l.) and thermokarst depressions and lakes, as well as thermal erosional valleys (Siegert et al., 2002;Grosse et al., 2007). Nival and slope processes in the nearby Kharaulakh Ridge andin situfrost weathering after deposition led to the formation of the Yedoma uplands in the mountain foreland during the late Pleistocene (Schirrmeister et al., 2002a;Strauss et al., 2012).
Strong permafrost degradation since the late Pleistocene to early Holocene transition resulted in thermokarst development and thermal erosion of the Yedoma uplands, which characterize the modern relief of the Bykovsky Peninsula (Grosse et al., 2005). The Bykovsky Peninsula is covered by about 14.4% by thermokarst lakes and lagoons while 46.1% are covered by drained thermokarst lake basins (Grosse et al., 2005).
Goltsovoye Lake (71.74515◦N, 129.30217◦E) is a medium- sized thermokarst lake (dimensions: 630 by 480 m, surface:
∼23 ha) located close to the southern coast of the peninsula (Figure 1). The lake reaches a water depth of about 5 m and has a talik reaching about 30 m deep (Strauss et al., 2018).
It is mainly surrounded by Yedoma deposits that are eroded along the lake shore, and drained thermokarst lake basins which are characterized by ice wedge polygons. Several other thermokarst lakes in the vicinity transitioned to thermokarst
lagoons already due to coastal erosion and inundation with sea water, allowing salt water to interact with the former freshwater taliks (Jenrich, 2020).
Previous permafrost research on the Bykovsky Peninsula included cryostratigraphical and cryolithological research on Yedoma and thermokarst-affected deposits (Kunitsky, 1989;
Slagoda, 1993;Schirrmeister et al., 2002a,b, 2018;Slagoda, 2004, 2005; Grosse et al., 2007; Romankevich et al., 2017; Ulyantsev et al., 2017). The total organic carbon (TOC) content of Yedoma deposits on the east coast of the Bykovsky Peninsula (Mamontovy Khayata) ranges from 2 to 14 wt%, whereas Holocene cover deposits on top of the Yedoma have a TOC between 2 and 27 wt%
(Schirrmeister et al., 2002a). In a transect study in the central part of Bykovsky Peninsula,Fuchs et al. (2018)found mean TOC values of 5.1±4.3 wt% for the upper 3 m on Yedoma uplands consisting of Holocene cover deposits and 7.9 ± 9.0 wt% for drained thermokarst lake basin deposits.
Despite the coastal setting, the modern climate of the Bykovsky Peninsula is rather continental with long, severe winters (September-May) and short, cold summers. The mean air temperature (2000–2016) is−29◦C in January and+8◦C in July (Tiksi Hydrometeorological Observatory) and the mean annual precipitation is less than 350 mm. Mean ground temperatures reach −9 to −11◦C. This region is dominated by moss-grass low shrub tundra and is therefore classified as northern tundra (Treshnikov, 1985).
MATERIALS AND METHODS Field Work
Field work on the Bykovsky Peninsula was carried out in April 2017 (Strauss et al., 2018). Over the course of 4 days, a 31.5-m long sediment core (PG2412; 71.74515◦N, 129.30217◦E) was retrieved from the deepest point in Goltsovoye Lake (Figure 1), using a URB2-4T drilling rig placed on a truck. The ice cover of the thermokarst lake was 195 cm thick and sediments started at 510 cm from the ice surface. For the depth assignment of the sample material, the water column with the ice cover was included (e.g., seeFigure 2). Thus, depth measurements started at the ice surface. The core consisted of unfrozen talik sediments (until 3425 cm) and frozen sediments below the talik. The upper few meters of sediment consist of gray silty, fine sand and include plant remains and biogenic shells. Deeper in the core, coarser sandy intervals containing 2-cm-big pebbles alternate with fine sand intervals with large wooden remains. In general, abundant wooden remains and organic-enriched layers were observed between 3665 and 1900 cm. The core material was documented and protected and transported frozen to Potsdam for subsampling. During drilling, core loss happened in the intervals: 3550–3510 cm, 2135–2050 cm and 910–755 cm.
We compare the data from the PG2412 sediment core with the data from a 5 m long sediment core (PG2420; 71.74530◦N, 129.30243◦E) that was drilled∼20 m away from PG2412, using a UWITEC piston coring system (Strauss et al., 2018;Biskaborn and Sens, 2020). From here on, we will refer to core PG2412 as the long core and PG2420 as the short core.
fenvs-08-00118 July 18, 2020 Time: 19:19 # 4
Jongejans et al. Biomarkers in Thawed Permafrost
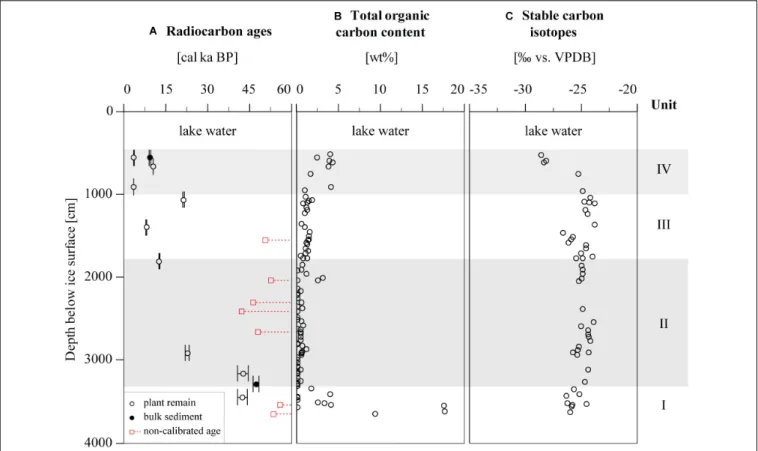
FIGURE 2 |Radiocarbon ages and biogeochemical parameters of Goltsovoye Lake sediment core PG2412.(A)Calibrated radiocarbon ages (open circles: plant remains dated, closed circles: bulk sediment dated, red circles: non-calibrated infinite ages),(B)total organic carbon content and(C)stable carbon isotopes. Units indicated on the right.
Laboratory Analyses
The long core was described in detail and subsampled for laboratory analyses. Pore water was extracted from thawed samples using rhizon soil moisture samples (membrane pore size:
0.12–0.18 µm). The pH and electrical conductivity (µS cm−1) were measured from the pore water. The sediment samples were freeze-dried and the water content was determined based on the weight difference before and after drying.
Eighteen samples were selected for radiocarbon dating from the long core. Macrofossils such as plant (sedges and twigs) and wooden remains were dated using Accelerator Mass Spectrometry in the AWI MICADAS Laboratory in Bremerhaven. For two of the samples, bulk sediment was dated due to the lack of visible macrofossils. Radiocarbon dates were calibrated using the CALIB 7.1 software and the IntCal13 calibration curve, and expressed as calibrated kilo years before present (cal ka BP) (Stuiver et al., 2017).
The grain size distribution of 71 samples from the long core was measured with a laser particle size analyzer (Malvern Mastersizer 3000, <1 mm fraction) after removal of organic material by treating the samples with hydrogen peroxide (30%).
The samples were washed, freeze-dried, manually homogenized and sieved (<1 mm fraction measured) before measuring.
Here, we show the grain size distribution of the fraction from 0.1µm to 1 mm.
Homogenized bulk samples (n= 92, sample interval:∼35 cm) from the long core were analyzed for total nitrogen (TN) and total carbon (TC; Elementar Vario El III), and total organic carbon (TOC; Elementar Vario Max C), which are expressed in weight percentage (wt%). The stable carbon isotopic composition was determined for all samples with TOC values above the detection limit (0.1 wt%). The measured δ13C (Thermo Fisher Scientific Delta-V-Advantage gas mass spectrometer equipped with a FLASH elemental analyzer EA 2000 and a CONFLO IV gas mixing system) is compared to the standardized Vienna Pee Dee Belemnite (VPDB) and expressed in per mille (hvs. VPDB).
TOC values below the detection limit were not considered in further calculations.
For the short core, the same methods were used for radiocarbon dating, TOC content and stable carbon isotopes.
Biomarker Analysis
Twenty three samples from the long core were analyzed for lipid biomarkers at the German Research Centre for Geosciences (GFZ) afterSchulte et al. (2000). Extraction of OM was done with a Dionex 200 ASE extractor using dichloromethane/methanol (DCM/MeOH, 99:1 v/v, heating phase 5 min, static phase 20 min at 75◦C and 5 MPa). The extracts were passed over a sodium sulfate column withn-hexane and four internal standards were added for compound quantification: 5α-androstane, ethylpyrene,
5α-androstan-17-one and erucic acid. Using medium-pressure liquid chromatography (MPLC) after Radke et al. (1980), the extracts were separated into an aliphatic, aromatic and NSO (nitrogen-, sulfur- and oxygen-containing compounds) fraction.
n-Alkanes were measured in the aliphatic fraction using gas chromatography/mass spectrometry (GC-MS; GC Trace GC Ultra and MS DSQ, Thermo Electron Corporation) as described by Jongejans et al. (2018) (capillary column from BPX5, 22 mm ×50 m, 0.25µm). Compounds were identified and quantified with respect to the internal standards from full scan mass spectra (m/z 50–600 Da, 2.5 scans s−1) using the software XCalibur.
Biomarker Indices
The total lipid concentration of n-alkanes is expressed in microgram per gram of sediment (µg g−1sed.) and per gram of TOC (µg g−1TOC).
The average chain length (ACL) of n-alkanes provides a measure for the main focus of the n-alkane chain length distribution and is used to identify OM source. Long-chain n-alkanes are produced by terrestrial higher plants for instance in mosses (n-C23andn-C25), in leaf waxes (n-C27andn-C29) and in grasses (n-C31andn-C33) (e.g., 1998;Zech et al., 2009), whereas short-chainn-alkanes are mainly produced by bacteria and algae (Killops and Killops, 2013). The ACL was calculated forn-alkanes with carbon number 23–33 according to Equation (1) whereiis the carbon number (Poynter and Eglinton, 1990).
ACL23−33= Pi·Ci
PCi
(1) The CPI and odd-over-even predominance (OEP) indicate the maturity of the OM. High values typically correspond to fresh, undegraded OM, and the ratios decrease with degradation (Bray and Evans, 1961;Marzi et al., 1993). The starting values depend on the composition of the source material. These indices were calculated following Equation (2) (Marzi et al., 1993) and (3) (Zech et al., 2009;Struck et al., 2019), respectively. As both indices are used in other studies, both parameters are presented here.
CPI23−33 =
Podd C23−31+P
odd C25−33
2·P
even C24−32
(2)
OEP26−33 =
Podd C27−33
Peven C26−32
(3) Schäfer et al. (2016)developed ann-alkane endmember model to distinguish between trees and shrubs, and grasses and herbs. It is based on then-alkane ratio (after Equation 4) and the OEP.
n−Alkane ratio= C31+C33 C27+C31+C33
(4) In their pilot study,Ficken et al. (2000)proposed the proxy Paq for submerged or floating macrophytes (Paq >0.4) versus emergent (0.1<Paq<0.4) and terrestrial plant input (Paq<0.1;
Equation 5).
Paq= C23+C25
C23+C25+C29+C31 (5)
As this proxy has only been used in tropical and temporal regions, we focus on the trend of the Paq and do not put weight on the proposed ranges.Zheng et al. (2007)developed the proxy Pwaxto express the share of OM derived from terrestrial plants (Equation 6).
Pwax= C27+C29+C31 Podd C23−31
(6)
RESULTS
Based on clustering of the n-alkane parameters (see “n-Alkane Distributions”), we divided the long core into four units. Unit I ranged from 3665 to 3300 cm, Unit II from 3300 to 1800 cm, Unit III from 1800 to 1000 cm and Unit IV from 1000 to 510 cm.
We decided to separate the results and discussion following the statistical clustering of then-alkane parameters. The short core was divided into 3 units from the bottom to the top: Unit A from 1010 to 855 cm, Unit B1 from 855 to 820 cm and Unit B2 from 820 to 510 cm (Figure 3).
For both the long and the short core, we describe the radiocarbon ages and biogeochemical parameters (see section “Bulk Sediment”; Figures 2, 3). For the long core, the hydrochemical parameters are characterized (see section
“Hydrochemistry”;Figure 4), as well as then-alkane parameters (see section “n-Alkane Distributions”; Figure 5). We further calculated general statistics for all parameters (Supplementary Table 1). All reported datasets were published in the open access PANGAEA archive (Biskaborn and Sens, 2020;
Jongejans et al., 2020).
Bulk Sediment
Long Core PG2412
The calibrated radiocarbon ages of the macrofossils and bulk sediment of the long core (Figure 2A) showed a general trend over depth ranging from 47.5 cal ka BP at 3300 cm to 3.6 cal ka BP at 558 cm (surface sediments) (Supplementary Table 2). In Unit I, II and III, seven samples had an infinite age (i.e., below the radiocarbon detection limit; >42.4 to>56.1 ka BP) that could not be calibrated. Unit IV is of Holocene age. The bulk sediment at 558 cm was 5.7 ka older (9.3 cal ka BP) than the macro remains dated from the same sample (3.6 cal ka BP).
In the bottom of the core, the sediments were coarser (Supplementary Figure 1). Unit I contained coarse sand and rounded pebbles (up to 2 cm diameter), as well as finer sandy horizons that were mostly layered. The grain size distribution of Unit I and II (up to ∼25 m) was predominantly unimodal indicating fine sand (Supplementary Figure 1). Units III and IV had a polymodal grain size distribution and the sediments were mostly very coarse silt to very fine sand.
During the drilling, the talik boundary was located at 3425 cm.
Initial temperature data of the borehole (date: 2017-04-23), however, indicated the talik to be ∼32 m deep (Strauss et al., 2018). Unit II, III, and IV were completely unfrozen. The cryostructure below 3425 cm was dominantly pore ice (ice between the organic remains) and partly structureless. Segregated ice was rare (ice lens at 3550 cm, 4 × 0.2 cm; ice band at 3592 cm, 1 cm thick).
fenvs-08-00118 July 18, 2020 Time: 19:19 # 6
Jongejans et al. Biomarkers in Thawed Permafrost
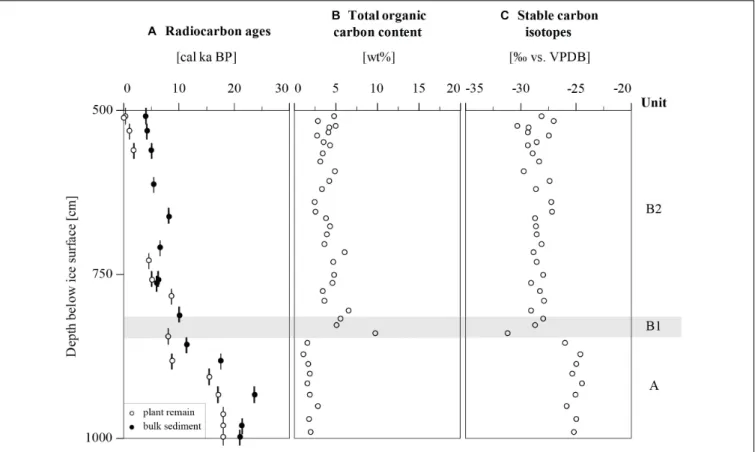
FIGURE 3 |Radiocarbon ages and biogeochemical parameters of Goltsovoye Lake sediment core PG2420.(A)Calibrated radiocarbon dates (open circles: plant remains dated, closed circles: bulk sediment dated),(B)total organic carbon, and(C)stable carbon isotopes. Units indicated on the right.
Unit I was especially enriched in OM. Layers up to 30 cm thick containing twigs, stems, organic layers and lenses, and wooden remains up to 4 cm long in a frozen sandy matrix were found in the interval from 3665 to 3395 cm depth (Supplementary Figure 2A). Signs of cryoturbation were present at 3558 to 3555 cm (Supplementary Figure 2B). In the lowermost layer (3665-3650 cm), vertically oriented twigs up to 2 cm in length were discovered. Furthermore, organic remains were found from 2173–2311 cm, 1989–2050 cm, 1430–1590 cm, 950–1100, and 510–755 cm. The TOC was highest in the bottom of the core (maximum of 17.8 wt% at 3635 cm) (Figure 2B). Unit II and III were very OC poor, but TOC increased again in Unit IV (median:
1.1 wt%). Theδ13C ranged from−28.6hvs. VPDB in Unit IV (523 cm) to−23.8hvs. VPDB in Unit III (1370 cm) (median:
−24.9hvs. VPDB).
Short Core PG2420
The short core was dated from 23.8 to 0 cal ka BP (Figure 3A) (Biskaborn and Sens, 2020). Unit A was deposited during the late Pleistocene, whereas Unit B1 and B2 were of Holocene age. The radiocarbon ages of Unit A ranged from 23.77±0.06 cal ka BP (bulk sediment at 937 cm) to 11.41±1 cal ka BP (bulk sediment at 860 cm). In Unit B, the samples had radiocarbon ages between 10.10±0.05 cal ka BP (at 815 cm) and recent (at 514 cm, surface sediment). Almost all radiocarbon ages from bulk sediments were older than the respective picked plant remains (except for the
sample at 767 cm), with a maximum difference of 8.9 cal ka at 885 cm. However, both profiles show a general depth-related trend to older ages with increasing depth.
The sediments ranged from silty sand in Unit A to clayey silt in Unit B2. Unit B1 was composed of a peat layer. The sediments in Unit A were coarser than in Unit B1 and B2 (Strauss et al., 2018).
The TOC was lowest in Unit A (1.1 wt% at 875 cm), had its maximum in Unit B1 (9.8 wt% at 900 cm), and decreased to
∼4 wt% in Unit B2 (median: 3.6 wt%;Figure 3B).
The bulk carbon isotope ratio was highest in Unit A (−24.4h vs. VPDB at 920 cm) and lowest at the bottom of in Unit B1 (−31.2hvs. VPDB at 842 cm). Above, in Unit B2, the bulk d13C signal ranged between −30.3 and−27.0hvs. VPDB (median:
−28.2hvs. VPDB;Figure 3C).
Hydrochemistry
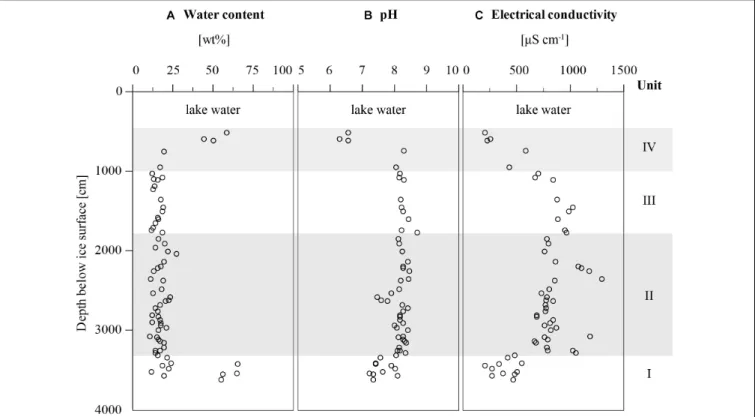
The water content of the long core ranged from 10.5 to 65.4 wt% and was highest in Unit I (frozen part) and the upper three samples of Unit IV (sediment surface samples) (median: 17.1 wt%;Figure 4A). There was not much variation in Unit II and III. The pH slightly increased from 7.2 in Unit I to 8.7 in Unit II, was relatively constant in Units II and III, but was much lower in the topmost three samples with the minimum of 6.3 at 596 cm (median: 8.2; Figure 4B). The electrical conductivity increased from Unit I to Unit II and decreased to the top from Unit III and IV (median: 778µS cm−1;
FIGURE 4 |Hydrochemical parameters of Goltsovoye Lake sediment core PG2412.(A)Water content,(B)pH, and(C)electrical conductivity. Units indicated on the right.
Figure 4C). In all hydrochemical parameters, the lowermost and uppermost samples of the core were substantially different from the middle part.
n-Alkane Distributions
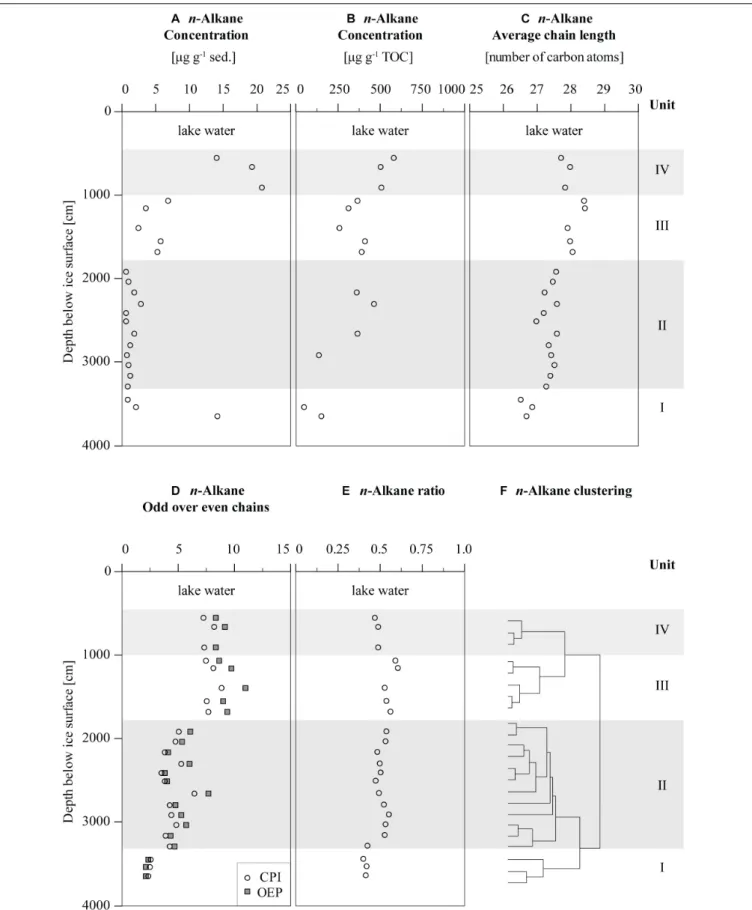
Then-alkane concentration varied from 0.6 to 20.8µg g−1 sed.
(median: 1.8 µg g−1 sed.; Figure 5A and Supplementary Table 3). In contrast to the other samples of Unit I (median: 2.1 µg g−1 sed.), the lowermost sample showed a relatively high value (14.3 µg g−1 sed.). In Unit II and III, the n-alkane concentrations were generally low (median: 0.9 and 5.3 µg g−1 sed., respectively). In contrast, Unit IV was characterized by higher concentrations (median:
19.3 µg g−1 sed.). The n-alkane concentration per gram of TOC primarily increased from the bottom to the top of the core from 50.1 to 581.4µg g−1 TOC with some stagnation in Unit II and III (median: 367.5 µg g−1 TOC; Figure 5B and Supplementary Table 4). The sediments were dominated by long-chainn-alkanes as indicated by a median ACL23−33of 27.5 (Figure 5C), representing the main focus of then-alkane chain length distribution. The ACL increased from the bottom to the top and ranged from 26.5 in Unit I to 28.4 in Unit III. In Unit IV, the values were a bit lower again around 27.8. The CPI and OEP both increased stepwise from Unit I to II and III before they slightly decreased between Units III and IV. Overall, CPI and OEP were between 2.3 and 8.9 (median CPI: 4.8), and 2.2 and 11.0 (median OEP: 5.7), respectively (Figure 5D). Then-alkane
ratio ranged from 0.4 to 0.6 and was slightly higher in Units II and III (Figure 5E).
Clustering of then-alkane data revealed four different units, which were also visible in the stepwise changes in then-alkane proxies (Figure 5). These units seem to represent environmental changes reflected by different n-alkane distributions and were therefore used as subunits of the investigated sediment core (Figure 5F). All described n-alkane parameters were used as input for the clustering. Clustering was carried out in R v. 3.6.1 using the “chclust” function in package “rioja” with method “coniss.”
Odd-carbon number chains dominated the n-alkane distributions of all samples. The dominating chain varied between mid- and long-chain n-alkanes (Supplementary Figure 3). Unit I was dominated byn-C23 andn-C25. Unit II and III were dominated by either n-C27 orn-C29. The upper samples from Unit III (1158 and 1070 cm) were dominated by n-C31and Unit IV again byn-C27.
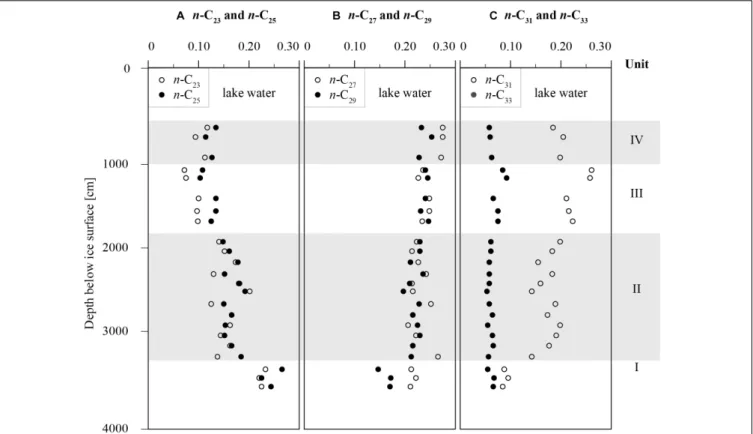
In order to see how the odd chains varied over depth with respect to each other, we calculated the relative n-alkane concentration per gram TOC for the odd chains C23−33
(Figure 6). The n-C33 was least abundant and showed a relatively constant depth profile. Then-C27andn-C29n-alkanes were most abundant. The relative concentration of n-C23 and n-C25 decreased upwards in the core, whereasn-C31 generally increased upwards.
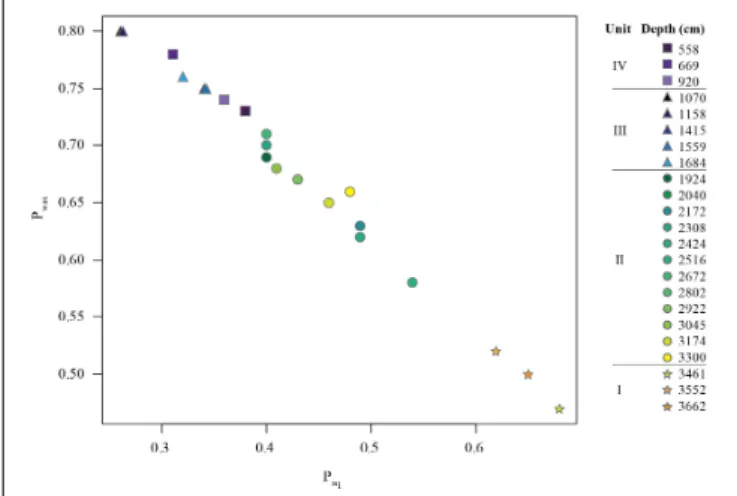
The Paqand Pwaxwere strongly negatively correlated (Pearson correlation index r = −0.995, p < 0.01; Figure 7). The Paq
fenvs-08-00118 July 18, 2020 Time: 19:19 # 8
Jongejans et al. Biomarkers in Thawed Permafrost
FIGURE 5 |n-Alkane parameters of Goltsovoye Lake sediment core PG2412.(A)n-Alkane concentration per gram sediment,(B)n-alkane concentration per gram organic carbon (note: samples with TOC<0.1 wt% not shown),(C)n-alkane average chain length,(D)n-alkane carbon preference index (CPI) and odd-over-even predominance (OEP; gray squares),(E)n-alkane ratio (afterSchäfer et al., 2016), and(F)n-alkane clustering. Units indicated on the right.
FIGURE 6 |Relative concentration of odd chainn-alkanes of Goltsovoye Lake sediment core PG2412.(A)n-C23(open circles) andn-C25(closed circles),(B)n-C27
(open circles) andn-C29(closed circles) and(C)n-C31(open circles) andn-C33(closed circles). Example of formula forn-C23: n-C23/(n-C23+n-C25+n-C27+n-C29+n-C31+n-C33). Units indicated on the right.
decreased with depth with a maximum of 0.68 in Unit I and a minimum of 0.26 in Unit III (median: 0.41).
DISCUSSION
Depositional History at the Study Site
In the following, we discuss the sedimentation and post- depositional history of permafrost and lacustrine deposits on Bykovsky Peninsula based on sediment and biomarker parameters observed in our cores.
Generally, it should be noted that age reversals in the sediment core suggest that old organic material has been remobilized in the thermokarst lake environment, i.e., due to thaw and erosion of surrounding permafrost outcrops along the lake shore, which is typical for such dynamic environments (Lenz et al., 2016). Accordingly, the radiocarbon concentrations of bulk samples represent a mixture of reworked particulate organic matter and fresh organic material from the ecosystem at the time of deposition, causing bulk radiocarbon dates to be offset toward older ages compared to dated plant samples (see also Gaglioti et al., 2014).
The sedimentary record in our core starts with fluvial sediments that were deposited during the early Weichselian (see section “Unit I – Early Weichselian fluvial sedimentation”), after which Yedoma sedimentation took place (see sections
“Unit II – Yedoma Deposition in Wetland Landscapes Dominated by Low-Centered Polygons” and “Unit III/Unit A – Yedoma Deposition Under Cold-Dry Conditions During the Late Weichselian”). During the Holocene, a thermokarst lake formed, which thawed the Yedoma sediments and allowed the deposition of lacustrine sediments (see section “Unit IV/Unit B – Holocene Thermokarst Lake Formation and Lacustrine Sedimentation”). The estimated talik depth based on the core field description following the drilling (3425 cm) was about 2 m deeper than the talik defined by the 0◦C boundary based on the borehole temperature measurements (∼32 m). This inconsistency is caused by drilling heat that has slightly warmed the sediments in the core, making it challenging to visually identify the frozen-unfrozen boundary in the core during the field description. Temperature data from the lake from 1984 indicated that the talik was about 30 m deep (Grigoriev, 1993), which is similar to our findings.
The homogeneous water contents across all units of the long sediment core, with the exception of the uppermost and lowermost samples, suggest that variations are due to potential changes in pore space. The higher OM content in some samples of the fluvial unit may have led to a higher water content, although Strauss et al. (2012) found that the TOC content was too low to affect the total absolute water content of frozen Yedoma substantially. Nevertheless, higher TOC values can be a reason for the increasing water contents toward the top of the core.
fenvs-08-00118 July 18, 2020 Time: 19:19 # 10
Jongejans et al. Biomarkers in Thawed Permafrost
FIGURE 7 |n-Alkane proxies for aquatic (Paq) vs. terrestrial (Pwax) plant input of Goltsovoye Lake sediment core PG2412. Unit I: orange stars, Unit II: green circles, Unit III: blue triangles, Unit IV: purple squares.
The electrical conductivity is low (Figure 4), reflecting a meteoric source for pore waters in interaction with sediment. The electrical conductivity variations over depth might be explained by variation in solid phase surface area: low in Unit I and high in Unit II, leading to lower concentrations in the thawed Unit I and dissolution of mineral material in Unit II. The upwardly decreasing conductivity in Units III and IV suggests a combination of interactions with the solid phase and diffusive exchange with lake water, which has a conductivity of around 200 µS/cm (Strauss et al., 2018). The EC values in the pore water of the Yedoma sediments (669–1301 µS cm−1, median:
812 µS cm−1) are comparable to thawed Yedoma sediments studied in the Ivashkina Lagoon (Schirrmeister et al., 2018).
They found that the EC of water extracts from undisturbed Yedoma sediments at the Mamontovy Khayata were an order of magnitude lower.
Unit I – Early Weichselian Fluvial Sedimentation The coarser sediments and the presence of rounded pebbles in Unit I and the lower part of Unit II, point to a strong fluvial influence. Significant differences in the biogeochemistry (Figure 8) and hydrochemistry between Unit I and II (TOC:
p<0.05,δ13C:p<0.01, water content:p<0.01, pH:p<0.01 and EC:p<0.01) corroborates a different source material. Previous studies found fluvial sediments underneath the Yedoma deposits on the Bykovsky Peninsula (Slagoda, 1993; Siegert et al., 2002;
Grosse et al., 2007;Schirrmeister et al., 2008b), similar to sites in the Lena Delta (Schirrmeister et al., 2003; Wetterich et al., 2008) and on Cape Mamontov Klyk at the western Laptev Sea coast (Schirrmeister et al., 2008a). On the Bykovsky Peninsula, the meandering paleo-Lena River deposited fluvial sediments during the early Weichselian period (100–50 ka BP) (Kunitsky, 1989;Slagoda, 1993, 2004, 2005;Wetterich et al., 2008). The two infinite ages we found in Unit I at 3662 and 3552 cm and the coarse fluvial material suggest that Unit I underneath Goltsovoye Lake has likely formed as part of a regional fluvial depositional environment of the early Weichselian.
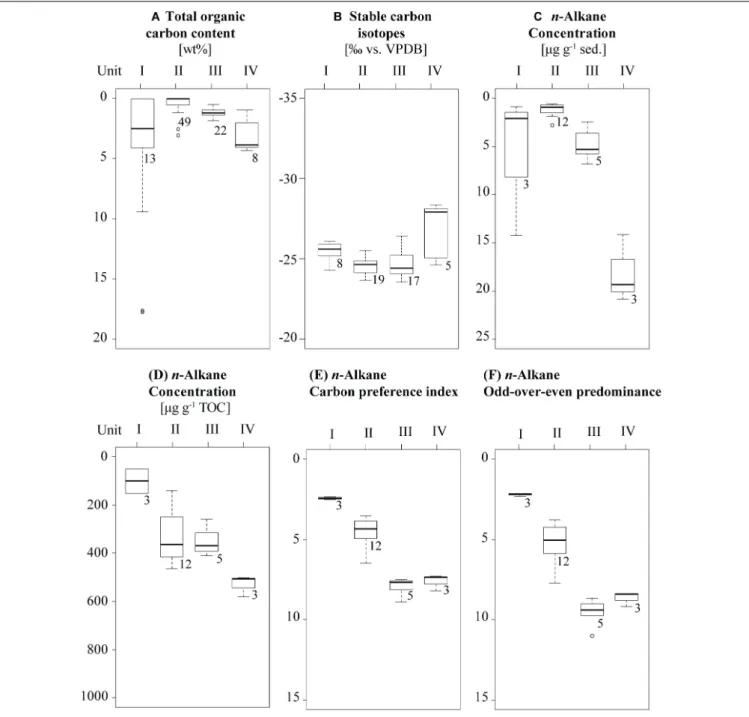
The transport and input of allochthonous organic material (large organic remains and driftwood;Supplementary Figure 2) by the paleo-river also explains the high variability and the high values of TOC andn-alkane concentrations (g−1 sed.) in Unit I compared to Unit II (Figures 8A,C). The CPI and OEP are lowest in Unit I (median: 2.5 and 2.2) and significantly lower than in Unit II (p < 0.01 and p < 0.05, respectively;
Figures 8E,F), which reflects the strong OM degradation before and during the transport. The organic-rich woody layers in Unit I most likely did not originate from in situ growing trees, but are considered an accumulation of fluvial transported driftwood material from further south.
Then-alkane composition is substantially different in Unit I compared to the units above, as can be seen in the proportion of n-C23,n-C27 andn-C29 andn-C31 (Supplementary Figure 4).
Unit I is enriched in n-C23 and has the lowest concentration of n-C27 + n-C29 and n-C31. The relative abundance of the shorter chainsn-C23andn-C25are highest in Unit I (Figure 6).
Furthermore, the Paq, representing aquatic OM contents, is highest (>0.6) and the Pwax, representing terrestrial OM, lowest (∼0.5) (Figure 7) in Unit I compared to the other units. Also, the ACL23−33, indicating the main focus of then-alkane distribution, is lowest (∼26.7) in this unit (Figure 5C). The tendency of long chain n-alkanes with lower carbon numbers point to the presence of OM from submerged or floating macrophytes (Ficken et al., 2000), which fits to an aquatic environment in a fluvial regime.
Unit II – Yedoma Deposition in Wetland Landscapes Dominated by Low-Centered Polygons
In the finer, thawed sediments of Unit II (Supplementary Figure 1), four of the radiocarbon ages were infinite (Figure 2A).
Age reversals could point to either reworked sediments or the incorporation of older organic matter. However, in Yedoma sediments, reworking of sediments is not usual due to the syngenetic freezing upon sedimentation. Soil movement as a result of cryoturbation is often restricted to tens of centimeter (Kaiser et al., 2007), while larger cryoturbation patterns sometimes are observed in particular settings. Reworking after in situ thawing of the sediments in the talik can happen due to volume loss after melting of ice. Such partial reworking of Yedoma upon thaw underneath lakes was previously described byFarquharson et al. (2016). However, there are no substantial differences in biogeochemical, hydrochemical and n-alkane parameters between samples with finite and infinite ages. Also, the incorporation of allochthonous ancient OM in Yedoma deposits is common (Vasil’chuk and Vasil’chuk, 2017;Jongejans et al., 2018) and hence the most likely explanation of the age reversals in this unit.
The sediments in Unit II are generally OC poor (median TOC:
0.6 wt% and 18 samples with TOC < 0.1 wt%; Figure 2B).
The low TOC content of the sediments likely results from a combination of OM poor deposition as well as partial OM decomposition after thawing of the sediments. The relatively low CPI and OEP (median: 4.3 and 5.0) reveal partly degraded OM.
The changes in n-alkane distribution (Supplementary Figure 3) and relativen-alkane concentration (Figure 6) over
FIGURE 8 |Box-whisker plots of biogeochemical and biomarker parameters of Goltsovoye Lake sediment core PG2412.(A)Total organic carbon content,(B) stable carbon isotopes,(C)n-alkane concentration per g sed.,(D)n-alkane concentration per g TOC,(E)n-alkane carbon preference index, and(F)n-alkane odd-over-even predominance. Samples sorted according ton-alkane clustering. Box-whisker plots according to Tukey with outliers outside of 1.5 interquartile range (IQR). IQR = Q3-Q1, range between upper and lower quartiles. Numbers denote sample count.
depth indicates different OM sources. A lower Paq (0.4–0.5) and higher Pwax (0.6–0.7) compared to Unit I (Figure 7) and slightly increased ACL23−33 values (Figure 5C) indicate the presence of emergent macrophytes. The relative large proportion of n-C23 and n-C25 in Unit I and II (Figure 6) is often found in Sphagnum mosses (Ficken et al., 1998;
Bingham et al., 2010; Bush and McInerney, 2013). The presence of moss points to wet conditions and thus, these findings indicate a wet environment with shallow-water
plant species. Therefore, we interpret this unit as a low- centered polygon environment, whereby water accumulates in the centers of the polygons (Liljedahl et al., 2016).
The Yedoma deposition in Unit II could correspond to the relatively wetter conditions of the Kargin Interstadial (Schirrmeister et al., 2002b).
In their study of methane emissions from low-center polygons in the Lena Delta, Kutzbach et al. (2004) found that the amount of methane released relied heavily on the microrelief
fenvs-08-00118 July 18, 2020 Time: 19:19 # 12
Jongejans et al. Biomarkers in Thawed Permafrost
of the polygons. Small changes in microrelief led to different hydrologic conditions, thereby influencing the aeration status, OM content and vegetation cover. Also, the water table relative to the roots influences the aeration status. Especially vascular plants can form major pathway for methane transport into the atmosphere. The wetland conditions of the low-centered polygon environment of Unit II probably has led to substantial methane emission in the past.
Unit III/Unit A – Yedoma Deposition Under Cold-Dry Conditions During the Late Weichselian
Unit III of the long sediment core corresponds to Unit A of the short core. Unit III contains one infinite age (at 1559 cm;
Figure 3) and the dated sample at 1070 cm, which gained a late Pleistocene (MIS 2) age (21.39±0.27 cal ka BP) is older than the general radiocarbon age trend, indicating the presence of reworked or eroded material in this sample. Unit A was deposited during the same period. The age difference between the bulk sediment and the picked plant remains in the short core points to a considerable amount of reworked particulate carbon from the surrounding environment.
The biogeochemical parameters are similar for Units III (median TOC: 1.15 wt%, median δ13C: −24.6h vs. VPDB;
Figure 2) and Unit A (median TOC: 1.7 wt%, median δ13C:
−25.0h vs. VPDB; Figure 3). The multimodal grain size distribution of Unit III (Supplementary Figure 1) suggests that multiple transport, accumulation and re-sedimentation processes were involved in the formation, which is in agreement with previous studies of Yedoma deposits (Schirrmeister et al., 2008b;
Strauss et al., 2012).
The lower part of Unit III is dominated by n-C27 and n-C29 and the upper part (at 1158 and 1070 cm) by n-C31 suggesting a transition to a grass/herb dominated environment (Supplementary Figure 3 and Figure 6) (Zech et al., 2009;
Schäfer et al., 2016). In this interval, also the ACL23−33is shifted to the highest values (Figure 5C). The Paq proxy shows the lowest value (below 0.34) and the Pwax the highest (above 0.75) (Figure 7). These findings point to a less aquatic and drier environment, which could correspond to the cold and dry steppe- like tundra that characterized the late Weichselian and the Last Glacial Maximum. This is in agreement with paleo-ecological data from the Mamontovy Khayata Yedoma cliff at the east coast of Bykovsky Peninsula from this period (Schirrmeister et al., 2002b). The TOC andn-alkane concentration (g−1 sed.) are significantly higher than in the unit below (p < 0.01) (Figures 8A,C). The CPI and OEP show maxima at the top of Unit III (median: 7.7 and 9.4;Figures 8E,F), indicating that this material shows a low level of degradation.
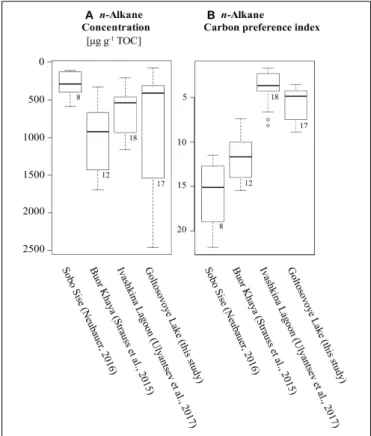
Few other studies focus onn-alkane concentrations in Siberian Yedoma sediments. The Yedoma sediments from this study (Unit II and III; 138–2455µg g−1TOC) haven-alkane concentrations comparable to the data from other studied Yedoma deposits in the Ivashkina Lagoon (267–1199 µg g−1 TOC) (Ulyantsev et al., 2017), on the Buor Khaya Peninsula (387–1715 µg g−1 TOC) (Strauss et al., 2015) and at the cliff of Sobo Sise in the Lena Delta (176–639 µg g−1 TOC) (Neubauer, 2016) (Figure 9A).
FIGURE 9 |Box-whisker plots of biomarker parameters from Siberian Yedoma studies.(A)n-Alkane concentration and(B)n-alkane carbon preference index. Box-whisker plots according to Tukey with outliers outside of 1.5 IQR. Numbers denote sample count.
Unit IV/Unit B – Holocene Thermokarst Lake Formation and Lacustrine Sedimentation
Unit IV of the long sediment core corresponds to Unit B of the short core. Unit B1 consists of a peat layer (Figure 3). Likely, this basal peaty layer formed during a wetland phase prior to the lake phase and therefore represents the transition to a thermokarst lake. The thickness of the peaty layer of Unit B1 (35 cm) suggests an extended wetland phase. Similar to other young thermokarst lakes (Kessler et al., 2012; Walter Anthony et al., 2018), talik growth and expansion into the previously deposited late Pleistocene Yedoma deposits certainly thawed the Yedoma OM, resulting in high methane production also underneath Goltsovoye Lake. With subsequent lake basin deepening due to subsidence of the thawing ice-rich permafrost, contemporary lake mud containing in situ produced OM and reworked old OC from the surrounding slopes accumulated, similarly to other thermokarst lakes in northern Siberia (Biskaborn et al., 2013b;
Schleusner et al., 2015).
The radiocarbon age of the peat layer (848 cm depth) is 8 ± 0.05 cal ka BP (Figure 3) and probably indicates that thermokarst lake formation started around 8000 years BP. The total thaw depth (talik depth∼32 m, altitude difference between lake and Yedoma uplands∼20 m) of∼52 m is relatively shallow for 8000 years of thermokarst development (M. Angelopoulos, personal communication, 2020). Previous talik modeling studies
of Alaskan thermokarst lakes showed faster talik growth rates for lakes in North America (e.g., Ling and Zhang, 2003; West and Plug, 2008; Kessler et al., 2012; Creighton et al., 2018).
However, talik growth could be slowed by characteristics of Siberian Yedoma, such as its higher ice volume in these sediments or the presence of bedfast ice during an extended shallow lake phase (<2 m).
In the long core, the transition from a dry and cold, grass- dominated landscape to a thermokarst lake lies between Unit III and Unit IV. The biogeochemical parameters of Unit IV (median TOC: 3.9 wt%,δ13C:−28.2hvs. VPDB;Figure 2) are very similar to Unit B (median TOC: 4.2 wt%, median δ13C:
−28.6hvs. VPDB;Figure 3). We found substantial differences between Unit III and IV for the TOC (p<0.01),δ13C (p<0.05) and then-alkane concentration (p<0.05) (Figure 8). Also, the TOC and stable carbon isotope ratio are significantly different between Unit A and B in the short core (p < 0.01). The sediments of Unit IV have a higher TOC compared to the thawed Yedoma sediments, which is characteristic for lake sediments with input of lake primary production (Walter Anthony et al., 2014; Jongejans et al., 2018). This is also suggested by the relatively high CPI and OEP in Unit IV (median: 7.3 and 8.4) compared to the lower units.
The dominating n-alkane chain in Unit IV is n-C27
(Supplementary Figure 3). The ACL,n-alkane ratio, Pwax, CPI and OEP are lower in Unit IV compared to Unit III (Figure 8) and Paq is partly a bit higher. The OM in this unit is likely a mixture derived from primary production in the thermokarst lake and from thawing permafrost surrounding the lake. As found in other thermokarst lake systems, the lake primary productivity is largely influenced by local thermal erosion, surrounding depositional characteristics and drainage processes strongly affecting hydrochemistry and water level (e.g.,Biskaborn et al., 2013a;Lenz et al., 2016).
Organic Matter Degradation
The state of OM degradability of Yedoma and other deposits underneath Goltsovoye Lake can be assessed with then-alkane proxies. In thermokarst-affected Yedoma uplands, the previously undisturbed sediments thaw from the top downwards and therefore, the sediments closer to the surface are expected to have been exposed to thawed conditions for the longest time.
Intuitively, one would expect the most degraded OM in the top sediments and the least degraded OM in the bottom sediments of the core. However, based on the CPI and OEP parameters, we found an opposite trend with the furthest degraded OM in the deepest part of the core (Figures 5D,8E,F). As described above, the OM incorporated into the sediments underneath Goltsovoye Lake accumulated under different environmental conditions.
Both the OM origin and the depositional conditions have an effect on the CPI and OEP values. Different OM origin and composition lead to different starting values of the parameters for the deposited OM (see for comparisonFigure 9B) and different environmental conditions can lead to different degradation levels during deposition. Since the OEP and CPI, as well as then-alkane concentrations and the ACL, show stepwise changes from unit to unit, we interpret the CPI and OEP profiles to be still dominated
by the OM input and the degradation level of the time of deposition was largely preserved, rather than being overprinted by the thaw process underneath the thermokarst lake. Thus, the higher terrestrial character (highest Pwax) of the OM in Unit III might have caused the highest CPI and OEP values in this core interval, while high degradation of presumably reworked material in the fluvial deposits of Unit I might have led to the lowest values in this core sequence. Overall, the CPI and OEP values still indicate relatively less degraded OM material at least for the Units IV and III and partly also for Unit II.
Romankevich et al. (2017)andUlyantsev et al. (2017)studied n-alkane parameters of a 38-m-long sediment core from the Ivashkina Lagoon (Figures 9A,B), about 3 km east of the Goltsovoye Lake. They found alluvial sands in the bottom (38–22 m), containing highly altered OM (median CPI: 2.7) (Romankevich et al., 2017), which is in line with our findings.
In the Yedoma sediments overlying these sands (22–3 m), they distinguished changes in sediment and OM source, as well as burial conditions. In the middle part of the core (∼21–13 m), the OM was enriched inn-C29andn-C31, and intermediate bulk CPI values (median: 3.8) could point to microbial degradation. Less- degraded material was found in the upper 5 m of the sediment core. Generally, their interpretation corresponds to our findings.
Our n-alkane concentration does not differ significantly in the Ivashkina Yedoma deposits compared to the Goltsovoye Yedoma deposits. However, the OM in the Ivashkina deposits is further degraded (CPI:p<0.01,Figure 9B).
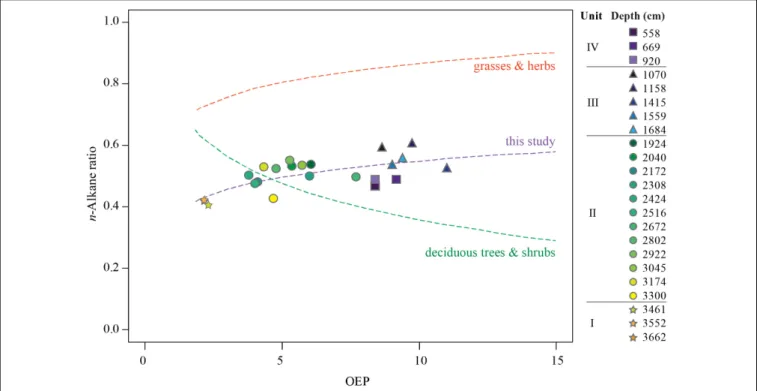
We plotted then-alkane ratio of our samples against the OEP (Figure 10). The samples clearly plot according to then-alkane cluster units with lowest OEP andn-alkane ratio in Unit I and maxima in Unit III.Schäfer et al. (2016)calculated degradation lines for grasses and herbs (orange dashed line) and for deciduous trees and shrubs (green dashed line) based on the data from their study in Central Europe and that of Zech et al. (2013) of eastern Germany. The degradation lines are based on (1) the degradation of the organic material, which is indicated by the OEP, and (2) the vegetation type, which is indicated by the n-alkane ratio. We fitted a logarithmic function to the data of this study (purple dashed line). From this, we argue that the OM in our study contains a mixture of long and mid-chainn-alkanes.
Due to the lack of typical deciduous trees and shrubs on the Bykovsky Peninsula, the presence of then-C27alkanes has to be explained by a different source. Using this endmember model is a first-order approximation to decipher a general pattern. First, one cannot assume a similar plant composition in Arctic regions compared to temperate regions. Second, some plant genera such asArtemisiaorSphagnum, have been found to have a dominance of the n-C29 alkane, thereby ‘mimicking’ deciduous trees and shrubs (Ficken et al., 1998;Struck et al., 2019). Third, lake aquatic organisms can contribute to mid-chain alkanes (n-C21ton-C27), which also leads to the overestimation of the presence of trees and shrubs (Ficken et al., 2000). Finally, samples with poorly preserved OM (low OEP values) can be difficult to interpret, as the degradation signal may have altered the n-alkane patterns (Struck et al., 2018). Even though this endmember model does not seem to reflect the OM source patterns in our samples, it does show a mixed character of the OM. Furthermore, this is
fenvs-08-00118 July 18, 2020 Time: 19:19 # 14
Jongejans et al. Biomarkers in Thawed Permafrost
FIGURE 10 |n-Alkane endmember model of Goltsovoye Lake sediment core PG2412. Degradation line for grasses and herbs [dashed orange;
y= 0.09*ln(OEP) + 0.66] and deciduous trees and shrubs [dashed green;y= 0.17*ln(OEP) + 0.75] afterZech et al. (2013)andSchäfer et al. (2016). Fitted line for this study [dashed purple;y= 0.08*ln(OEP) + 0.37].n-Alkane ratio: (n-C31+n-C33)/(n-C27+n-C31+n-C33). Unit I: orange stars, Unit II: green circles, Unit III: blue triangles, Unit IV: purple squares.
the first time this endmember model has been applied to Arctic sediments samples. More calibrations studies should be carried out to test this promising method for OM characterization studies in Arctic sediments.
In our study, the frozen fluvial sediments below the thawed Yedoma deposits had higher TOC values than in the thawed Yedoma, but this OM at the very bottom of the core also showed a higher level of degradation. The TOC content of the thawed Yedoma deposits is relatively low (median TOC: 0.8 wt% and 22 samples with TOC below detection limit) compared to previous research of still frozen Yedoma on the Bykovsky Peninsula that reported TOC values of 1.2 to 14 wt% (e.g.,Schirrmeister et al., 2002a;Strauss et al., 2020). Furthermore, compared to Yedoma deposits on the Buor Khaya Peninsula and the Yedoma cliff of Sobo Sise (median CPI: 11.7 and 15.2, respectively), a degradation signal of the Yedoma OM is traceable (Figure 9B). As we have no information about the detailed OM characteristics of undisturbed Yedoma deposits of the study area, we argue that the OM signal of these thawed Yedoma deposits is a mixture of a source signal and a degradation signal of OM thaw and partial microbial decomposition after talik formation. Still, we find that for our biomarker proxies, the OM input signal exceeds the degradation signal in this study.
Continued thermokarst lake growth of Goltsovoye Lake will lead to further talik deepening and thus thawing of more sediments as well as erosion of surrounding sediments into the lake. Walter et al. (2006) showed that methane release at the lake margins accounted for the largest portion of methane
release from thermokarst lakes. As we took our sediment core from the deepest point of the lake, the sediments likely have been thawed the longest time for this lake, while sediments nearer to the shore would have been exposed to thaw only more recently. Our study highlights that thawed deposits underneath a thermokarst lake vary in the OM composition and degradability and that this is primarily a result of OM origin and depositional environment, and less of permafrost thaw history. To understand future responses of further permafrost thaw and to assess the greenhouse gas emission potential, more knowledge is needed about the OM characteristics of the permafrost deposits. A direct comparison of thawed and still frozen Yedoma OM from nearby sites would be useful to better understand the impacts of thaw and microbial decomposition. The applied study of n-alkanes proves to be very useful in identifying OM sources, level of degradation and assessment of the depositional environment.
Further research using other biogeochemical assessments such as those based on amino acids (Hutchings et al., 2019), Sphagnum-derived phenols (Abbott et al., 2013) and pectin-like polysaccharides as well as C/N burial profiles (Schellekens et al., 2015) would also be valuable.
CONCLUSION
Our study of OM degradation in thermokarst-affected permafrost sediments in an ice-rich Yedoma permafrost landscape relied on a unique set of two drilling cores from beneath a thermokarst
lake in northeastern Siberia. Using n-alkane indices, we were able to distinguish four depositional units for the frozen and thawed sediments underneath Goltsovoye Lake on Bykovsky Peninsula. The lowest sediments (36.6-33 m) are of fluvial origin and were deposited prior to Yedoma formation. Their OM is characterized by a high degradation level and a relatively large share of aquatic OM (e.g., macrophytes). Yedoma formation started in a relatively wet, low-centered polygon landscape (33-18 m) with low amounts of but largely less degraded OM. Subsequently, n-alkane indices indicate a transition to a drier environment during the peak period of the Last Glacial Maximum (18-10 m) that was partly grass dominated (12 to 10 m). Furthermore, the OM in this sediment interval shows a low level of degradation. In the middle Holocene, a thermokarst lake formed and deposited lacustrine sediments (10-5.1 m), accompanied by talik formation that subsequently thawed the previously accumulated ice-rich Yedoma deposits. These lake sediments exhibit a higher TOC and n-alkane concentrations compared to the Yedoma sediments below.
Both the Yedoma deposits and the fluvial deposits contain old allochthonous OM. Moreover, using the n-alkane endmember model, we found a mixed input of the OM in all units. In the thawed Yedoma sediments, less OC was found compared to frozen Yedoma deposits reported elsewhere, suggesting a combination of OC poor deposition and partial mobilization of OC and release as methane from the thermokarst lake talik.
Higher OC contents were found in the frozen fluvial sediments below the Yedoma deposits. However, using the n-alkane parameters, we found a trend toward increasingly degraded OM in these sediments in the bottom of the core. Overall, then-alkane proxies suggest that the input signal of the OM still exceeds the degradation signal from thaw underneath the lake and that these parameters can still provide valuable information on the origin, degradation level and deposition conditions of the deposited OM.
DATA AVAILABILITY STATEMENT
All datasets generated for this study are available on PANGAEA.
AUTHOR CONTRIBUTIONS
JS, GG, and MG developed the overall coring plans for the Bykovsky Peninsula field campaign. JS, MG, GM, LS, BB, and
GG conducted the field work. LJ and JS developed the study design for biomarker analysis of the core. LJ and BB performed the laboratory analyses and led the data interpretation for the long (PG2412) and short (PG2420) sediment cores, respectively.
All co-authors contributed with their specific expertise to data interpretation and provided feedback to the manuscript. LJ led the writing of the manuscript.
FUNDING
LJ was funded by a doctoral stipend from the German Federal Environmental Foundation (DBU). This study was carried out within the ERC Project PETA-CARB (#338335) and a NERC-BMBF grant (project CACOON, grant no. 03F0806A).
MG and GM were funded by the Russian Foundation for Basic Research (#18-05-70091 and #18-45-140057). The Alfred Wegener Institute Helmholtz Centre for Polar and Marine Research (AWI) and the Germany Research Centre for Geosciences (GFZ) provided funding for the expedition.
ACKNOWLEDGMENTS
We thank the Hydrobase Tiksi, Arctica GeoZentr, Stanislav Ostreldin, Waldemar Schneider, and Sergey Pravkin for their logistic contribution to the field expedition Bykovsky 2017. We thank Dirk Wagner (GFZ) for supporting the expedition. We thank the MICADAS Team at AWI Bremerhaven for dating the radiocarbon samples. We thank Paul Overduin for discussing the hydrochemical results and for providing comments to the manuscript, and we thank Michael Angelopoulos for discussing the thermokarst lake talik results. We also thank Angélique Opitz, Dyke Scheidemann, Jonas Sernau, Mirjam Sens (AWI), Cornelia Karger, and Anke Sobotta (GFZ) for their support and assistance in the lab.
SUPPLEMENTARY MATERIAL
The Supplementary Material for this article can be found online at: https://www.frontiersin.org/articles/10.3389/fenvs.
2020.00118/full#supplementary-material
REFERENCES
Abbott, G. D., Swain, E. Y., Muhammad, A. B., Allton, K., Belyea, L. R., Laing, C. G., et al. (2013). Effect of water-table fluctuations on the degradation of Sphagnumphenols in surficial peats.Geochim. Cosmochim. Acta106, 177–191.
doi: 10.1016/j.gca.2012.12.013
Andersson, R. A., and Meyers, P. A. (2012). Effect of climate change on delivery and degradation of lipid biomarkers in a Holocene peat sequence in the Eastern European Russian Arctic.Org. Geochem.53, 63–72. doi: 10.1016/j.orggeochem.
2012.05.002
Bingham, E. M., McClymont, E. L., Väliranta, M., Mauquoy, D., Roberts, Z., Chambers, F. M., et al. (2010). Conservative composition of n-alkane biomarkers inSphagnumspecies: implications for palaeoclimate reconstruction
in ombrotrophic peat bogs. Org. Geochem. 41, 214–220. doi: 10.1016/j.
orggeochem.2009.06.010
Biskaborn, B. K., Herzschuh, U., Bolshiyanov, D., Savelieva, L., Zibulski, R., and Diekmann, B. (2013a). Late Holocene thermokarst variability inferred from diatoms in a lake sediment record from the Lena Delta, Siberian Arctic. J. Paleolimnol. 49, 155–170. doi: 10.1007/s10933-012-96 50-1
Biskaborn, B. K., Herzschuh, U., Bolshiyanov, D. Y., Schwamborn, G., and Diekmann, B. (2013b). Thermokarst processes and depositional events in a tundra lake, northeastern Siberia.Permafr. Periglac. Process.24, 160–174. doi:
10.1002/ppp.1769
Biskaborn, B. K., and Sens, M. (2020).Biogeochemical And Radiocarbon Data Of Sediment Core PG2420. Bykovsky Peninsula: Great Lake Publishing.