Research Collection
Working Paper
Microbial lipid signatures in Arctic deltaic sediments - insights into methane cycling and climate variability
Author(s):
Lattaud, Julie; De Jonge, Cindy; Pearson, Ann; Elling, Felix J.; Eglinton, Timothy I.
Publication Date:
2020-10-24 Permanent Link:
https://doi.org/10.3929/ethz-b-000450874
Originally published in:
EarthArXiv , http://doi.org/10.31223/X5B01W
Rights / License:
Creative Commons Attribution 4.0 International
This page was generated automatically upon download from the ETH Zurich Research Collection. For more information please consult the Terms of use.
This manuscript is a preprint and has not been peer-reviewed. Please feel free to contact any of the 1
authors; we welcome feedback 2
Microbial lipid signatures in Arctic deltaic sediments - insights into
3
methane cycling and climate variability
4
Julie Lattaud1*, Cindy De Jonge1, Ann Pearson2, Felix J. Elling2, Timothy I. Eglinton1
5
6
1Biogeosciences Group, ETH Zurich, Sonneggstrasse 5, Zurich, Switzerland
7
2Department of Earth and Planetary Sciences,Harvard University, Cambridge, MA 02138,
8
USA
9
10
*Correspondance:
11
Julie Lattaud
12
jlattaud@ethz.ch
13 14
Abstract.
15
Glycerol Dialkyl Glycerol Tetraethers (GDGTs) are ubiquitous biomolecules whose structural
16
diversity or isotopic composition is increasingly used to reconstruct environmental changes
17
such as air temperatures or pCO2. Isoprenoid GDGTs, in particular GDGT-0, are
18
biosynthesized by a large range of Archaea. To assess the potential of GDGT-0 as a tracer of
19
past methane cycle variations, three sediment cores from the Mackenzie River Delta have been
20
studied for iGDGT and diploptene distribution and stable carbon signature. The absence of
21
crenarchaeol, high GDGT-0 vs crenarchaeol ratio, and 13C-enriched carbon signature of
22
GDGT-0 indicate production by acetoclastic methanogens as well as heterotrophic Archaea.
23
The oxidation of methane seems to be dominated by bacteria as indicated by the high
24
abundance of 13C-depleted diploptene. Branched GDGTs, thought to be produced by
25
heterotrophic bacteria, are dominated by hexa- and penta-methylated 5- and 6-methyl
26
compounds. The presence of 5,6-methyl isomer IIIa’’ points towards in situ production of
27
brGDGTs, with only a minor input from soil branched GDGT brought by the Mackenzie River.
28
Carbon isotopic compositions of brGDGTs are in agreement with heterotrophic producers,
29
likely living during summer. The reconstructed temperatures using a global lake calibration
30
reflect recorded summer air temperature (± 2.14 °C) during the last 60 years, and further
31
highlight the absence of warming in summer in this region during the last 200 years. Oxygen
32
availability and connection time to the Mackenzie River also seem to control the distribution
33
of branched GDGT with an increase in 6-methyl and 5,6-methyl isomers with increased period
34
of anoxia.
35
Keywords: GDGT, methane cycle, Mackenzie River, temperature reconstruction, carbon
36
isotopes
37 38
1 Introduction
39
The Mackenzie delta region in the Canadian Arctic is highly sensitive to climate change, and
40
has already recorded a warming of 6 °C in mean annual temperature since 1970 (based on
41
Environment and Climate Change Canada). This warming exclusively manifests itself in winter
42
temperature, whereas the summer temperature has been stable (based on Environment and
43
Climate Change Canada). The Mackenzie River delta is characterized by thousands of small
44
shallow lakes (mean depths from about 0.5 m to 4.5 m) (Emmerton et al., 2007) that are frozen
45
from late September to early June (Droppo et al., 1998). These lakes are connected with the
46
main river channels to different degrees and have been classified into three categories by
47
Lesack and Marsh (2007): “No closure” lakes are continuously linked to the river, “low
48
closure” lakes have a connection that occurs at least once a year during the freshet, and “high
49
closure lakes”, characterized by a higher levees, are only connected to the river during extreme
50
freshets, with recurrence intervals that may be only once per decade. Most inland water bodies
51
of the Mackenzie River delta are a net sink of carbon dioxide (CO2) and a source of methane
52
(CH4) (Tank et al., 2008). However, inland water bodies are highly sensitive to temperature
53
changes, as warming will strongly impact water column stratification, aquatic ecosystems as
54
well as the gas exchange dynamics of the lakes. To understand the impact of these arctic
55
wetlands on global greenhouse gas budgets, and project the long-term evolution of this
56
environment, constraining the effects of warming on aquatic ecosystems of the region is
57
essential.
58
Archaeal and bacterial membrane-spanning lipids, glycerol dialkyl glycerol tetraethers
59
(GDGTs) are ubiquitous biomarkers that are found in extreme environments such as
60
perennially frozen soils, e.g., Siberian permafrost (Kusch et al., 2019), and in surface lake
61
sediments of the Mackenzie delta (Peterse et al., 2014). Isoprenoid GDGTs (iGDGTs) are
62
biosynthesized by a wide range of Archaea, with some iGDGTs such as crenarchaeol and
63
crenarchaeol regioisomer having a narrow phylogenetic source, i.e., ammonia-oxidizing
64
Thaumarchaeota (Schouten et al., 2013). In contrast, GDGT-0 is found in many cultivated
65
strains of Archaea (Oger and Cario, 2013; Schouten et al., 2013; Villanueva et al., 2014; Elling
66
et al., 2017), but it is particularly abundant in methanogens and methanotrophs (Koga et al.,
67
1993; Pancost et al., 2001; Bauersachs et al., 2015; Sollai et al., 2019). In marine and freshwater
68
realms, GDGT-0 has been used as an indicator of the presence of methanotrophic and
69
methanogenic Archaea. Several ratios have been built to infer the emission of CH4 such as the
70
methane index (Zhang et al., 2011), or the relative abundance of GDGT-0 versus crenarchaeol
71
(Blaga et al., 2009). Carbon isotopic measurements of iGDGTs have also shed light on the
72
influence of Archaea on methane cycling in lacustrine and marine environments as the stable
73
carbon isotopic composition of lipids reflect the carbon source of the producer, and methane is
74
usually 13C-depleted (Pancost et al., 2000; Sinninghe Damsté et al., 2009a; Weber et al., 2015;
75
Colcord et al., 2017). Methyl-branched GDGTs (brGDGTs) are ubiquitous bacterial membrane
76
lipids that are abundant in soils (e.g., De Jonge et al., 2014a; Weijers et al., 2007) and lakes
77
(e.g., Blaga et al., 2009; Colcord et al., 2015; Dang et al., 2016; Foster et al., 2016; Russell et
78
al., 2018). In soils, they are inferred to be produced by members of the phylum Acidobacteria,
79
based on cultures (Sinninghe Damsté et al., 2014, 2018) and on their environmental distribution
80
(Weijers et al., 2010). In lakes, they are likely produced by multiple groups of bacteria (Weber
81
et al., 2018). The degree of methylation of the brGDGTs reflects an adaptation to temperature,
82
with higher fractional abundance of hexa- and pentamethylated GDGTs (GDGT-II and GDGT-
83
III) in colder soils (Weijers et al., 2007; Jonge et al., 2014; Colcord et al., 2015; Zink et al.,
84
2016), and permafrost soils dominated by GDGT-IIIa (Kusch et al., 2019). BrGDGTs can be
85
recovered from geological archives such as paleosoils or lacustrine sediments, but their dual
86
provenance in lake sediments can be problematic as the relative abundances of brGDGTs in
87
soils has been shown to differ from those in lake sediments under the same temperature (e.g.,
88
Martin et al., 2020; Tierney and Russell, 2009; Zink et al., 2016). The source of brGDGTs can
89
thus be inferred by investigating the distribution of the brGDGTs. In marine coastal
90
environments, three ratios have been developed: the weighted average number of cyclopentane
91
moieties and the degree of methylation of the brGDGTs (Sinninghe Damsté, 2016), the ratio
92
of GDGT-IIIa over GDGT-IIa (Xiao et al., 2016), and the BIT index (Hopmans et al., 2004).
93
In freshwater environments, only the ratio of GDGT-IIIa/GDGT-IIa has thus far been used to
94
assess the origin of brGDGTs, utilizing values for modern soils and lake sediments (Martin et
95
al., 2019). In addition, compound-specific 13C values (Weijers et al., 2007; Naeher et al., 2014a;
96
Colcord et al., 2017; Weber et al., 2018) have been proposed to as a means to distinguish lake-
97
or soil-derived sources through comparison with 13C values of bulk organic carbon (OC) and
98
other biomarkers. Once the provenance is determined, corresponding lacustrine or soil
99
calibration can be applied, with numerous studies constructing a local, region-specific
100
calibration using lake surface sediments or suspended particulate matter (SPM, e.g., Foster et
101
al., 2016; Pearson et al., 2011; Sun et al., 2011; Tierney et al., 2010; Zink et al., 2016) or other
102
proxies such as pollen (Dugerdil et al., 2020) or haptophyte biomarkers (Harning et al., 2020).
103
Alternatively, calibration based on large spatial scale variations (Loomis et al., 2012; Russell
104
et al., 2018) can be used. Soil-specific calibrations have also been constructed (De Jonge et al.,
105
2014b; Peterse et al., 2012; Watson et al., 2018), and have been found to yield reliable results
106
in temperate environments.
107
Peterse et al. (2014) determined that most of the brGDGTs in Mackenzie delta lake surface
108
sediments originated from in situ production within the lakes. This contrasted sharply with the
109
Mackenzie River where most of the brGDGTs originated from erosion and transport of soils
110
within the catchment. Here, we investigate three sediment cores retrieved from lakes in the
111
middle (MD-1 and MD-2) and upper delta (UD-4) that have previously been studied from a
112
sedimentological and biogeochemical perspective (n-alkanes and fatty acid biomarkers, bulk
113
OC 14C and 13C) (Lattaud et al. submitted). The core-tops of these lakes have previously been
114
examined by Vonk et al. (2015) as part of a study to assess sediment dispersal and deposition
115
patterns in the Mackenzie delta. Based on these prior investigations it was determined that low
116
closure lakes have the clear potential to record past climate changes. Here, we use brGDGTs
117
determine the provenance and assess climate signals recorded (last 200 yr) in one low closure
118
lake (UD-4) in comparison with a no closure (MD-2) and a high closure (MD-1) lake.
119
Furthermore, iGDGTs and their stable carbon isotopes are studied to investigate past methane
120
cycling in these lakes.
121 122
2 Material and methods
123
2.1 Study sites
124
The Mackenzie delta is located in the Canadian arctic, at latitudes above 67°N (Fig. 1), with a
125
subpolar drainage basin that lies primarily (~75%) within the continuous and discontinuous
126
permafrost zones. Within the central Mackenzie Delta (i.e., the area between Aklavik and
127
Inuvik), summers are cool and short, with ice-free conditions lasting from early June to late
128
September. The mean summer (June ‒ August) and winter (November ‒ February) air
129
temperature for Inuvik are 11.4 °C and -25.5 °C, respectively (based on Environment and
130
Climate Change Canada) with a mean annual (MAT) average of -9.2 °C. The MAT in the south
131
of the basin is much warmer, averaging 0.7 °C at Fort McMurray. The Mackenzie River flows
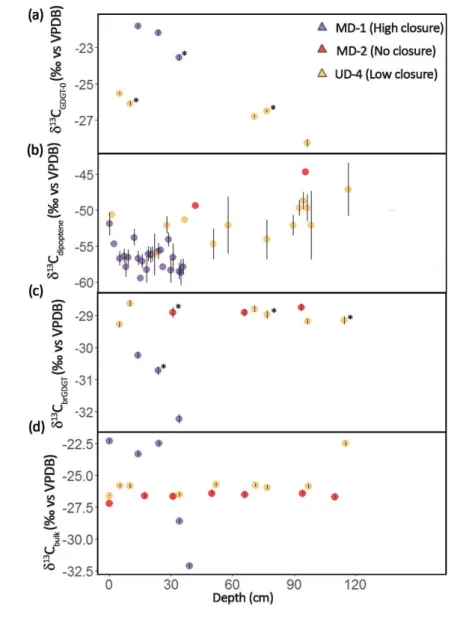
132
northward from areas of relative warmth toward frozen northern regions. It crosses several
133
large lakes such as Great Slave Lake and Great Bear Lake that act as efficient sediment traps
134
(Carson et al., 1998; Carrie et al., 2009), and consequently most of the sediment reaching the
135
Mackenzie delta originates north of these lakes. The freshet, i.e. spring flood, which removes
136
snow cover from terrestrial surfaces, warming the ground and accelerating active-layer
137
development (Mackay, 1963), accounts for 60% and 90% of annual water and sediment
138
discharge, respectively (Drenzek et al., 2007), and is responsible for seasonal inundation of
139
lakes within the delta.
140
Figure 1 (a) Localization of the Mackenzie delta lakes with (b) zoom of Inuvik area insert and
141
(c) diagram illustrating the degree of closure of the lakes.
142 143
Three representative lakes were chosen for the present study: MD-1, a high closure lake in the
144
middle delta with an area of ~ 5.9 ha and a mean depth of 0.74 m; UD-4, a low closure lake
145
from the upper part of the delta (surface area, ~ 12.5 ha; mean depth, 2.2 m), and MD-2, a no
146
closure lake close to Inuvik in the middle delta (surface area, ~ 700 ha; mean depth, 2.2 m)
147
(Lesack and Marsh, 2010; Vonk et al., 2015). These lakes have been previously studied for
148
their sedimentological properties (Lattaud et al., submitted) and have not always been in the
149
same connection state as now. Specifically, UD-4 was high closure before transitioning to low
150
closure before ca. 1890 C.E. (i.e., below 90 cm), while MD-2 was low closure before ca. 1928
151
C.E. (i.e., below 110 cm).
152
2.2 Methods
153
2.2.1 Lakes sampling
154
Mackenzie delta lake sediment cores were sampled in March 2009 with a push-corer (system
155
built in-house at the Geology and Geophysics department, Woods Hole Oceanographic
156
Institution, WHOI) as described by Vonk et al. (2015). Cores were shipped in cooled
157
conditions, split lengthwise and sliced every centimetre.
158
2.2.2 Lipid extraction and analysis
159
The sediments were freeze-dried and subsequently extracted with the EDGE system as
160
described in Lattaud et al. (submitted). Briefly, the total lipid extract was saponified, the neutral
161
fraction liquid-liquid extracted, and separated on a silica gel column into three fractions. The
162
polar fraction was filtered using a polytetrafluoroethylene 0.45 µm filter prior to analysis. As
163
GDGTs in the environment have predominantly glycosidic bounds, they are not cleaved to core
164
GDGTs by base hydrolysis (done in this study). Hence, the fraction of GDGTs analysed in this
165
study are mostly fossilized core GDGTs, plus a small fraction of the intact polar lipid GDGT
166
pool.
167
The GDGTs were analysed with high performance liquid chromatography (LC)/atmospheric
168
pressure chemical ionization–mass spectrometry (MS) on an Agilent 1260 Infinity series LC-
169
MS according to Hopmans et al. (2016). Selective ion monitoring of the [M + H]+ was used to
170
detect and quantify the different GDGTs, according to Huguet et al. (2006), except that a
171
similar response factor was assumed for the GDGTs and the internal standard.
172
Diploptene was quantified on a HP 7890A gas chromatograph (GC) equipped with a flame
173
ionization detector (FID), and a VF-1 MS capillary column (30 m × 0.25 mm, 0.25 μm film
174
thickness). The temperature program started with a 1 min hold time at 50 °C, followed by a
175
10 °C min-1 ramp to 320 °C and a 5 min hold time at 320 °C. Quantification was based on an
176
internal standard (C36 n-alkane) of known concentration.
177
2.2.3. GDGT carbon isotopic analysis
178
Before stable carbon isotope analysis, GDGTs from MD-2 and UD-4 were isolated from the
179
polar fraction using semi-preparative normal phase HPLC following the method of Gies et al.
180
(2020). Fractions were collected from 16 to 18 min for GDGT-0 and 36 to 48 min for the
181
brGDGTs.
182
GDGTs from MD-1 were purified using semi-preparative normal phase HPLC following the
183
method of Pearson et al. (2016).
184
Purity of the prepped fractions was assessed using HPLC flow injection analysis (FIA) relative
185
to a dilution series of the C46-GDGT standard (Huguet et al., 2006). 13C measurements of the
186
GDGT were performed at Harvard University as described in Pearson et al. (2016). In
187
summary, the GDGT fractions are purified by reverse phase (RP) HPLC to remove non-GDGT
188
material and the fractions containing the isolated GDGT (F2) and the minute before (F1) were
189
collected.
190
Values of δ13CGDGT are measured by Spooling Wire Microcombustion-IRMS (SWiM-IRMS;
191
Pearson et al., 2016; Sessions et al., 2005). The precision measurements was ± 0.2‰. The ratio
192
of F2/F1 indicates the level of background contamination in a sample with low ratio (< 2)
193
indicating possible contamination.
194 195
2.2.4. Diploptene carbon isotopic analysis
196
The carbon isotope composition of diploptene was measured in duplicate by Gas
197
Chromatography-isotope ratio mass spectrometry (GC-IRMS) on a Thermo Trace GC (1310)
198
coupled with a Thermo Delta-V plus system at the Climate Geology group at ETH Zurich. The
199
GC was equipped with a RTX-200 MS capillary column (60 m × 0.25 mm i.d., 0.25 μm film
200
thickness) and temperature program was as follows: ramp from 40 °C to 120 °C at 40 °C min-
201
1, followed by a 6 °C min-1 ramp to 300 °C and 12 min hold time at 320 °C. Duplicates were
202
measured when possible.
203
3. Results
204 205
3.1. GDGTs and diploptene distribution
206
3.1.1. iGDGT
207
The isoprenoid GDGTs are dominated by GDGT-0 (Fig. 2), especially in MD-1 (high closure)
208
where it accounts for 90 ± 2% of all iGDGTs. GDGT-0 comprises 49 ± 4% of iGDGTs in MD-
209
2 (no closure) and 80 ± 12% of iGDGTs in UD-4 (low closure). The total amount of iGDGT is
210
higher in MD-1 (18.5 ± 17.7 µg gTOC-1) followed by UD-4 (10.8 ± 7.2 µg gTOC-1)and MD-2
211
(6.8 ± 3.6 µg gTOC-1), largely due to the increased abundance in GDGT-0. Only trace amounts
212
of crenarchaeol and crenarchaeol isomer are detected in all lakes (0.01 ‒ 0.6 µg gTOC-1 in MD-
213
1, 0.01 ‒ 0.1 µg gTOC-1 for UD-4 and 0.1 ‒ 4 µg gTOC-1 for MD-2).
214
3.1.2. BrGDGTs
215
All sampled lakes have a similar distribution of brGDGT lipids (Fig. 2), with brGDGT-IIIa and
216
GDGT-IIIa’ as the most abundant components, followed by GDGT-IIa, GDGT-Ia and GDGT-
217
IIa’. In MD-2 lake sediments (no closure), hexamethylated, pentamethylated and
218
tetramethylated components represent 46 ± 2%, 38 ± 2% and 17 ± 1%, respectively, of all the
219
brGDGT (15 brGDGT are quantified, see appendix 1). Similar distributions are encountered in
220
the other lake sediments, with 47 ± 5%, 38 ± 3% and 16 ± 2% for UD-4 (low closure), and 43
221
± 2%, 40 ± 1% and 18 ± 1% for MD-1 (high closure) (hexa, penta and tetramethylated
222
compounds, respectively). Structural isomers of the hexamethylated compounds exhibit
223
different patterns among the lakes, with GDGT-IIIc X-methyl (structure not identified,
224
compound eluting between the GDGT-IIIc and GDGT-IIIc’, further called the IIIcX) present in
225
MD-2, while IIIa’’ and IIIcX are found in UD-4, and GDGT-IIIb X-methyl (structure not
226
identified, compound eluting between the GDGT-IIIb and GDGT-IIIb’, IIIbX) is present in
227
MD-1. The concentration of brGDGTs is similar between MD-1 and MD-2 but is more variable
228
(22.5 ± 21.5 µg gTOC-1 and 19.2 ± 10.4 µg gTOC-1, respectively) and higher in UD-4 (33.7 ± 29.0
229
µg gTOC-1).
230
231
Figure 2 GDGT composition in Mackenzie delta lakes (a) fractional abundance and (b) ternary
232
diagram of the hexa-, penta- and tetra-methylated branched GDGT in Mackenzie lakes in
233
comparison with a global lakes and soils dataset (Pearson et al., 2011 for lakes, Foster et al.
234
2016 for Antarctic lakes and De Jonge et al., 2014b for soils).
235 236
3.1.3. Diploptene
237
Diploptene (17β(H), 21β(H)-hop-22 (29)-ene) is detected at all depths in UD-4 (low closure)
238
and MD-1 (high closure), and at some depths in MD-2 (no closure). Its concentration is higher
239
in MD-1 and UD-4 than in MD-2 (110 ± 50 µg gTOC-1, 130 ± 80 µg gTOC-1 and 50 ± 20 µg gTOC- 240
1 respectively). The concentration of diploptene in MD-1 increases from the oldest part of the
241
record towards the top, reaching a maximum around 14 cm (200 µg gTOC-1). In UD-4 the
242
concentration is higher in the oldest part of the core, around 90 cm (reaching 340 µg gTOC-1)
243
before decreasing until 28 cm (lowest concentration 40 µg gTOC-1), and then increasing again
244
to the top of the core. Diploptene concentration in MD-2 is higher at the bottom of the core
245
(140 µg gTOC-1) then decreases and remains stable until the core top (average of 40 ± 20 µg
246
gTOC-1, n = 64).
247 248
3.2. Carbon isotopes
249
3.2.1. GDGT-0 and diploptene
250
The δ13C value of GDGT-0 is 13C-enriched compared with that of the brGDGT lipids, with
251
MD-1 (high closure) exhibiting higher δ13C values than UD-4 (low closure, -22.6 ± 0.2‰, n =
252
3 versus -26.2 ± 0.2‰, n = 6, Fig. 3). In MD-1, the δ13C value of GDGT-0 decreases with
253
increasing depth while it stayed constant for UD-4.
254
Most of MD-2 (no closure) samples are below detection limit for diploptene δ13C
255
measurements. When measurable, the δ13C value of diploptene is significantly lower than that
256
of the GDGTs (Fig. 3), in average -47.0 ± 3.3‰ in MD-2 (n = 2), -51.6 ± 2.5‰ in UD-4 (n =
257
13) and -56.5 ± 1.8‰ in MD-1 (n = 24). In MD-1 (high closure), diploptene is more 13C-
258
enriched at the top of the cores than deeper downcore, exhibiting a trend similar to the GDGTs.
259
In UD-4 (low closure), δ13C values of diploptene increase at the bottom of the core.
260
3.2.2. BrGDGTs
261
All branched GDGTs have been pooled for 13C measurements, with 3 cm resolution. MD-2 (no
262
closure) and UD-4 (low closure) have similar δ13C values of -29.0 ± 0.3‰ (Fig. 3c) (n = 9)
263
while MD-1 (high closure) is more 13C-depleted (-31.1 ± 0.2‰; n = 3). In MD-1, the δ13C value
264
of the brGDGTs decreases with increasing depth while it stayed constant with depth in the
265
other lakes (Fig. 3c).
266
267
Figure 3 Carbon stable isotope compositions of (a) GDGT-0, (b) diploptene (three samples
268
could not be run in duplicate and therefore do not have error bars), (c) brGDGT, and (d) bulk
269
TOC (Lattaud et al., submitted) in the Mackenzie delta lakes. Asterisks (*) indicate low F2/F1,
270
and therefore δ13CGDGT values influenced more strongly by background carbon.
271 272
4 Discussion
273
4.1. Origin of GDGTs in Mackenzie Lakes
274
4.1.1. iGDGT reflect in situ methane production
275
The distribution of the iGDGTs is dominated by GDGT-0 (Fig. 2), comprising more than 90%
276
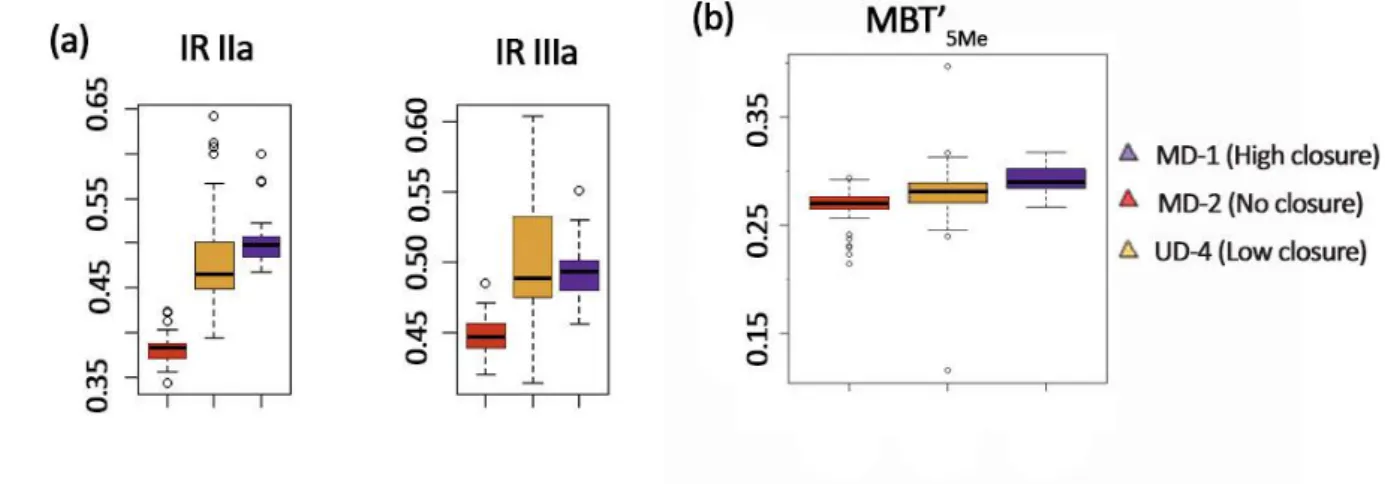
of all iGDGTs. Previous studies have shown that the number of cyclopentane rings in GDGTs
277
from surface sediments substantially increases with increasing lake temperature (Schouten et
278
al., 2002), hence the predominance of GDGT-0 is not a surprise in arctic lakes (MAT = -8.4 ±
279
1.7 °C, 1960 ‒ 2020, Inuvik weather station). However, the absence of crenarchaeol is
280
surprising, and the observed distribution differs from those of permafrost samples of Kusch et
281
al. (2019), and more closely resembles those found in the deep anoxic regions of Lake Chala,
282
Africa (Sinninghe Damsté et al., 2009b) and Lake Rotsee, Switzerland (Naeher et al., 2014a).
283
GDGT-0 can be produced by a wide range of Archaea; Thaumarchaeota (Oger and Cario, 2013;
284
Schouten et al., 2013; Villanueva et al., 2014; Elling et al., 2017), thermophilic and mesophilic
285
Crenarchaeota, as well as in methanogens and Euryarchaeota that mediate the anaerobic
286
oxidation of methane (Koga et al., 1993; Pancost et al., 2001; Bauersachs et al., 2015). The
287
near absence of crenarchaeol in addition to the low concentration of GDGT-1 to 3 points toward
288
a precursor other than the lacustrine Thaumarchaeota, and methanogenic or methanotrophic
289
Archaea are a likely predominant source of GDGT-0 in Mackenzie delta lakes.
290
Blaga et al. (2009) proposed the ratio of GDGT-0 over crenarchaeol is an indicator of
291
methanogenesis in lakes. A value above 2 was suggested as indicative of the presence of
292
anaerobic methanogenesis, although few studies clearly demonstrated a strong correlation
293
(Naeher et al., 2014a). In the Mackenzie delta, MD-1 (high closure) has an average GDGT-
294
0/crenarchaeol ratio of 152 ± 51 while the ratios for UD-4 (low closure) and MD-2 (no closure)
295
are of 17 ± 8 and < 1.6 ± 0.3, respectively (Fig. 5). These ratios for the high closure and low
296
closure lakes are much higher than those reported by Blaga et al. (2009) in European lakes, but
297
similar to Pan et al. (2016) in marine hydrothermal deposits and to some lakes such as Lake
298
Honghu (China) with low oxygen content (Dang et al., 2016) and eutrophic Lake Rotsee
299
(Switzerland) (Naeher et al., 2014b). The low values in MD-2 could indicate limited
300
methanogenesis. Biomass from high emergent macrophyte productivity in Mackenzie delta
301
lakes during summer is rapidly oxidized under the ice during winter, creating anoxia. The
302
protracted interval of water column anoxia as well as the abundance of CO2(aq) ‒ due to high
303
organic matter input and freezing of the lake ‒ create an ideal habitat for anaerobic
304
methanogens in the water column or sediment-water interface. In early summer, when the lake
305
water column is oxic, these organisms could persist deeper in the sediment. Their 16S rRNA
306
genes have been detected in the water column of some lakes of the delta (Bergstresser, 2018)
307
and in the water column and sediments of other Arctic thermokarst lakes (Heslop et al., 2015;
308
Matheus Carnevali et al., 2015; Crevecoeur et al., 2016). However, Bergstresser (2018) only
309
detect few reads (one OTU linked to methanogenic Archaea), which they attributed to the use
310
of a non-specific 16S rRNA primer.
311
Several other cyclic iGDGT ratios have been defined in order to trace the presence of
312
methanotrophic archaea (Blaga et al., 2009; Zhang et al., 2011), i.e., GDGT-2 over
313
crenarchaeol and GDGT-1, -2, -3 over crenarchaeol (methane index), respectively. For the first
314
ratio, values > 0.2 points toward methanotrophy (Blaga et al., 2009), while for the methane
315
index, values > 0.5 indicate significant production of iGDGT by methanotrophic Euryarchaeota
316
(Zhang et al., 2011). For the Mackenzie delta, GDGT-2/Crenarchaeol ratios exceed the
317
threshold value for methanotrophy for MD-1 (high closure) and UD-4 (low closure) (0.7 ± 0.3
318
and 0.3 ± 0.1, respectively), while MD-2 (no closure) fall below this threshold (Fig. 5). The
319
methane index is relatively high in the high closure lake sediments of the Mackenzie delta
320
(MD-1, 0.7 ± 0.1) in comparison with those from low and no closure lakes (MD-2 0.3 ± 0.1
321
and UD-4 0.4 ± 0.1, respectively). Both ratios thus indicate the potential presence of
322
methanotrophic Archaea in MD-1 (high closure). The anaerobic oxidation of methane is
323
characterised by a low energy yield (Nauhaus et al., 2002) and, so far, three communities of
324
Euryarchaeota (ANME-1, -2, -3) were identified in consortium with sulphate-reducing bacteria
325
(SRB) that provide electron acceptor (SO42-). But other oxidants (e.g., Fe(III), Mn(IV)) are also
326
plausible (e.g., Beal et al., 2009). In high closure lakes, iron and sulfate concentrations are
327
elevated (Geeves, 2019), and anoxia and high methane concentrations could favor the presence
328
of methanotrophic Archaea.
329
330
Figure 4 GDGT ratios (a) GDGT-0/crenarchaeol, (b) GDGT-2/crenarchaeol in Mackenzie
331
delta lakes.
332 333
We measured the carbon isotopic composition of GDGT-0 in order to assess the role of Archaea
334
in the methane cycle in the Mackenzie River delta lakes. In low closure (UD-4) and high
335
closure (MD-1) lakes, where GDGT-0 was present in sufficient abundance for isotopic
336
measurement, δ13CGDGT-0 values are 13C-enriched compared to brGDGTs, with higher values
337
for MD-1 (-22.5 ± 0.2‰) than for UD-4 (-26.6 ± 0.3‰). These compositions are similar to
338
those of the δ13CTOC (-22.7 ± 0.3‰ and -26.0 ± 0.4‰, respectively), which could point towards
339
the production by heterotrophic Archaea in the lakes although the fractionation is very small.
340
GDGT-0 could also be produced by acetoclastic or hydrogenotrophic methanogenic Archaea,
341
utilizing acetate or dissolved CO2 as their carbon source for biosynthesis. In the latter, lipid
342
δ13C values would reflect that of lake water CO2(aq) after accounting for fractionation during
343
carbon fixation and biosynthesis. Although δ13CCO2(aq) values are not directly available for the
344
lakes examined in this study, they can be calculated from δ13C values of dissolved inorganic
345
carbon (DIC) (assuming about a 10‰ fractionation between DIC and CO2(aq) at 10 °C, Mook
346
et al., 1974). During spring to summer there is a decrease in δ13CDIC values due to the decrease
347
in pCO2 (-7.6‰ in June to -13‰ in August for high closure lakes, Tank, 2009), which would
348
yield corresponding δ13CCO2(aq) values of ~ -17 to -23‰. However, most methanogens are
349
expected to be productive in winter (see above) when high pCO2 (due to under-ice
350
accumulation following the release by permafrost) is expected and the δ13CCO2(aq) likely 13C-
351
enriched compared to summer. Unfortunately, the δ13CCO2(aq) or δ13CDIC values of the winter
352
lake water are not known. Methanogenesis commonly occurs in anoxic parts of lake sediments
353
and overlying waters, where the dominant mechanism in freshwater environments is via the
354
acetoclastic pathway (Whiticar et al., 1986). The latter results in a -2 to -6‰ fractionation in
355
the produced lipids, while hydrogenotrophic methanogenesis, which has also been reported in
356
cold environments, results in higher fractionation (Δsubstrate–lipid = -11 to -20‰, Londry et al.,
357
2008; Penning et al., 2006; Valentine et al., 2004; Whiticar et al., 1986). Furthermore,
358
methylotrophic methanogenesis would result in an even higher fractionation (Δsubstrate–lipid = -
359
33 to -46‰). but is rarely reported in freshwater environments due to the lower availability of
360
these substrates. 13C-CH4 measurements in pore-waters of surface sediment of high closure
361
lakes suggest dominant hydrogenotrophic methanogenesis with a minor contribution from the
362
acetoclastic pathway (-80 to -50‰, Geeves, 2019), while 16S rRNA sequencing suggests a
363
larger gene copies of Archaea involved in acetoclastic methanogenesis (Bergstresser, 2018).
364
Furthermore, Bergstresser (2018) reported the presence of Methanosaeta (methanogenic
365
Archaea) in the top sediment (0 ‒ 2 cm) of the Mackenzie delta lakes in winter and early spring
366
and the possibility for aerobic methanogenesis to occur in the water-column of high closure
367
lakes.
368
Our δ13CGDGT-0 values suggest a possible contribution of GDGT-0 by non-methanogenic
369
Archaea but are also compatible with a significant contribution by acetoclastic methanogens.
370
The difference in δ13CGDGT-0 values between the lakes likely reflects differences in δ13CCO2(aq) 371
due to contrasting pCO2 (higher for MD-1 and high closure lakes in general, Lesack et al.,
372
1998; Squires et al., 2009).
373
No methanotrophic Archaea were reported by Bergstresser (2018). This might be due to the
374
primer used in the study, but this finding is in agreement with the carbon isotopic composition
375
of GDGT-0 (Fig. 3), which is not significantly 13C-depleted compared to the δ13CCH4.
376
Anaerobic methanotrophy is rare in freshwater environments due to low sulfate (i.e., electron
377
acceptor) concentrations. In contrast, Bergstresser (2018) detected large amounts of bacteria
378
known to mediate the aerobic oxidation of methane (i.e., MOB), which are especially abundant
379
during winter. MOB produce hopanoids that are depleted in 13C compared to lipids produced
380
by photosynthetic autotrophs (e.g., sterols, n-alkanes; Pancost et al., 2000). In agreement with
381
this observation, we find large amount of diploptene (17β(H), 21β(H)-hop-22(29)-ene) in MD-
382
1 (high closure) and UD-4 sediments (low closure) with δ13C values of -51.6 ± 2.5‰ and -56.6
383
± 1.8‰, respectively, comparable with values reported for Alaskan Arctic thermokarst lakes
384
(Davies et al., 2016). Hence, it seems that the oxidation of methane occurs aerobically and is
385
primarily mediated by bacteria, but further studies that target the methanotrophic archaea
386
(using specific primers or biomarkers) are needed.
387 388
4.1.2. Provenance of brGDGT lipids
389
BrGDGTs in lake sediments can derive from the watershed, after soil erosion, and from in situ
390
production within the lake water column itself. Elucidating the source of these lipids is
391
necessary before paleoclimate information can be robustly retrieved from their distributions.
392
In a ternary plot for globally distributed soils and lakes (Fig. 2), the GDGT distribution of
393
Mackenzie lake sediments plot towards cold soils and lakes, similar to that observed in
394
Antarctic lakes (Foster et al., 2016). The dominant brGDGTs are the non-cyclopentane
395
containing pentamethylated as well as hexamethylated 5 and 6 methyl brGDGTs (IIa, IIa’, IIIa
396
and IIIa’, respectively; Fig. 2) which have been suggested to be indicative of in situ production
397
in lakes (Blaga et al., 2009; Tierney et al., 2010; Pearson et al., 2011; Sun et al., 2011; Shanahan
398
et al., 2013; Peterse et al., 2014; Russell et al., 2018). Tetrametylated brGDGTs Ia, Ib and Ic
399
are usually characteristic for soil input (Fig. 2, e.g., Weijers et al., 2007; Zink et al., 2016;
400
Russel et al., 2018). However, soils from cold areas such Alaska and Svalbard) and permafrost
401
soils from Siberia (Kush et al., 2019) have a higher IIIa proportion than temperate and tropical
402
soils (Weijers et al., 2007). One soil from the Mackenzie River delta has been measured
403
(Peterse et al., 2014) and has 42% IIIa + IIIa’, but the analysis has been done with an older
404
protocol without differentiating 6-methyl isomers from 5-methyl isomers. Taking the pH of
405
this soil (6.5) and the associated IR value (0.49, Yang et al., 2015) into account, there is likely
406
equal proportions of IIIa and IIIa’ in this soil sample, which differs from the lake samples (Fig.
407
2). Furthermore, the 5,6-methyl brGDGT IIIa’’ in UD-4 sediments (low-closure lake, Fig. 2)
408
indicates the presence of in situ production, as this compound was exclusively reported from
409
lake sediments and water column suspended particulate matter and is always below detection
410
limit in soils (De Jonge et al., 2014b; Weber et al., 2015, 2018; Martin et al., 2019).
411
The BIT index is consistently above 0.9 for the three lakes (0.99 in soil, Peterse et al., 2014),
412
but these high values in the lakes likely reflect the low crenarchaeol concentration (Fig. 2)
413
rather than an indicator of soil input. The IIIa/IIa ratio (Xiao et al., 2016; Martin et al., 2019)
414
is 1.6 ± 0.4 for UD-4, 1.5 ± 0.2 for MD-2 and 1.4 ± 0.3 for MD-1, which also points toward a
415
lacustrine in situ production (the reported threshold is > 0.9 for in situ aquatic production, in
416
one soil of the Mackenzie region it is 1.2, Peterse et al., 2014). The Mackenzie River transports
417
large quantities of soil-derived organic matter (Vonk et al., 2019), and is therefore a potential
418
source of soil-derived brGDGTs, especially to the no-closure lakes. However, the distribution
419
of brGDGTs in Mackenzie River SPM differs from that in lakes with IIa (IIa + IIa’) and IIIa
420
(IIIa = 15% and IIIa’ = 19%) as main brGDGTs (34% each, Peterse et al., 2014) and IIIa/IIa
421
equal to 1.0 ± 0.1 (n = 6; Peterse et al., 2014). Furthermore, as Peterse et al. (2014) noted, the
422
concentration of brGDGTs in the lakes (total brGDGTs 19 ‒ 33 µg gTOC-1) are significantly
423
higher than in the Mackenzie River (total brGDGTs 0.4 ‒ 3.9 µg gTOC-1) where soil brGDGTs
424
could originate. In conclusion, the brGDGT distribution indicates a dominant in situ lacustrine
425
production in all studied lakes, irrespective of their degree of closure, and with no apparent
426
changes in provenance downcore.
427
The production of IIIa’’ has been previously found to be confined to the anoxic part of the
428
water column of Lake Lugano and Hinterburg, Switzerland (Weber et al., 2015, 2018). It is
429
also reported in sediments from Lake St Front, France (Martin et al., 2019). In the Mackenzie
430
lake sediments it is only found in lake UD-4 (low closure). Mackenzie delta lake bottom waters
431
experience anoxia during the winter season when ice effectively seals the lakes and large
432
amounts of organic matter is respired (Squires et al., 2009). However, the other studied lakes
433
also experience anoxia in winter yet do not show any IIIa’’ production, suggesting that this
434
GDGT it is not a specific marker for anoxia. IIIbX, a brGDGT with an unknown structure, has
435
not been reported before and is only present in lake MD-1, whereas IIIcX, another brGDGT
436
with unknown structure, is found in lakes UD-4 and MD-2 but has not been reported in other
437
lakes (Fig. 2). As the proportion of IIIb isomers and IIIc isomers increase with increasing pH,
438
and MD-1 has a higher pH than the other lakes, the presence of IIIbX could tentatively be
439
attributed to increased pH. However, this inference, together with the curious presence of IIIcX
440
in MD-2 and UD-4, requires more study, in particular through analysis of SPM from the lakes.
441 442
The δ13C values of brGDGTs can shed light on the metabolism of brGDGT producers (Naeher
443
et al., 2014; Weber et al., 2015, 2018). The values found in lake UD-4 (low closure) and MD-
444
2 (no closure) are similar and constant over the length of each cores (-29.0 ± 0.2‰ and -28.9
445
± 0.2‰, respectively) and also present a systematic 3‰ offset with δ13CTOC (-26.0 ± 0.4‰ and
446
-26.6 ± 0.4‰, Lattaud et al., submitted) as was observed in lake SPM before by Weber et al.
447
(2018). The ≈ 3‰ difference between the brGDGTs and the TOC is consistent with the
448
heterotrophic metabolism of Acidobacteria (Kielak et al., 2016), with the breakdown and
449
assimilation of particulate organic carbon in the water column and surface sediments. For the
450
upper part of the MD-1 (high closure) core, the δ13CTOC is significantly higher (-22.8 ± 0.3‰,
451
> 22 cm) while the δ13CbrGDGT is significantly lower (-31.1 ± 0.2‰). In contrast, δ13CTOC values
452
in the lower part of MD-1 were markedly lower (-27.9± 0.3‰) while the δ13CbrGDGT values
453
were similar to those in the upper part (-32.7 ± 0.3‰). The top part of the sediment core is a
454
mix of labile carbon (macrophyte-derived and MOB-derived), as indicated by younger TOC
455
14C ages while deeper in the core only the refractory, pre-aged OC remain (mainly terrestrial
456
higher-plant-derived, Lattaud et al., submitted). This suggests that the lacustrine brGDGT-
457
producers consume labile organic carbon such as a mix of MOB-derived and macrophyte-
458
derived. In no-closure and low-closure lakes characterized by macrophyte production (Squires
459
and Lesack, 2002) and less MOB-derived OM, terrestrial plant-derived OM may serve as a
460
more important carbon source for brGDGT producers.
461
Hence, the large difference (~ 9‰) between δ13CGDGT and δ13CTOC in the upper part of the core
462
from MD-1 points toward the heterotrophic consumption by brGDGT producers of labile, 13C-
463
depleted MOB-derived organic matter instead of more refractory 13C-enriched compounds.
464
While in MD-2 and UD-4, brGDGT producers are likely feeding (using fermentation) on more
465
refractory terrestrial-plant derived OM due to the depletion of labile compounds.
466
467
Figure 5 Temperature reconstruction using brGDGTs in (a) MD-1 (high closure), (b) MD-2
468
(no closure) and (c) UD-4 (low closure). Mean summer temperature at Inuvik, GDGT-
469
reconstructed summer temperature using equation 1 (Russell et al., 2018) and using equation 3
470
(Russell et al., 2018).
471 472
4.2. Environmental reconstruction using brGDGTs
473
4.2.1. Calculation of GDGT-based temperatures
474
Several temperature calibrations exist for lakes, many of which are lake-specific (e.g., Foster
475
et al., 2016; Pearson et al., 2011; Sun et al., 2011; Zink et al., 2016), hindering their use in other
476
locations. The Mackenzie delta is characterized by low annual air temperatures (-8.4 ± 1.7 °C
477
average of the last 60 years at Inuvik weather station) but comparably high summer
478
temperatures (11.9 ± 1.4 °C average of the last 60 years at Inuvik weather station), and the
479
lakes of the delta are only free of ice from June (freshet) to late September. A few calibrations
480
have been performed in the high Arctic (Shanahan et al., 2013; Colcord et al., 2015), but none
481
of these are based on the full suite of 15 brGDGTs (see appendix), owing to changes in the
482
analytical protocol. We therefore adopted the same approach as Shanahan et al. (2013), who
483
used a global lake calibration. We use the multivariate regression that Russell et al. (2018)
484
propose ([Eq. 1] RSME 2.14 °C) based on a set of African lake surface sediments. In addition
485
we also calculate the MBT’5ME index as defined by De Jonge et al. (2014b) [Eq. 2] and apply
486
the calibrations calculated by Russell et al. (2018) ([Eq. 3], RSME = 2.43 °C). We interpret the
487
reconstructed temperatures as mean annual summer temperatures since it is likely, although
488
not proven, that the brGDGTs are mainly produced when the region is free of ice (Shanahan et
489
al., 2013).
490 491
𝑀𝐴𝑆𝑇 = 23.81 − 31.02 × 𝐼𝐼𝐼𝑎 − 41.91 × 𝐼𝐼𝑏 − 51.59 × 𝐼𝐼𝑏′− 24.70 × 𝐼𝐼𝑎 + 68.80 ×
492
𝐼𝑏 (1)
493
𝑀𝐵𝑇′5𝑀𝑒 = 𝐼𝑎+𝐼𝑏+𝐼𝑐
𝐼𝑎+𝐼𝑏+𝐼𝑐+𝐼𝐼𝑎+𝐼𝐼𝑏+𝐼𝐼𝑐+𝐼𝐼𝐼𝑎 (2)
494
𝑀𝐴𝑆𝑇 = −1.21 + 32.42 × 𝑀𝐵𝑇′5𝑀𝑒 (3)
495 496
The absolute reconstructed temperatures using [Eq. 1] are in the range of those recorded in
497
summer at Inuvik during the last 60 years, supporting the validity of this calibration, while
498
those reconstructed by [Eq. 3] are lower (~ 4 °C lower than recorded temperatures, Fig. 5). The
499
reconstructed temperatures using [Eq. 1] and [Eq. 3] present the same pattern for MD-1 and
500
UD-4 but differ in the bottom part of MD-2. The latter could indicate that [Eq. 2] is influenced
501
by parameters other than temperature, such as oxygen concentration and pH changes (see
502
below). Furthermore, we note that MBT’5Me is, on average, increasing with decreasing
503
connectivity to the river (Fig. 6), implying that this ratio is not only controlled by variations in
504
temperature.
505
In MD-1 there is a slight increase (+1 °C) in MAST over the record [Eq. 1], but UD-4 present
506
more variation than MD-1 which could reflect the slow sedimentation in MD-1 that buffers
507
large changes in temperature. In UD-4 the most recent part of the record seems to capture the
508
yearly variability recorded in the instrumental record [Eq. 1]. This absence of warming reflects
509
the stability of the summer temperatures in the region, and equation [Eq. 1] seems to be better
510
at capturing yearly variability in temperature. Hence, equation [Eq. 1] is recommended in the
511
Mackenzie delta lakes to reconstruct summer air temperature.
512 513
4.2.2. BrGDGTs as indicators of lake hydrology and connectivity
514
The three lakes studied differ with respect to their connectivity to the river, as well as their size
515
and depth. For example, MD-2 (no closure) is the largest and deepest lake, while UD-4 (low
516
closure) and MD-1 (high closure) have a rather small area and are quite shallow (~1 m deep).
517
Due to this variation in connectivity their nutrient content and chemical properties are also
518
expected to be different. The mean annual pH of the lakes is similar but can significantly vary
519
over the course of the year, being as high as ~10 in late summer in high closure lakes while
520
remaining at ~7.8 in no closure lakes (similar to the Mackenzie River, Tank et al., 2008, 2009).
521
A principal component analysis (PCA, Fig. S1), performed for each lake using the fractional
522
abundance of all 15 brGDGT compounds, reveals that in MD-2 (no closure lake) and UD-4
523
(low closure), the principal component 1 (PC1) (explaining 68% and 52% of the variance,
524
respectively) is represented by IIIa’ and IIIa’’, which may reflect anoxic conditions (Weber et
525
al., 2018), while PC2 (explaining 14% and 25% of the variance, respectively) is represented by
526
IIIa which likely reflects a temperature control (as it is included in [Eq. 1] and [Eq. 2]). In MD-
527
1, the main sources of variation differ, with IIa’ and IIIa having a high (and opposite) loading
528
on PC1 (explaining 58% of the variance) and IIIa’ on PC2 (explaining 33% of the variance).
529
Hence, both temperature and oxygen availability seem to exert significant influence on the
530
distribution of brGDGTs in Mackenzie lakes. Weber et al. (2018) observed more brGDGT
531
isomers (6-methyl and 5,6-methyl) as well as a stronger increase in IIIa’ than in IIa’ in the
532
anoxic part of the water column of Lake Lugano. To assess this, the isomer ratios (IR) have
533
been calculated for the GDGT-IIIa and the GDGT-IIa (IRIIIa [Eq. 5] and IRIIa [Eq. 6]):
534 535
𝐼𝑅𝐼𝐼𝐼𝑎 = 𝐼𝐼𝐼𝑎′
𝐼𝐼𝐼𝑎′+𝐼𝐼𝐼𝑎 (5)
536
𝐼𝑅𝐼𝐼𝑎 = 𝐼𝐼𝑎′
𝐼𝐼𝑎′+𝐼𝐼𝑎 (6)
537
538
Overall, there is an increase in average downcore IR values with decreased lake connection
539
(significant for IRIIa between all lakes and significant for IRIIIa between NC and HC and LC
540
and HC, t-test < 0.05) with the Mackenzie River (Fig. 6), in agreement with longer anoxic
541
conditions in high closure lakes. This control of the river connectivity also influences the
542
MBT’5Me values, which on average show an increase (significant between LC to HC and NC
543
to HC, t-test < 0.05) with decreasing connectivity (Fig. 6).
544
In prior studies, brGDGTs have been linked to other environmental parameters than
545
temperature, such as variation in pH (e.g. De Jonge et al., 2014b), with the CBT5Me allowing
546
for the reconstruction of pH in soils and lakes ([Eq. 4] and [Eq. 5]):
547 548
𝐶𝐵𝑇5𝑀𝑒 = 𝐼𝑏+𝐼𝐼𝑏
𝐼𝑏+𝐼𝐼𝑏+𝐼𝑎+𝐼𝐼𝑎 (4)
549
𝑝𝐻 = 7.84 − 1.73 × 𝐶𝐵𝑇5𝑀𝑒 (5)
550 551
The reconstructed pH in all lakes is similar (6.8 ± 0.1 for MD-2 and UD-4, and 7.0 ± 0.1 for
552
MD-1) and does not vary down core (data not shown). This seems unlikely given the large
553
variability in pH between the lakes. Hence, CBT5Me does not appear to reflect pH variation in
554
the Mackenzie delta lakes and brGDGTs are likely controlled by other environmental
555
parameters such as redox properties but also possibly the trophic state of the lakes.
556
557
Figure 6 brGDGT ratios in link with the river connection with (a) isomer ratios of GDGT-IIIa
558
and GDGT-IIa and (b) MBT’5Me.
559 560
5 Conclusion
561
In a step towards assessment of the effects of recent warming in the Canadian arctic on aquatic
562
ecosystems of the region, and potential feedbacks with respect to greenhouse gas emissions,
563
we have investigated microbial lipid (GDGT) signatures in sediments from three Mackenzie
564
River delta lakes. The iGDGT compositions are dominated by GDGT-0, a potential marker for
565
the presence of methanogens, in agreement with the quasi absence of crenarchaeol, and
566
corresponding 13C-signatures are compatible with an acetoclastic methanogenic source along
567
with a significant production by heterotrophic archaea. The abundance and 13C-depleted
568
signature of diploptene indicates methane consumption via bacterial aerobic oxidation rather
569
than anaerobic oxidation by Archaea. BrGDGT composition reveals a predominant “cold”
570
signature that seems to be dominated by in situ lacustrine production of hexamethylated and
571
pentamethylated brGDGTs, in agreement with the presence of the uncommon IIIa’’, IIIbX and
572
IIIcX GDGT. Temperature reconstructions using brGDGTs suggest a near stable summer air
573
temperature for the last century, in agreement with recent instrumental records (> 1960 C.E.).
574
A strong control of the lake connectivity on the brGDGT distributions is evident, apparently
575
linked with the oxygen content of the lakes.
576 577
Competing interests
578
The authors declare that they have no conflict of interest.
579 580
Acknowledgements
581
We thank members of the sampling team for collecting the sediment cores from the Mackenzie
582
River lakes, Jorien Vonk for slicing MD-2 and UD-4, and Liviu Giosan for providing core MD-
583
1. Daniel Montlucon is thanked for laboratory support, Steward Bishop and the Climate
584
Geology group are thanked for instrument access. J.L. was funded by a Rubicon grant
585
[019.183EN.002] from NWO, Netherlands Organization for scientific research.
586 587
Data availability
588
Data from this study will be available from the PANGEA repository (doi:).
589 590
Supplement
591
592
Figure S1: Principal component analysis of brGDGT on (a) MD-2 (no closure), (b) UD-4 (low
593
closure) and (c) MD-1 (high closure).
594
595
Figure S2: Carbon stable isotope compositions of brGDGT relatively to the carbon stable
596
isotope compositions of the bulk organic matter (Lattaud et al., submitted). Data from Colcord
597
et al. (2017) are represented for comparison.
598 599