Ecophysiological Investigation of the Cyanobacterium
Synechococcus for Potential Biomedical Application
Master’s Thesis
in partial fulfillment of the academic degree Master of Science (M.Sc.)
in Marine Microbiology University of Bremen
Faculty Biology/ Chemistry (FB2)
University of Bremen, Glycobiochemistry Alfred Wegener Institute,
Polar Biological Oceanography/Ecological Chemistry
submitted by Laura Johanna Gebhard Matriculation number: 4118888
1. Reviewer: Prof. Dr. Allan Cembella 2. Reviewer: Prof. Dr. Sørge Kelm Bremen, March 2019
Acknowledgements
Acknowledgements
This Master thesis would not have been possible without the help of many people and I would like to take this opportunity to thank them:
Prof. Dr. Allan Cembella for agreeing to be my 1st reviewer as well as for the great sup- port.
Prof. Dr. Sørge Kelm for agreeing to be my 2nd reviewer and for hosting me at his labs at the University of Bremen.
Prof. Dr. Anya Waite for offering this Master thesis and as well as for the support through- out the six months.
Dr. Mario Waespy for the supervision in the Lab as well as always having an open ear.
Prof. Dr. Dieter Wolf-Gladrow for hosting me at the Polar Biological Oceanography sec- tion at the AWI.
Susanne Spahic for the invaluable help during the first months of organisation and the support after that.
Dr. Alexandra Kraberg for the advice and help in organising in the first months.
Erika Allhusen for the help with the pulse-amplitude modulation fluorometer.
Claudia Daniel for lending me the oxygen measurement devices.
Dr. Eva-Maria Nöthig, Andreas Rogge, Cora Hörstmann, Dr. Allison Fong and the whole Polar Biological Oceanography section at the Alfred-Wegener Institute for the warm wel- come and support.
Dr. Christine Klaas, Dr. Florian Koch, Sebastian Böckmann and Dr. Sebastian Rokitta from the Marine BioGeoScience section at the AWI for the help with the flow cytometer.
Tanja Glawatty and Sabine Limberg for help with administrative issues at the AWI and the Uni Bremen respectively.
Acknowledgements
The whole Glycobiochemistry group at the University of Bremen for the warm welcome and support.
Camilla Konermann from the IMSAS at the University of Bremen for the oxygen meas- urements as well as Prof. Dr.-Ing. Michael J. Vellekoop for hosting me at the IMSAS labs.
Prof. Dr. Rita Groß-Hardt from the Molecular Genetics Group at the University of Bre- men, for hosting the cyanobacteria in her laboratories during my experiments at the Uni- versity of Bremen.
Prof. Dr. Kai Bischof, Dr. Karin Springer and Johanna Marambio from the Marine Botany Group at the University of Bremen for materials and support with the pulse amplitude modulation fluorometry.
The MPI Bremen and the Max-Planck Society for the funding during my Master’s pro- gramme.
Dr. Christiane Glöckner, Dr. Solveig Bühring and Anita Tingberg for organizational help during this Master’s programme.
And finally, my family and friends for the support during these past six months.
Statement - Eigenständigkeitserklärung
Statement - Eigenständigkeitserklärung
I hereby confirm that I have written this thesis unaided and that I have used no other resources than those mentioned.
Hiermit versichere ich, dass ich diese Arbeit selbständig verfasst und keine anderen als die angegebenen Quellen und Hilfsmittel verwendet habe.
___________________________ _________________________________
(Place and Date / Ort und Datum) (Signature / Unterschrift)
Table of Contents
Table of Contents
Acknowledgements ... i
Statement - Eigenständigkeitserklärung ... iii
Table of Contents ... iv
List of Abbreviations... vii
List of Figures ... ix
List of Tables... xix
1. Abstract ... 1
2. Introduction ... 3
2.1. Cyanobacteria in Aqueous Ecosystems ... 3
2.1.1. The Photosynthetic Apparatus of Cyanobacteria ... 4
2.2. Impact of Climate Change on Cyanobacteria ... 6
2.3. Biotechnological Application of Cyanobacteria ... 8
2.3.1. State of the Art ... 8
2.3.2. Medical Application ... 8
2.3.3. The Human Epidermis & Wound Healing ... 10
2.3.4. Ecophysiological Requirements of an Endosymbiont ... 12
2.3.5. Candidate Strains of Synechococcus ... 13
2.4. Aim of the Work ... 15
3. Materials & Methods... 16
3.1. Culturing & Growth Kinetics ... 16
3.1.1. Origin & Maintenance of Cyanobacterial Strains ... 16
3.1.2. Growth Kinetics ... 17
3.2. Flow Cytometry ... 20
3.2.1. General Measurements ... 20
3.2.2. Propidium Iodide Staining & Pigment Content ... 22
3.3. Pulse Amplitude Modulation Fluorometry ... 23
3.4. Oxygen Measurements with the μRespirometer ... 23
4. Results ... 27
Table of Contents
4.1. Flow Cytometric Measurements & Method Development ... 27
4.1.1. Synechococcus RCC2384 ... 27
4.1.2. Synechococcus PCC7942 ... 29
4.2. Initial Trials with Synechococcus RCC2384 ... 32
4.3. Characterisation of Synechococcus PCC7942 ... 34
4.3.1. Cell Concentrations & pH ... 34
4.3.2. Pigment Content ... 38
4.4. Testing of the μRespirometer ... 40
5. Discussion ... 47
5.1. Analysis of Initial Trials & Methodological Drawbacks ... 47
5.1.1. Initial Trials with Synechococcus RCC2384 ... 47
5.1.2. Applicability of the μRespirometer for Oxygen Measurements with Synechococcus ... 50
5.2. Characterisation of Synechococcus PCC7942 ... 51
5.2.1. Temperature and Irradiance Dependence of Growth ... 51
5.2.2. Osmolarity Dependence of Growth ... 52
5.2.3. pH Dependence of Growth ... 54
5.3. Environmental Relevance ... 56
5.4. Application as an Endosymbiont in Biomedical Research ... 60
6. Outlook & Future Perspectives ... 62
7. References ... 65
8. Appendix ... 79
8.1. Figures ... 79
8.1.1. Synechococcus RCC2834 ... 79
8.1.2. Synechococcus PCC7002 ... 85
8.1.3. Synechococcus PCC7942 ... 86
8.2. Statistical Analysis ... 97
8.2.1. Effect of Propidium Iodide Staining ... 97
Table of Contents
8.2.2. Growthrates (t0 – t1) over pH t0 ... 98
8.2.3. Geometric Mean of Pigment (t0 – t1) over pH t0 ... 100
8.3. Tables ... 101
8.3.1. Materials & Methods ... 101
8.3.2. Results ... 105
List of Abbreviations
List of Abbreviations
air sat. air saturation
ANOVA analysis of variance
APC allophycocyanin
ddH2O double-distilled water
ESAW enriched artificial sea water medium
LC-MS liquid chromatography – mass spectrometry
NAM normalised arithmetic mean
NGM normalised geometric mean
NM normalised median
PAM pulse-amplitude modulation
PBS phycobilisome
PC phycocyanin
PCB phycocyanobilin
PCC Pasteur Culture Collection
pCO2 partial pressure of carbon dioxide
PE phycoerythrin
List of Abbreviations
PEB phycoerythrobilin
PI propidium iodide
PSI photosystem I
PSII photosystem II
PtTFPP platinum(II)-5, 10, 15,20-tetrakis-(2,3,4,5,6-pentafluorphenyl)- porphyrin
PUB phycourobilin
RCC Roscoff Culture Collection
List of Figures
List of Figures
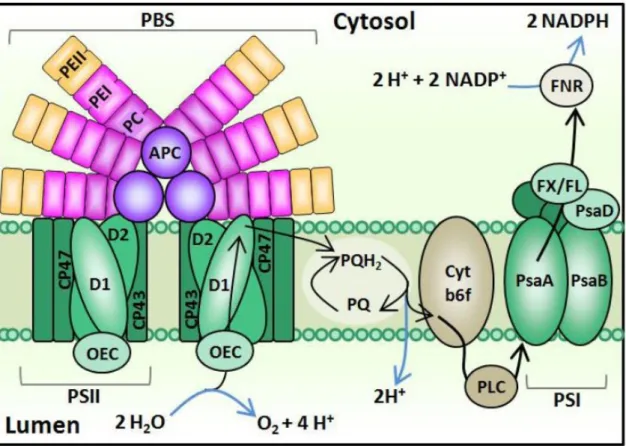
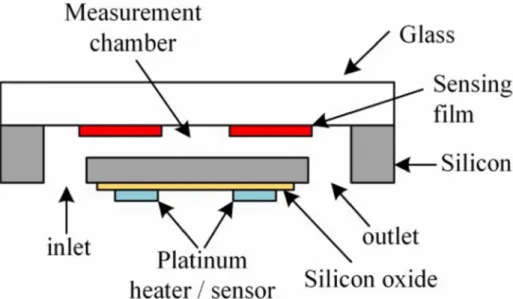
Figure 1 Schematic figure of the photosynthetic apparatus and the electron flow in cyanobacteria (taken from Mackey et al. (2013b)). Chemical reactions are shown in blue and the pathway of electrons is shown in black. The phycobilisome (PBS) is associated with Photosystem II (PSII). Light energy is captured by chlorophyll-a in the PSII as well as phycoerythrin (PE), phycocyanin (PC) and allophycocyanin (APC) in the PBS. From the PSII electrons are transferred to the plastoquinone (PQ)/plastoquinol (PQH2) pool, to cytochrome b6f (Cyt b6f), to plastocyanin (PLC), to the PSI, to ferredoxin and flavodoxin (FX, FL) in that order. Finally, the ferredoxin/flavodoxin NADP reductase (FNR) creates reducing equivalents, that are further processed in the Calvin-Benson Cycle. ... 4 Figure 2 Schematic figures of the pigment complexes and absorption spectra of the major phycobilisome types of Synechococcus: composition (A), whole-cell absorption spectra (B) and whole-cell fluorescence spectra after excitation with 680 nm (C) (taken from Grébert et al. (2018a). ... 5 Figure 3 A conceptual model for a large river plume eutrophication, subsurface water hypoxia and acidification based on studies in the Gulf of Mexico and the East China Sea (taken from Cai et al. (2011a)). ... 7 Figure 4 Schematic diagram of the structural components of the mammalian epidermis (taken from OpenStax College (2018)). ... 10 Figure 5 Schematic structure of the microfluidic chip of the μRespirometer. The measurement chamber (61.5 mm3) is connected to the outside with an inlet and outlet of 0.7 mm diameter each. A heating module and a temperature sensor made out of platinum are integrated into the chip. The chamber is sealed on the sides and bottom by silica gels and on the top by a glass layer. Five, circular oxygen sensing spots (1.3 mm diameter) are attached to the glass layer facing the measuring chamber (taken from Bunge et al.
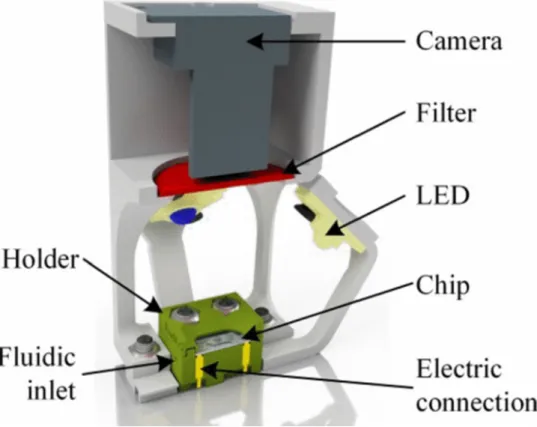
(2018b)). ... 24 Figure 6 Setup of the μRespirometer. The microfluidic chip sits in a 3D printed holdfast and receives irradiance by an excitation LED and an illumination LED (not pictured here).
A filter with a cut-off of 600 nm is mounted in front of the camera (taken from Bunge et al. (2018a)). ... 25
Figure 7 Exemplary presentation of the gates used to quantify the number of Synechococcus RCC2384 cells, for 100B at t7 of the first quick adaptation test (a) and
List of Figures
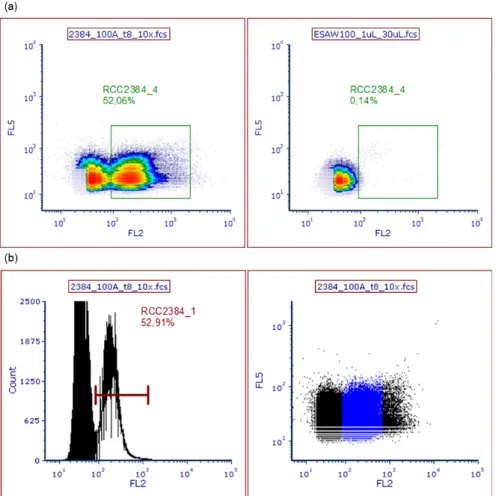
MilliQ as a control without beads on the same day (b). The number of cells was determined with the RCC2384_1 gate in the projection of the peak height of the fluorescent signal strength of phycoerythrobilin (FL2-H, 575 nm) plotted against peak height of side scatter after excitation at 488 nm (left). The beads for volume control were enumerated in gate Beads_1 by plotting FL1 (yellow-green, 525 nm) over forward scatter after excitation at 488 nm (right). ... 27 Figure 8 Exemplary presentation of the gates used to quantify the number of Synechococcus RCC2384 cells for 100A at t8 (second quick adaptation test) and 100%
ESAW medium as a control. The number of cells was determined with the RCC2384_4 gate in the projection of the fluorescent signal strength of phycocyanobilin (FL5) plotted against the fluorescent signal of phycoerythrobilin (FL2) after excitation at 638 and 488 nm respectively (a). The area of RCC2384_4 corresponded roughly to the peak area marked as Gate RCC2384_1 in the histogram of counts over signal intensity of FL2 (b).
... 28 Figure 9 Cell concentrations of the centrifugation test with Synechococcus RCC2384 over seven days. The average cell concentrations (per mL, n = 3) with standard deviation for 100% and 60% osmolarity (indicated by colour) are shown over time (days) in natural logarithm projection of the y-axis. Centrifugation protocol is indicated by shape. ... 28 Figure 10 Exemplary presentation of the gates used to quantify the number of Synechococcus PCC7942 cells, for sample 1A at t2 of the growth curve and 0% ESAW medium as a control. The number of cells was determined with the PCC7942_6 gate in the projection of the fluorescent signal strength of phycocyanobilin (FL5) plotted against the fluorescent signal in the far-red wavelength spectrum (FL6) after excitation at 638 nm (a). Additionally, PI-stained particles were enumerated in the gate PCC7942_1 in the projection of FL5 over the emission of phycoerythrobilin (FL2) after excitation at 638 and 488 nm respectively (Figure 11). The area of PCC7942_4 corresponded roughly to the peak area marked as Gate PCC7942_2 in the histogram of counts over signal intensity of FL5 (c). ... 29 Figure 11 Exemplary presentation of the gates used to quantify the number of
Synechococcus PCC7942 cells. The population was marked in gate PCC7942_1 and the population stained with PI was marked in Gate PCC7942_PI in the projection of the fluorescent signal strength of phycocyanobilin (FL5) plotted against PI (FL2) after excitation at 638 and 488 nm respectively. Shown here is sample 1B from the growth cycle experiment of PCC7942 (30% ESAW pH 8.2) at t5 both stained with PI (left),
List of Figures
unstained (middle) and sterile 0% ESAW medium as a control (right). The gates PCC7942_1 and PCC7942_PI were also marked in the FL2 over forward scatter plot with PCC7942_1 in red and pink respectively. ... 30 Figure 12 Comparison of cell concentrations from unstained and propidium iodide (PI) stained samples seven days after inoculation recorded at t4 of the growth curve of Synechococcus PCC7942. Shown here are the average cell concentrations (n = 4) with standard deviations per condition and ordered by staining protocol... 31 Figure 13 Exemplary presentation of the gates used to quantify the pigment content of
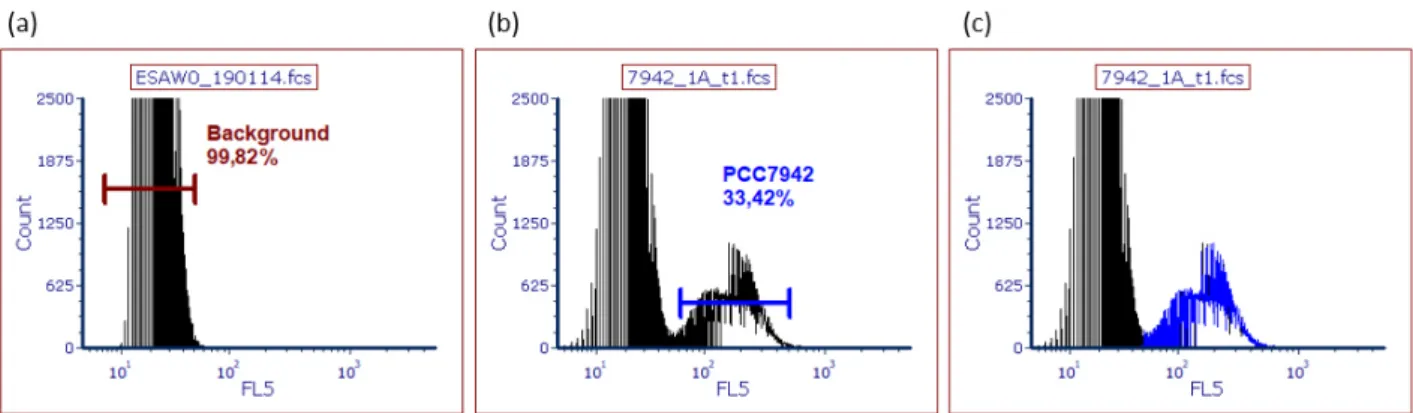
Synechococcus PCC7942 cells. The background signal was identified in the histogram of counts over phycocyanobilin (FL5) signal strength for sterile medium of the respective osmolarity (a). This area marked in the background gate was then subtracted from the sample, shown here for 1A at t1 of the growth curve. Pigment content was enumerated based on the statistics of the remaining peak (marked in blue in (c)). ... 31 Figure 14 First quick adaptation test with Synechococcus RCC2384 over two weeks.
Average cell concentrations (per mL, n = 5) with standard deviation are shown over time (days) for both 100% and 29% cultures in natural logarithm projection of the y-axis. .. 32 Figure 15 Growth curve of Synechococcus PCC7942 over 17 days. Shown here are the averages (n = 4) with standard deviations for the concentrations (mL-1) of PCC7942 cells (solid line) and PI stained particles (dashed line) over time (days). The osmolarity condition of the medium is indicated by colour and the cell concentrations are shown in natural logarithm projection on the y-axis. ... 35 Figure 16 Growth curve of Synechococcus PCC7942 over 17 days. Average pH measurements (n = 4) with standard deviations are plotted against time (days). The osmolarity condition of the medium is indicated by colour. ... 36 Figure 17 Growth rates of Synechococcus PCC7942 in different osmolarity conditions (t0 – t1) plotted against pH values measured at t0. The osmolarity of the growth medium is indicated by shape and colour. ... 37 Figure 18 Normalised geometric means (NGM, signal counts-1) of the phycocyanobilin peaks of Synechococcus PCC7942 plotted against time (days) and ordered by condition (indicated by colour). ... 39 Figure 19 Normalised geometric means of the phycocyanobilin peaks of Synechococcus PCC7942 at t1 (signal counts-1) plotted against pH values measured at t0. The osmolarity of the medium is indicated by shape and colour. ... 40
List of Figures
Figure 20 Oxygen measurement of Synechococcus RCC2384 over 24 hours in the μRespirometer. The oxygen concentration (% air sat., a) relative (b) normalised relative intensity (c) recorded by the camera are plotted against time (hours). Shown here are the values from the five oxygen sensing spots (indicated in the legend) of the microfluidic chip. Pictures were taken every 10 min and the temperature was set to 30 °C. The measurement chamber was illuminated in a 12:12 hour diurnal cycle from the start of the measurement (as indicated by the bar at the top) and the light was provided by a red- coloured LED at a current of 50 mA. ... 41 Figure 21 Oxygen measurement with Synechococcus PCC7002 in the μRespirometer over 48 hours. The oxygen concentration (% air sat.) calculated from the intensity of the phosphorescent signal is plotted against time (hours). Shown here are the values from the five oxygen sensing spots (indicated in the legend) of the microfluidic chip. Pictures were taken every 10 min and the temperature was set to 30 °C. The measurement chamber was illuminated in a 12:12 hour diurnal cycle from the start of the measurement (indicated by the bar at the top) and the light was provided by a red-coloured LED at a current of 50 mA.
... 42 Figure 22 Oxygen measurement with Synechococcus PCC7942 in the μRespirometer over 48 hours. The oxygen concentration (% air sat.) calculated from the intensity of the phosphorescent signal is plotted against time (hours). Shown here are the values from the five oxygen sensing spots (indicated in the legend) of the microfluidic chip. Pictures were taken every 10 min and the temperature was set to 30 °C. The timespans of darkness and illumination are indicated by the bar at the top. The light was provided by a red-coloured LED at a current of 50 mA. ... 43 Figure 23 Oxygen measurement of Synechococcus PCC7942 over 48 hours in the μRespirometer as part of the growth curve (0% ESAW pH 8.2) 4 days after inoculation.
The oxygen concentration (% air sat.) was calculated from the intensity of the phosphorescent signal is plotted against time (hours). Shown here are the values from the five oxygen sensing spots (indicated in the legend) of the microfluidic chip. Pictures were taken every 10 min and the temperature was set to 30 °C. The measurement chamber was illuminated in a 12:12 hour diurnal cycle shifted one hour from the start of the measurement (as indicated by the bar at the top) and the light was provided by a red- coloured LED at a current of 50 mA. At 43 h and 20 min the system was flushed with water with an oxygen concentration of 3% air sat. (indicated by the arrow on the x-axis).
The cell density was ca. 1.32 · 107 cells mL-1 at the start of measurement. ... 44
List of Figures
Figure 24 Oxygen measurement of Synechococcus PCC7942 over 79 hours in the μRespirometer as part of the growth curve (30% ESAW pH 7.0). The oxygen concentration (% air sat.) was calculated from the intensity of the phosphorescent signal is plotted against time (hours). Shown here are the values from the three oxygen sensing spots (indicated in the legend) of the microfluidic chip. Pictures were taken every 10 min and the temperature was set to 30 °C. The measurement chamber was illuminated in a 12:12 hour diurnal cycle shifted four hours from the start of the measurement (as indicated by the bar at the top) and the light was provided by a red-coloured LED at a current of 50 mA. At 74 h and 10 min the system was flushed with water with an oxygen concentration of 3% air sat. (indicated by the arrow on the x-axis). The data from spots 1 and 5 were removed from the graph for clarity. The cell density was ca. 1.85 · 107 cells mL-1 at the start of measurement. ... 45 Figure 25 Oxygen measurement of Synechococcus PCC7942 over 79 hours in the μRespirometer as part of the growth curve (30% ESAW pH 7.0). The oxygen concentration (% air sat.) was calculated from the intensity of the phosphorescent signal is plotted against time (hours). Shown here are the values from the five oxygen sensing spots (indicated in the legend) of the microfluidic chip. Pictures were taken every 10 min and the temperature was set to 30 °C. The measurement chamber was illuminated in a 12:12 hour diurnal cycle shifted four hours from the start of the measurement (as indicated by the bar at the top) and the light was provided by a red-coloured LED at a current of 50 mA. At 74 h and 10 min the system was flushed with water with an oxygen concentration of 3% air sat. (indicated by the arrow on the x-axis). The data from spots 1 and 5 were removed from the graph for clarity. The cell density was ca. 2.12 · 107 cells mL-1 at the start of measurement. ... 46 Figure 26 Cell concentrations of the centrifugation test with Synechococcus RCC2384 over seven days. The average cell concentrations (per mL, n = 4) with standard deviation for 100% and 60% osmolarity are shown over time (days). The osmolarity of the medium is indicated by colour, centrifugation protocol is indicated by shape. ... 79 Figure 27 pH values measured as part of the centrifugation test with Synechococcus RCC2384 over seven days. The average pH values (n = 4) measured in every condition with standard deviation for conditions of 100% and 60% osmolarity are shown over time (days). The osmolarity of the medium is indicated by colour, centrifugation protocol is indicated by shape. ... 79
List of Figures
Figure 28 First quick adaptation test with Synechococcus RCC2384 over two weeks.
Average cell concentrations (per mL, n = 5) with standard deviation are shown over time (days) for both 100% and 29% cultures. The osmolarity of the medium is indicated by colour... 80 Figure 29 First quick adaptation test with Synechococcus RCC2384 over two weeks. Cell concentrations (per mL) for each of the five replicates of the osmolarity conditions 100%
and 29% are shown over time (days). The number and condition of each replicate are indicated by colour. ... 80 Figure 30 Cell concentrations of the second quick adaptation test with Synechococcus RCC2384 over twelve days. The average cell concentrations (per mL, n = 3) with standard deviation for conditions from 100% to 40% osmolarity (indicated by colour) are shown over time (days) in natural logarithm projection of the y-axis. After the 4th day, only the replicates of the control condition (100%) were followed further, apart from the 90% samples on day 10. ... 81 Figure 31 Cell concentrations of the second quick adaptation test with Synechococcus RCC2384 over twelve days. The average cell concentrations (per mL, n = 3) with standard deviation for conditions from 100% to 40% osmolarity (indicated by colour) are shown over time (days). After the 4th day, only the replicates of the control condition (100%) were followed further, apart from the 90% samples on day 10. ... 81 Figure 32 pH values of the second quick adaptation test with Synechococcus RCC2384 over twelve days. The average pH values (n = 3) measured in every condition with standard deviation for conditions from 100% to 40% osmolarity (indicated by colour) are shown over time (days). After the 4th day, only the replicates of the control condition (100%) were followed further, apart from the 90% samples on day 10. ... 82 Figure 33 Cell concentrations of the medium test with Synechococcus RCC2384 over eight days, in conditions ‘oldM’ for ESAW medium prepared with salts from supplier I and ‘newM’ for medium prepared with salts from supplier II (see section 8.3.1). The cell concentrations (per mL) of the duplicates are given separately over time (days) in natural logarithm projection on the y-axis. The number and condition of each replicate is indicated by colour. ... 83 Figure 34 Cell concentrations of the medium test with Synechococcus RCC2384 over eight days, in conditions ‘oldM’ for ESAW medium prepared with salts from supplier I and ‘newM’ for medium prepared with salts from supplier II (see section 8.3.1). The cell
List of Figures
concentrations (per mL) of the duplicates are given separately over time (days). The number and condition of each replicate is indicated by colour. ... 83 Figure 35 Oxygen measurement of 100% ESAW medium over 6 hours in the μRespirometer. The oxygen concentration (% air sat., a), relative intensity (b) and normalised relative intensity (c) recorded by the camera are plotted against time (hours).
Shown here are the values from the five oxygen sensing spots (indicated in the legend) of the microfluidic chip. Pictures were taken every 10 min and the temperature was set to 30 °C. The measurement chamber was illuminated continuously over the course of the measurement (as indicated by the bar at the top) and the light was provided by a red- coloured LED at a current of 50 mA. Four hours after the start of measurement the system was flushed with water with an oxygen concentration of about 5% air sat. ... 84 Figure 36 Oxygen measurement of Synechococcus PCC7002 over 48 hours in the μRespirometer. The relative (a) and normalised relative intensity (b) recorded by the camera are plotted against time (hours). Shown here are the values from the five oxygen sensing spots (indicated in the legend) of the microfluidic chip. Pictures were taken every 10 min and the temperature was set to 30 °C. The measurement chamber was illuminated in a 12:12 hour diurnal cycle from the start of the measurement (as indicated by the bar at the top) and the light was provided by a red-coloured LED at a current of 50 mA. ... 85 Figure 37 Exemplary presentation of the gates used to quantify the number of Synechococcus PCC7942 cells. Shown here is sample 1B at t5 of the growth curve (30%
ESAW pH 8.2)both stained with PI (left), unstained (middle) and sterile medium as a control (right). ... 86 Figure 38 Growth curve of Synechococcus PCC7942 over 17 days. Shown here are the average concentrations (per mL, n = 4) with standard deviations for PCC7942 cells (solid line) and propidium stained particles (dashed line) over time (days) separated by condition. The osmolarity of the medium is indicated by colour. ... 86 Figure 39 Normalised arithmetic means (NAM, signal counts-1) of the phycocyanobilin peaks of Synechococcus PCC7942 plotted against time (days) and ordered by condition (indicated by colour). Shown here are the average values (n = 4) with standard deviations.
... 87 Figure 40 Normalised medians (NM, signal counts-1) of the phycocyanobilin peaks of Synechococcus PCC7942 plotted against time (days) and ordered by condition (indicated by colour). Shown here are the average values (n = 4) with standard deviations. ... 88
List of Figures
Figure 41 Oxygen measurement of Synechococcus PCC7942 over 48 hours in the μRespirometer. The relative (a) and normalised relative intensity (b) recorded by the camera are plotted against time (hours). Shown here are the values from the five oxygen sensing spots (indicated in the legend) of the microfluidic chip. Pictures were taken every 10 min and the temperature was set to 30 °C. The timespans of darkness and illumination are indicated by the bar at the top. The light was provided by a red-coloured LED at a current of 50 mA. ... 89 Figure 42 Oxygen measurement of Synechococcus PCC7942 over 48 hours in the μRespirometer as part of the growth curve (0% ESAW pH 8.2) 4 days after inoculation.
The relative (a) and normalised relative intensity (b) recorded by the camera are plotted against time (hours). Shown here are the values from the five oxygen sensing spots (indicated in the legend) of the microfluidic chip. Pictures were taken every 10 min and the temperature was set to 30 °C. The measurement chamber was illuminated in a 12:12 hour diurnal cycle shifted one hour from the start of the measurement (as indicated by the bar at the top) and the light was provided by a red-coloured LED at a current of 50 mA.
At 43 h and 20 min the system was flushed with water with an oxygen concentration of 3% air sat. (indicated by the arrow on the x-axis)... 90 Figure 43 Oxygen measurement of Synechococcus PCC7942 over 79 hours in the μRespirometer as part of the growth curve (30% ESAW pH 7.0). The relative (a) and normalised relative intensity (b) recorded by the camera are plotted against time (hours).
Shown here are the values from the five oxygen sensing spots (indicated in the legend) of the microfluidic chip. Pictures were taken every 10 min and the temperature was set to 30 °C. The measurement chamber was illuminated in a 12:12 hour diurnal cycle shifted four hours from the start of the measurement (as indicated by the bar at the top) and the light was provided by a red-coloured LED at a current of 50 mA. At 74 h and 10 min the system was flushed with water with an oxygen concentration of 3% air sat. (indicated by the arrow on the x-axis). The data from spots 1 and 5 were removed from the graph for clarity. At 74 h and 10 min the system was flushed with water with an oxygen concentration of 3% air sat. (indicated by the arrow on the x-axis). ... 91 Figure 44 Oxygen measurement of Synechococcus PCC7942 over 79 hours in the μRespirometer as part of the growth curve (30% ESAW pH 7.0). The oxygen concentration (% air saturation) calculated from the intensity of the phosphorescent signal is plotted against time (hours). Shown here are the values from the five oxygen sensing spots (indicated in the legend) of the microfluidic chip. Pictures were taken every 10 min
List of Figures
and the temperature was set to 30 °C. The measurement chamber was illuminated in a 12:12 hour diurnal cycle shifted four hours from the start of the measurement (as indicated by the bar at the top) and the light was provided by a red-coloured LED at a current of 50 mA. At 74 h and 10 min the system was flushed with water with an oxygen concentration of 3% air sat. (indicated by the arrow on the x-axis). ... 92 Figure 45 Oxygen measurement of Synechococcus PCC7942 over 79 hours in the μRespirometer as part of the growth curve (30% ESAW pH 7.0). The relative (a) and normalised relative intensity (b) recorded by the camera are plotted against time (hours).
Shown here are the values from the five oxygen sensing spots (indicated in the legend) of the microfluidic chip. Pictures were taken every 10 min and the temperature was set to 30 °C. The measurement chamber was illuminated in a 12:12 hour diurnal cycle shifted four hours from the start of the measurement (as indicated by the bar at the top) and the light was provided by a red-coloured LED at a current of 50 mA. At 74 h and 10 min the system was flushed with water with an oxygen concentration of 3% air sat. (indicated by the arrow on the x-axis)... 93 Figure 46 Oxygen measurement of Synechococcus PCC7942 over 79 hours in the μRespirometer as part of the growth curve (0% ESAW pH 8.2). The relative (a) and normalised relative intensity (b) recorded by the camera are plotted against time (hours).
Shown here are the values from the five oxygen sensing spots (indicated in the legend) of the microfluidic chip. Pictures were taken every 10 min and the temperature was set to 30 °C. The measurement chamber was illuminated in a 12:12 hour diurnal cycle shifted four hours from the start of the measurement (as indicated by the bar at the top) and the light was provided by a red-coloured LED at a current of 50 mA. At 50 h and 50 min the system was flushed with water with an oxygen concentration of 2.7% air sat. (indicated by the arrow on the x-axis)... 94 Figure 47 Oxygen measurement of 0% ESAW medium over 24 hours in the μRespirometer. The oxygen concentration (% air sat., a), relative intensity (b) and normalised relative intensity (c) recorded by the camera are plotted against time (hours).
Shown here are the values from the five oxygen sensing spots (indicated in the legend) of the microfluidic chip. Pictures were taken every 10 min and the temperature was set to 30 °C. The measurement chamber was illuminated for 20 hours, shifted 4 hours after the start of measurement (as indicated by the bar at the top) and the light was provided by a red-coloured LED at a current of 50 mA. ... 95
List of Figures
Figure 48 Oxygen measurement of 30% ESAW medium over 24 hours in the μRespirometer. The oxygen concentration (% air sat., a), relative intensity (b) and normalised relative intensity (c) recorded by the camera are plotted against time (hours).
Shown here are the values from the five oxygen sensing spots (indicated in the legend) of the microfluidic chip. Pictures were taken every 10 min and the temperature was set to 30 °C. The measurement chamber was illuminated for 20 hours, shifted 4 hours after the start of measurement (as indicated by the bar at the top) and the light was provided by a red-coloured LED at a current of 50 mA. ... 96
List of Tables
List of Tables
Table 1 Condition scheme for the growth curve of Synechococcus PCC7942. The adaptability of the strain to conditions of higher osmolarity and lower pH was monitored over 17 days. The number of the condition is indicated in the respective square... 19 Table 2 Settings for flow cytometry counts with a BD Accuri™ C6 Cytometer (Becton Dickinson, USA), including parameters recorded, excitation and recorded emission as well as the measured fluorophores. The system records forward scatter (FSC) and side scatter (SSC) and fluorescent emission for different wavelength spectra... 21 Table 3 Settings for flow cytometry counts with a CyFlow Cube8 flow cytometer (Sysmex Partec, Germany), including parameters recorded, filters, excitation and recorded emission of the filters, the measured fluorophores as well as the gains and thresholds. The system records forward scatter (FSC) and side scatter (SSC) and fluorescent emission with cut-off filters for specific wavelength spectra... 22 Table 4 Growth rates recorded for Synechococcus PCC7942. Average pH values measured at t0 of the growth curve (n = 4) are given per condition. Average growth rates (day-1, n = 4) from four replicates per condition are given for t0 – t1 (3 days) and for other time-points, which are specified in the fourth column. ... 38 Table 5 Recipe for the salt solution 1 (anhydrous salts) for ESAW medium (Berges et al., 2001; Harrison et al., 1980). The salts were dissolved in ddH2O. The supplier is given for both the Alfred Wegener Institute (I) and for the University of Bremen (II). ... 101 Table 6 Recipe for the salt solution 2 (hydrated salts) for ESAW medium (Berges et al., 2001; Harrison et al., 1980). The salts were dissolved in ddH2O. The supplier is given for both the Alfred Wegener Institute (I) and for the University of Bremen (II). ... 102 Table 7 Stock solutions for major nutrients for ESAW medium (Berges et al., 2001;
Harrison et al., 1980). The dry ingredients were dissolved in ddH2O and sterile filtered (polycarbonate filters with 0.22 μm diameter), prior to storage at 4 °C. 1 or 2 mL of each of the major nutrients was added per litre of ESAW Medium. The supplier is given for both the Alfred Wegener Institute (I) and for the University of Bremen (II). ... 102 Table 8 Composition of the stock solutions for the Iron-EDTA stock solution for ESAW medium (Berges et al., 2001; Harrison et al., 1980). The dry ingredients were dissolved individually in ddH2O and sterile filtered (polycarbonate filters with 0.22 μm diameter), prior to storage at 4 °C. 1 mL of Iron EDTA stock solution was added per litre of ESAW
List of Tables
medium. The supplier is given for both the Alfred Wegener Institute (I) and for the University of Bremen (II)... 103 Table 9 Composition of the trace metal stock solution for ESAW medium (Berges et al., 2001; Harrison et al., 1980). The dry ingredients were dissolved individually in ddH2O and sterile filtered (polycarbonate filters with 0.22 μm diameter), prior to storage at 4 °C.
1 mL of trace metal stock solution was added per litre of ESAW medium. The supplier is given for both the Alfred Wegener Institute (I) and for the University of Bremen (II).
... 103 Table 10 Composition of the vitamin stock solution for ESAW medium (Berges et al., 2001; Harrison et al., 1980). The dry ingredients were dissolved individually in ddH2O and sterile filtered (polycarbonate filters with 0.22 μm diameter), prior to storage at 4 °C.
1 mL of the vitamin solution was added per litre of ESAW medium. ... 104 Table 11 Centrifugation test of Synechococcus RCC2383. Average cell concentrations (per mL, n = 3) and pH (n = 3) are given per condition and time-point. ... 105 Table 12 First quick adaptation test of Synechococcus RCC2384. The average cell concentrations (mL-1, n = 5) are given per condition and time-point. ... 106 Table 13 Second quick adaptation test of Synechococcus RCC2384. Average pH values (n = 3) and average cell concentrations (per mL, n = 3) are given per osmolarity condition and time-point. ... 107 Table 14 Medium test of Synechococcus RCC2384. Cell concentrations (mL-1) per condition and time-point are given in duplicates per conditions. ... 109 Table 15 Average concentrations (per mL, n = 4) of both cyanobacterial cells (PCC7942) and PI stained particles, as well as average pH values (n = 4) recorded during the growth curve of Synechococcus PCC7942 are given per condition and time-point. ... 110 Table 16 Cell concentrations (per mL) of cultures that were measured in the μRespirometer as additional data to the growth curve of Synechococcus PCC7942, are given with the respective time-points of sampling. ... 115 Table 17 Pigment signal strength statistics recorded during flow cytometric counts as part of the growth curve of Synechococcus PCC7942 over 17 days. Average geometric means, arithmetic means and medians (signal counts-1, n = 4) of the phycocyanobilin peak are given per condition and time-point both as raw values and normalised (norm.) for the number of events. ... 116
Abstract – Zusammenfassung
1. Abstract
Cyanobacteria are important primary producers in marine and other aqueous ecosystems.
Members of the genus Synechococcus are globally distributed and exhibit high potential for acclimatisation and adaptation to diverse environmental conditions. The inter-disci- plinary research project Endosymbiont (University of Bremen) proposes to utilize Syn- echococcus for the establishment of novel biomedical therapies based upon survival and growth under human physiological conditions. The main objective of the project is to successfully introduce living cyanobacterial cells into human keratinocytes (epidermal skin cells) in a quasi-stable functional coexistence. Such photosynthetic, endosymbiotic cells would then be able to produce oxygen and consequently promote wound healing in tissues with impaired perfusion.
In this work, one marine and one freshwater strain of Synechococcus were characterised with respect to their short-term growth and tolerance to different culturing conditions, such as temperature, pH and salinity ranges mimicking certain aspects of the cytosol of human keratinocytes. The marine strain Synechococcus sp. RCC2384 (Red Sea) was not able to grow at salinities lower than 100% of the artificial seawater medium. The fresh- water strain Synechococcus sp. PCC7942 showed sufficient tolerance to selected osmotic conditions, with growth rates between 2.4 ± 0.64 day-1 (0% salinity), 1.7 ± 0.23 (10%), 2.6 ± 0.51 (20%) and 0.84 ± 0.3 day-1 (30%) during initial exponential growth at 30 °C.
The pH that the medium was initially adjusted to had no effect on the actual pH measured in the cultures presumably due to the reduced carbonate buffer system in medium of lower salinity. However, the pH at time t0 had significant effects on the subsequent growth rates (t0 – t1), and the pigment signal strength at t1. This indicated a pH sensitivity regarding growth and physiological health that could not be fully evaluated for targeted pH values in this work. Nevertheless, a more acidic pH at t0 led to higher growth rates and lower pigment fluorescence when normalised to cell concentrations. The osmotic condition likely had an indirect effect on both parameters by widening the possible pH range. Due to the adaptability shown here for Synechococcus sp. PCC7942 for osmotic concentration and pH range from below pH 7.0 up to pH 10.0, the strain emerges as the ideal candidate for potential future medical application.
Abstract – Zusammenfassung
Cyanobakterien sind wichtige Primärproduzenten in marinen und anderen aquatischen Ökosystemen. Spezies der Gattung Synechococcus sind global verbreitet und zeigen ein hohes Potential für Anpassung an diverse Umweltbedingungen. Das inter-disziplinäre Forschungsprojekt Endosymbiont (Universität Bremen) bezweckt Synechococcus für eine neuartige medizinische Therapiemethode zu verwenden, basierend auf Wachstum und Sauerstoffproduktion der Cyanobakterien unter human-physiologischen Bedingun- gen. Ziel des Projektes ist es, lebende Synechococcus Zellen in menschliche Keratinozy- ten (Hautzellen der Epidermis) aufzunehmen und eine quasi-stabile, funktionelle Koexis- tenz zu etablieren. Solch photosynthetische und endosymbiotische Zellen wären dann in der Lage Sauerstoff durch Photosynthese zu produzieren und dadurch die Wundheilung in Geweben mit beeinträchtigter Perfusion zu fördern.
In dieser Arbeit wurden ein mariner und ein Süßwasser Stamm von Synechococcus hin- sichtlich ihrer kurzzeitigen Adaptationsfähigkeit an verschiedene Kulturbedingungen un- tersucht, so wie Temperatur, pH und Salinität, die einige Aspekte des Zytosols von menschlichen Keratinozyten nachahmen. Der Rote Meer Stamm Synechococcus sp.
RCC2384 war nicht fähig in Medium von einem Salzgehalt weniger als 100% des artifi- ziellen Meerwasser Mediums zu wachsen. Dagegen zeigte der Süßwasser Stamm Sy- nechococcus sp. PCC7942 hinreichende Toleranz zu ausgewählten Osmotischen Kon- zentrationen mit Wachstumsraten zwischen 2.4 ± 0.64 Tag-1 (0% Salzgehalt), 1.7 ± 0.23 (10%), 2.6 ± 0.51 (20%) und 0.84 ± 0.3 Tag-1 (30%) während der anfänglichen Phase ex- ponentiellen Wachstums bei 30 °C. Der pH zu dem das Medium eingestellt wurde hatte keinen Einfluss auf den tatsächlich gemessenen pH, vermutlich durch das reduzierte Car- bonat Puffer System in Medium mit geringem Salzgehalt. Der pH am Zeitpunkt t0 hatte dennoch einen signifikanten Effekt auf die darauffolgenden Wachstumsraten (t0 – t1), und die Signalstärke der Pigmente an t1. Dies zeigte eine pH Sensitivität von Wachstum und physiologischer Gesundheit die in dieser Studie nicht vollständig für gezielte pH Bedin- gungen untersucht werden konnte. Ein saurer pH an t0 führte zu höheren Wachstumsraten und niedrigerer Pigment Fluoreszenz, wenn auf die Zellzahlen normalisiert wurde. Der Salzgehalt des Mediums hatte vermutlich einen indirekten Einfluss auf diese Parameter da er die mögliche pH Bandbreite bestimmte. Aufgrund der hier demonstrierten Adapta- tion von Synechococcus sp. PCC7942 an eine weite Bandbreite an osmotische Bedingun- gen und eine pH Toleranz von unter pH 7.0 bis zu pH 10.0, erscheint der Stamm als ein idealer Kandidat für weitere Forschung hinsichtlich möglicher medizinischer Anwen- dung.
Introduction
2. Introduction
2.1. Cyanobacteria in Aqueous Ecosystems
Cyanobacteria are key primary producers in aquatic ecosystems. While the diversity of cyanobacteria is high in freshwater environments, marine systems are dominated by only two genera: Procholorococcus and Synechococcus (Jakubowska & Szeląg-Wasielewska, 2015). These two alone are estimated to contribute 25% of the ocean net primary produc- tion (Flombaum et al., 2013). As one of the more ancient forms of life, cyanobacteria are linked to many critical events in earth history, such as the Great Oxygenation Event and the evolution of endosymbiosis and eukaryotic organisms (Ribeiro et al., 2018). Never- theless, the term cyanobacteria is a rather loose descriptor for a range of bacteria that are characterised by their ability for oxygenic photosynthesis and for having chlorophyll a as well as phycobiliproteins as their primary pigments (Castenholz et al., 2001). The clash of microbiological and botanical taxonomy and classification has led to varying estimates of cyanobacterial diversity. However, the advancement of genomics has enabled a more thorough characterisation of cyanobacteria (Ribeiro et al., 2018).
Cyanobacteria are ubiquitous in nature; however, they do have patterns of occurrence. In contrast to Prochlorococcus, Synechococcus has a wide geographic distribution and can be found in pelagic environments as well as coastal and subpolar regions. This adaptabil- ity is thought to be the consequence of the larger genome of Synechococcus relative to Prochlorococcus (Berube et al., 2018). Synechococcus cells are described as unicellular, rod to coccoid in shape, < 3 μm in diameter and able to divide by binary fission from one plane (Robertson et al., 2001). Although considered a genus, evidence suggests that the taxon is polyphyletic and may include numerous sub groups or even genera; for instance, Robertson et al. (2001) described 6 or 8 distinct groups with different phylogenetic mark- ers.
Introduction
2.1.1. The Photosynthetic Apparatus of Cyanobacteria
In general, the growth of microorganisms is controlled by the three major environmental factors light, temperature and nutrients (Malinsky-Rushansky et al., 2002). For photoau- totrophic organisms, the energy for growth is supplied by light. In contrast to algae and higher plants, the light-harvesting antennae of cyanobacteria are located on the cytoplas- mic surface of the thylakoid membrane (Mackey et al., 2013a) (Figure 1). The additional light harvesting antenna, the phycobilisome (PBS), is comprised of macromolecular com- plexes that form rods around a core of allophycocyanin (APC) (Six et al., 2007). In the conserved core, APC binds to the chromophore phycocyanobilin (PCB; Amax = 620 nm;
Figure 2). The rods contain phycobiliproteins that bind chromophores (phycobilins) via thioether bonds to cysteinyl residues.
Figure 1 Schematic figure of the photosynthetic apparatus and the electron flow in cyanobacteria (taken from Mackey et al. (2013b)). Chemical reactions are shown in blue and the pathway of electrons is shown in black. The phycobilisome (PBS) is associated with Photosystem II (PSII). Light energy is captured by chlorophyll-a in the PSII as well as phycoerythrin (PE), phycocyanin (PC) and allophycocyanin (APC) in the PBS. From the PSII electrons are transferred to the plastoquinone (PQ)/plastoquinol (PQH2) pool, to cytochrome b6f (Cyt b6f), to plastocyanin (PLC), to the PSI, to ferredoxin and flavodoxin (FX, FL) in that order. Finally, the ferredoxin/flavodoxin NADP reductase (FNR) creates reducing equivalents, that are fur- ther processed in the Calvin-Benson Cycle.
Introduction
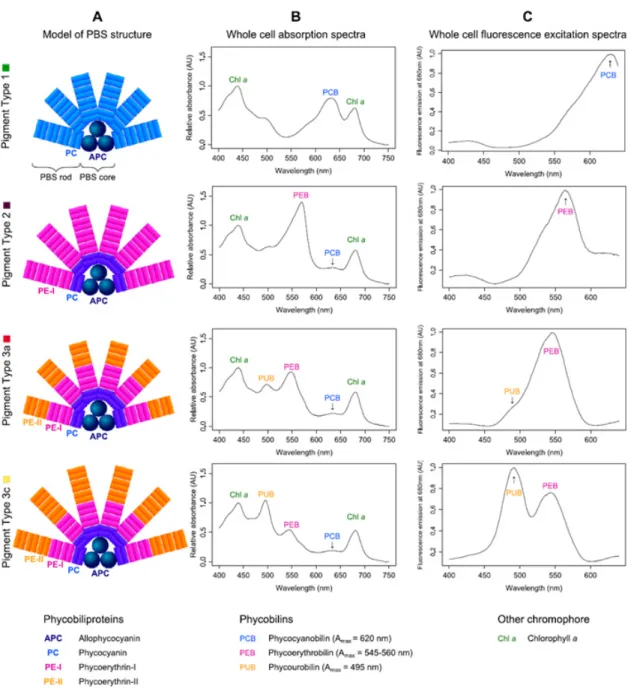
The proteins themselves are water-soluble and consist of two subunits organized in either trimeric or hexameric discs (Six et al., 2007). The composition of the rods is variable and three pigment types are usually distinguished. In the first type, the rods are composed only of phycocyanin (PC) and the chromophore PCB (Amax = 620 nm) (Grébert et al., 2018b). In type 2, the rods are composed of both PC and phycoerythrin I (PE-I), the chro- mophore phycoerythrobilin (PEB; Amax = 545 - 560 nm) binds to the latter protein. Most marine strains are grouped into the third type, where the rods are composed of PC, PE-I and -II with the chromophores PCB, PEB and phycourobilin (PUB; Amax = 495 nm), the
Figure 2 Schematic figures of the pigment complexes and absorption spectra of the major phycobilisome types of Synechococcus: composition (A), whole-cell absorption spectra (B) and whole-cell fluorescence spectra after excitation with 680nm (C) (taken from Grébert et al. (2018a).
Introduction
latter of which binds to PE-II. Subtypes of pigment type 3 are classified by the ratio of PUB:PEB into green-light specialists (3a), intermediate (3b), blue-light specialists (3c) as well as those with adaptable phycobilisomes (3d) (Grébert et al., 2018b) (Figure 2). As a consequence of the unique characteristics of the cyanobacterial photosystem, adjust- ments are necessary when traditional parameters of photosynthetic health such as the ef- ficiency of photosystem II (FV/FM or ΦPSII) are measured, which were first developed for higher plants.
2.2. Impact of Climate Change on Cyanobacteria
The adaptive capabilities of Synechococcus will be necessary in order to cope with the changes brought on by climate change. Predictions foresee dramatic impacts on marine ecosystems based on the interactions between global warming, ocean acidification and the spreading of oxygen minimum zones. For instance, sea surface temperatures are ex- pected to have risen 1 - 7 °C by the year 2100 (Houghton et al., 2001). Moreover, the rising atmospheric partial pressure of carbon dioxide (pCO2) is expected to lead to a de- crease in pH in surface waters from pH 8.1 to 7.8 by the year 2100 (Houghton et al., 2001). A stable, slightly alkaline pH is of high importance for many marine organisms, as an increase in pCO2 causes an imbalance in the carbonate system (1):
1 + ⇌ ⇌ + ⇌ + 2
Dissolved carbon dioxide, reacts with water molecules and forms carbonic acid (H2CO3) which dissociates into protons and bicarbonate (HCO3-). Additional protons are buffered by carbonate (CO32-) to form bicarbonate (Chou et al., 2013). Ocean acidification leads to an increase in dissolved carbon dioxide, consequently increasing the concentration of bicarbonate and hydrogen ions and leading to a decrease of carbonate and pH (Chou et al., 2013). Furthermore, the increased amount of dissolved inorganic carbon (DIC) will have impacts on the carbon cycle. High CO2 concentrations have been shown to cause a shift in the carbon to nitrogen ratios towards higher carbon percentage in the biomass of planktonic species (Doney et al., 2009). Therefore, the export of biological carbon into the deep sea would become more efficient whereas the food quality for higher trophic levels would decrease (Doney et al., 2009).
Introduction
Coastal waters naturally undergo fluctuations in pH; however, the interaction between eutrophication, ocean acidification and the loss of buffer capability may exaggerate the decrease in pH. Cai et al. (2011b) measured annual patterns of hypoxia and lowered pH, starting in spring with increasing stratification in estuaries in the East China Sea and the Gulf of Mexico (Figure 3). The decrease in pH and the decline in O2 were positively correlated, due to the physical separation between primary production and respiration.
Excess dissolved inorganic carbon and nutrient input from the river in the euphotic zone, increased organic matter export into the deeper layer. Moreover, the interplay between the imbalance of the carbonate equilibrium and the organic matter respiration accelerated the decrease in pH (Cai et al., 2011b) Another hydrographic study conducted off the west coast of the USA (Feely et al., 2008), showed the large-scale upwelling of carbonate un- dersaturated water masses with low pH. Without anthropogenic carbon input, carbonate saturation increased in the model.
Figure 3 A conceptual model for a large river plume eutrophication, subsurface water hypoxia and acidifi- cation based on studies in the Gulf of Mexico and the East China Sea (taken from Cai et al. (2011a)).
Introduction
2.3. Biotechnological Application of Cyanobacteria
2.3.1. State of the ArtIn light of predictions of future food shortages with an ever-growing world population, cyanobacteria have caught a lot of attention as potential sources of nutrition. In contrast to traditional food sources, microalgae and cyanobacteria need very little nutrients and very little space while showing high productivity (Singh et al., 2017). Several genera such as Spirulina sp., Nostoc sp. and Aphanothece sp. are already being used as sources of carbohydrates, lipids, proteins, pigments, vitamin, phenolics, minerals and other com- pounds (Kumar et al., 2016)
Furthermore, cyanobacterial toxins could have potential applications as herbicides, anti- microbials and pesticides (Singh et al., 2017). Other future uses for secondary metabolites could include preventing biofouling (Brown et al., 2004; Dahms et al., 2006), in waste- water treatment (Khan et al., 2019; Werkneh & Rene, 2019) and as biofertilizers (Khan et al., 2019; Rai et al., 2019). Moreover, cyanobacteria could help support future energy demands by producing biohydrogen (Bandyopadhyay et al., 2010; Show et al., 2019), bioethanol (Gao et al., 2012), biodiesel (Karatay & Dönmez, 2011; Wahlen et al., 2011) and biogas (Chynoweth, 2005; Converti et al., 2009) on a large scale with limited re- sources (Parmar et al., 2011). Key components of biofuels such as hydrocarbons and fatty alcohols are already being produced by photosynthesis and production could be enhanced by genetic modification (Tan et al., 2011).
2.3.2. Medical Application
In addition to applications in energy and nutrient production, cyanobacteria could also be employed in human medicine. Diverse species and strains of cyanobacteria have been shown to exhibit anti-bacterial (Fatima et al., 2017; Martins et al., 2008; Pushparaj et al., 1998), anti-fungal (Pushparaj et al., 1998; Soltani et al., 2005), anti-viral (Koharudin &
Gronenborn, 2011; Yasuhara-Bell et al., 2010), anti-cancerous (Caro-Diaz et al., 2019;
El Semary & Fouda, 2015; Gerwick et al., 1994) and immunosuppressive activity (Gunasekera et al., 2016; Koehn et al., 1992; Singh et al., 2017). For instance, the phy- cobiliprotein c-phycocyanin has been shown to have anti-oxidant, anti-inflammatory as well as neuroprotective effects (Romay et al., 2003). Specific classes of molecules of interest include cyanobacterial phenols, fatty acids, terpenoids, carotenoids, lutein, zea-
Introduction
and cryptoxanthin, scytonemin, halogenated compounds, phytohormones and toxins (Singh et al., 2017).
Recently, Cohen et al. (2017) reported the successful application of Synechococcus for mammalian health benefit in a more direct approach. Instead of relying on compounds produced by the cyanobacteria, Synechococcus elongatus PCC7942 was co-cultured with primary rat cardiomyocytes (heart muscle cells) at optimal conditions for the mammalian cells during which photosynthesis was recorded (Cohen et al., 2017). Furthermore, the effect of cyanobacterial injections in cases of acute myocardial ischemia (restriction of blood supply) was tested on a rat model. The presence of S. elongatus significantly in- creased the oxygen tension in the heart tissues (Cohen et al., 2017). Moreover, the surface temperature of Synechococcus treated tissue increased over time, indicating metabolic activity, and cardiac function improved compared to the controls. Cohen et al. (2017) also simulated reperfusion after induced myocardial ischemia with and without direct injection of S. elongatus into the hearts of rats. The injection significantly reduced molecular mark- ers of myocardial injury and cardiac function was improved. Furthermore, Synechococcus did not induce a host immune response and the majority of cyanobacterial cells had dis- appeared from the tissue 24 hours after injection (Cohen et al., 2017).
However, the treatment of heart tissue with cyanobacteria has the obvious drawback that the treated tissues would need to be exposed to light in order to facilitate photosynthesis.
This carries with it the obvious risk of infections in the open wound. Cohen et al. (2017) proposed testing an alternate strain of cyanobacteria that synthesize chlorophyll f, a newly discovered pigment that absorbs light in the infrared spectrum (Chen et al., 2010) to fa- cilitate the transfer of light energy through closed chest cavities (Cohen et al., 2017).
Nevertheless, the necessary exposure to light will always be an issue for the treatment of internal organs. Therefore, taking these concepts and technologies and applying them to skin, the natural barrier between the human body and the environment, is the logical next step.
Introduction
2.3.3. The Human Epidermis & Wound Healing
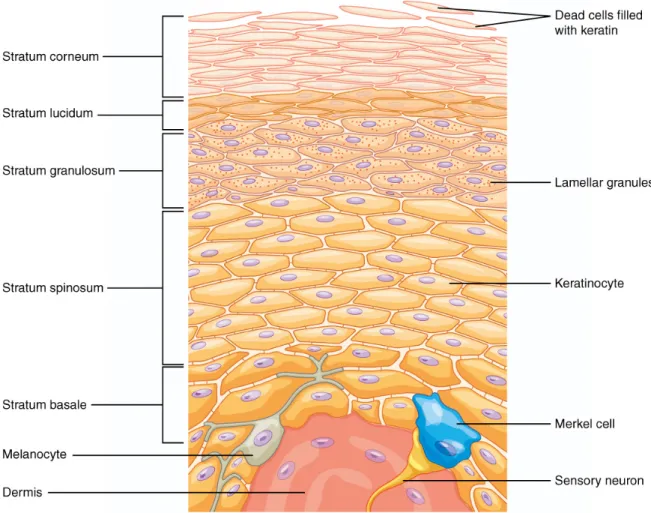
Mammalian skin can be divided into three distinct layers, the epidermis, dermis and the hypodermis. The hypodermis or subcutis is the basal layer of the skin, containing mostly fat cells that form a cushion against physical force (Shimizu, 2017). Moreover, the dermis contains structural components, largely collagen and elastic fibres, which provide strength and flexibility to the tissue. The matrix of the dermis retains water and forms the support structure for cells and the other elements of the dermis including hair follicles, blood vessels and nerve endings (Weller et al., 2008). The outermost layer of mammalian skin is the epidermis, consisting mainly of keratinocytes in different stages of maturation (Figure 4). New cells are formed at the basal layer derived from epidermal stem cells and migrate towards the stratum spinosum where keratinocytes stop mitosis and start differ- entiation and the synthesis of keratin (Weller et al., 2008). When the keratinocytes reach the uppermost layer of the epidermis, the stratum corneum, the keratin network collapses, thus flattening the cells (Shimizu, 2017). Eventually the keratinocytes die, due to being
Figure 4 Schematic diagram of the structural components of the mammalian epidermis (taken from OpenStax College (2018)).
Introduction
cut off from nutrient supply and form layers of dead keratinocytes (corneocytes) into a relatively impermeable barrier (Weller et al., 2008). Melanocytes in the stratum basale form appendages that supply surrounding keratinocytes with melanin in the form of ves- icles. Melanin is a hydrophobic, dark brown pigment that is synthesized to protect skin cells from UV-radiation (Sobotta & Welsch, 2006).
The main purpose of skin is the protection from the environment, be it desiccation, toxins or pathogens. When the skin is damaged, this barrier between the organism and the envi- ronment needs to be restored quickly. This process occurs in three phases; the initial in- flammatory phase is followed by the proliferative and maturational phase (Sinno &
Prakash, 2013). In the inflammation response further blood loss is reduced and a blood clot is formed in the wound bed providing an extracellular matrix for the release of cyto- kines and growth factors (Landen et al., 2016). In the proliferation phase, the epidermis is reformed by cells migrating up from the stratum basale or from stem cells around sweat glands and hair follicles in the surrounding tissue (Lau et al., 2009). Simultaneously, new blood vessels are formed (angiogenesis) from cells in undamaged tissue areas (Landen et al., 2016). In the final remodelling or maturational phase, a scar is formed, that is to say, new skin that has no hair follicles or glands as well as a different collagen pattern than intact skin (Sorg et al., 2017).
Disruption of the wound healing process can have severe consequences. Chronic and hard or slow-healing wounds are associated both with long-term physical and psychological effects (Kinmond et al., 2003; Posnett & Franks, 2007; 2008) as well as high costs for health services (Geraghty & LaPorta, 2019; Nunan et al., 2014). Most chronic wounds are the result of restricted blood supply in the affected tissue (Nunan et al., 2014). Their annual cost of treatment is estimated to account for 2 - 5% of the annual healthcare budget in industrial countries (Phillips et al., 2016; Posnett & Franks, 2007; Sen et al., 2009).
The pH of the skin is naturally acidic with a pH of 4 – 6. However, leakage from cells and microvessels leads to a rise of the pH in the wound bed to approximately pH 7.4 with increasing values towards the deepest point of the wound (Kruse et al., 2017). In contrast to actively healing wounds, chronic wounds are characterised by an alkaline pH in the wound bed, which offers less protection against microorganisms than an acidic one (Percival et al., 2014; Schneider et al., 2007). The secretion of ions and organic com- pounds from cells in order to maintain extracellular pH is controlled by calcium, which
Introduction
forms a gradient of increasing concentration from the stratum basale up to the stratum granulosum (Rinnerthaler & Richter, 2018). As a person ages, this calcium gradient de- creases leading to a rise in the external pH in the epidermal layer. Along with changes to the structure of the cornified envelope (Rinnerthaler et al., 2013) this weakens the pro- tective ability of the epidermis and may further impede wound healing in old age (Rinnerthaler & Richter, 2018).
Currently, open wounds are treated by covering the affected area with skin grafts taken from other areas of the patient’s body. However, this method often leads to adverse effects in the area of the donor site (Priya et al., 2008; Sorg et al., 2017). New approaches aim to substitute skin with biogenic or artificial materials (Zhong et al., 2010), apply artificial growth factors (Tenenhaus & Rennekampff, 2016), or to genetically modify the wound bed (Priya et al., 2008; Sorg et al., 2017). Nevertheless, these new concepts are yet to be applied in standard treatments (Tenenhaus & Rennekampff, 2016).
A novel experimental therapy approach aims to introduce cyanobacteria into human keratinocytes to produce photosynthetic keratinocytes in a stable endosymbiotic system (Mirastschijski et al., 2018). These endosymbiotic keratinocytes could then provide their own oxygen supply which would ideally trigger proliferation. A strategy for the potential direct uptake of cyanobacteria into keratinocytes has already been established within the Endosymbiont project. However, a suitable photoautotrophic cyanobacterium for the gen- eration of an endosymbiotic keratinocyte still needs to be selected and characterised.
2.3.4. Ecophysiological Requirements of an Endosymbiont
In order to generate functional endosymbiotic keratinocytes, cyanobacterial cells would need to be able to withstand the highly specialized conditions in the human cytosol. The internal pH (pHi) of human epidermal keratinocytes is expected to be around pH 7.4 (Kleszczyński et al., 2013). Average values for the cytoplasm, nucleus and endoplasmic reticulum of eukaryotic cells have been reported to be around pH 7.2 7.4 (Theillet et al., 2014). The cytosol of eukaryotic cells also includes a variety of molecules and ions dis- solved in water, including inorganic ions, metabolites, proteins and structural components which all contribute to the osmotic pressure inside of the cell. The osmotic concentration per volume, or osmolarity, of human blood and human blood serum is around 287 - 289 mOsM (Hendry, 1961; Rocks et al., 1986). In this project the expected
Introduction
extracellular osmotic pressure was taken as a proxy for intracellular osmotic pressure, as co-cultures of cyanobacteria and human keratinocytes would need to be attempted before an insertion could be possible. The osmolarity of seawater is generally around 1000 mOsM, depending on the local composition and ratio of the salts, therefore, marine strains of Synechococcus would have to be able to adapt to much lower osmotic pressures than those present in their natural environment.
Furthermore, the potential endosymbionts would need to be functional at ambient tem- peratures around 30 °C. As homeothermic animals, humans maintain a constant core tem- perature of ca 37 °C, however, heat is also lost over the skin to the environment. The skin surface temperature is highly variable and mainly depends on the location on the body, e.g. the temperature is lower at the extremities than on the torso. Moreover, underlying muscles contribute more heat than bones or tendons, another important factor is the num- ber of blood vessels in the area, as arteries contribute more than veins (Bierman, 1936).
Skin surface temperatures have been reported as e.g. between 31 – 33.5 °C (Yosipovitch et al., 1998) and < 24 °C to < 36 °C (Rubinstein & Sessler, 1990). It has been reported that burn wounds emit heat and are ca. 0.1 – 0.2 °C warmer than the surrounding intact skin tissue (Boylan et al., 1992).
Therefore, a suitable candidate strain for the generation of endosymbiotic keratinocytes would need to be able to cope with highly specific conditions including temperatures of ca. 30 °C, pH 7.0 – 7.4 and osmolarity of around 290 mOsM. The genus Synechococcus was selected based on its wide geographic distribution (Berube et al., 2018) and therefore potential for adaptability to these specific conditions which would not be common in na- ture except potentially in estuarine systems if several factors acted collectively.
2.3.5. Candidate Strains of Synechococcus
Three candidate strains of Synechococcus were selected based on the available literature and will hereafter be referred to by their strain number. Synechococcus sp. RCC2384 was first sampled at the Gulf of Aqaba on the coast of the Red Sea in Israel in 1999 and is also known as clonal strain RS9912 (Vaulot et al., 2004). To date few published papers are available characterizing the strain, although the pigment type has been classified as 3a marking the strain as a green-light specialist with phycoerythrin as the main accessory pigment (Vaulot et al., 2004).
Introduction
Synechococcus sp. PCC7002 was first isolated on Magueyes Island, Puerto Rico in 1961 (Rippka, 2019), the strain is not considered marine due to its origin from a fish pen. Fur- thermore, PCC7002 has been described as having a phycobilisome of pigment type 1 (red-light maximum), containing only phycocyanin which is typical for coastal strains (Grébert et al., 2018b; Mackey et al., 2017). PCC7002 has displayed a remarkable adapt- ability to a variety of environmental conditions, from N-limited conditions (Marañón et al., 2018), to a variety of salinity conditions (Castenholz et al., 2001) to temperatures from 20 °C up to 38 °C (Ludwig & Bryant, 2012; Xu et al., 2013; Zhu et al., 2010). The strain is also considered to be pH-tolerant to an extent, being able to grow in pH at least as low as pH 7.82 (Mou et al., 2017). In general, the strain is a model organism for Syn- echococcus due to its high growth rates and tolerance of high irradiance levels (Bernstein et al., 2014). Thus, many genomic sequences and transcriptome databases are available for the strain (Ludwig & Bryant, 2012; Vijayakumar & Angione, 2017; Yang et al., 2015).
Synechococcus sp. PCC7942 is likewise grouped to pigment type 1 (Collier & Grossman, 1992). However, PCC942 is considered a freshwater strain and was isolated from a lake in California, USA in 1973 (Rippka, 2019). Members of the Synechococcus cluster 1.1 are generally referred to Synechococcus elongatus (Rippka & Cohen-Bazire, 1983). Un- der its former name Anacystis nidulans R2, the strain was the first cyanobacterium in which transformation with exogenous DNA could reliably be shown (Shestakov &
Khyen, 1970). More recently, the metabolism of the strain was successfully manipulated towards increased O2 production (Shih et al., 2014) and increased production and secre- tion of glucose and fructose (Niederholtmeyer et al., 2010). Moreover, PCC7942 has been employed as a model organism for research into the prokaryotic circadian clock (Golden et al., 1998). PCC7942 has also been shown to grow at temperatures around 30 °C under standard conditions (Billini et al., 2008; Blondin et al., 1993; Kuan et al., 2015; Ladas &
Papageorgiou, 2000b) and within a range of 20 - 51 °C in temperature shock treatments (Billis et al., 2014; Blondin et al., 1993; Porankiewicz et al., 1998). Furthermore, adapt- ability of PCC7942 to pH and salinity has been shown from pH 7.0 - 9.0 and up to 0.4 M NaCl (Billini et al., 2008; Billis et al., 2014; Ladas & Papageorgiou, 2000b).
In addition to the broad tolerance to a variety of environmental factors and the potential for genetic modification, recent positive findings in the co-cultivation of PCC7942 with rat cardiomyocytes and as a treatment for acute myocardial ischemia and reperfusion in- jury (Cohen et al., 2017) strongly indicate that this strain of Synechococcus has the