Hertie School of Governance - Working Papers, No. 62, August 2011
Extending Coverage of the New Pension Scheme in India Analysis of Market Forces and Policy Options
Simone Stelten
Hertie School of Governance
This Working Paper by Simone Stelten is her Master of Public Policy thesis, submitted in April 2011. She graduated at the Hertie School of Governance in May 2011. The thesis is a study of the (voluntary) New Pension Scheme which was launched by the Government of India in May 2009 in an effort to increase pension coverage, particularly in the informal sector of the economy. Although she admits that it is perhaps still early to assess the status of this scheme, she asks the question why so few (only 0.04 percent of the total workforce) so far have taken up this insurance. The number lags far behind the potential, it is claimed. Why has the scheme attracted so few new subscribers, and which public policy solutions can increase the enrollment rate?
Simone Stelten’s thesis is very well-structured, -researched and –documented. Simone Stelten succinctly presents the scope and relevance of the study, and the approach and methodology before providing a theoretical and analytical framework for the study. The empirical analysis focuses on the pension demand and supply sides, and discusses the low coverage of pension subscribers in light of the mismatch of supply and demand.
Based on findings and discussions, she provides a number of well-motivated recommendations as to how the coverage of the New Pension Scheme can be increased.
The study was thought out and developed under the supervision and guidance of Robert J. Palacios, Department of Social Protection of the World Bank.
Stein Kuhnle
Professor of Comparative Social Policy Thesis supervisor
ii
Extending Coverage of the New Pension Scheme in India
Analysis of Market Forces and Policy Options
Simone Stelten
s.stelten@mpp.hertie-school.org
Master’s Thesis
Master of Public Policy Class of 2011
Academic advisor:
Professor Dr. Stein Kuhnle Professor of Comparative Social Policy
Hertie School of Governance Working Institution:
The World Bank
Department of Social Protection Under the supervision of Robert J. Palacios
HERTIE SCHOOL OF GOVERNANCE
Berlin, April 2011
Executive Summary
India has one of the world’s fastest growing economies, but it also has vast structural problems that hinder the country’s socioeconomic development. Most jobs are generated in the informal sector, where more than 80 percent of all workers are employed. Most Indians lack financial resources for retirement and rely on their families, whereas the family is becoming a less reliable source of support in old age due to decreasing fertility and the increasing mobility of the young. Longevity has increased rapidly, while people over 60 years of age are the fastest growing age cohort. Thus, there is a strong need to increase pension coverage for the population that largely consists of informal sector workers.
The New Pension Scheme (NPS) was launched by the Government of India in May 2009 to increase pension coverage, particularly to the informal sector. NPS is a voluntary defined contribution scheme, which is distributed through licensed private sector institutions. The Pension Fund Regulatory and Development Authority (PFRDA) in 2010 introduced two further reforms to increase coverage: the “Swavalamban”
subsidy for poor workers, and NPS-Lite, which is a means of conducting group enrollments. NPS is distributed through “Points of Presence” (PoPs), which are financial sector institutions, including banks and insurance companies. NPS-Lite is distributed through “aggregators”, which are local institutions including NGOs and self- help groups. The current number of 167,002 voluntary subscribers lags far behind its potential. Against this backdrop, the study addresses two research questions. First, why has the NPS approach attracted so few new subscribers until now? Second, which public policy solutions can increase the NPS enrollment rate?
The NPS market forces are at the center of the analysis. The study develops its own theoretical framework that consists of a set of criteria to assess the (mis-)match of demand and supply to explain where policy options should be better targeted to address the current low enrollment rates. This study identifies four reasons for low coverage, which show a comprehensive picture of policy shortcomings in terms of all criteria. The scheme does not satisfy the demand for secure financial investments; its legal status and institutional architecture question the long-term stability of scheme and investments;
there are severe shortcomings in the management of the scheme’s distribution channels, and a targeted marketing strategy has not been developed, which is necessary to attract the population.
This study proposes a policy package of seven short- and long-term measures to increase NPS coverage. The most immediate and largest effects should result from two measures – improving the incentives for the PoPs and developing a targeted pull- marketing strategy. The potential of the proposal is to increase coverage up to 40 million in the medium run (5 years) and there is a vast market of 100 to 130 million persons with sufficient savings capacities in the long run.
iv
T
ABLE OFC
ONTENTSExecutive Summary ... iii
List of Figures ... v
List of Tables ... v
List of Abbreviations ... vi
I. Introduction ... 1
I.1 Scope and Relevance ... 2
I.2 Approach and Methodology ... 3
I.3 Structure of the Paper ... 4
II. Theoretical and Analytical Framework for the Study of Pensions in LDC ... 5
II.1 Framework to Analyze Coverage Gaps of DC Pensions in LDC ... 7
II.2 Development of the Public Pension System in India ... 12
II.3 A Statistical Picture of the Policy Problem ... 16
III. Market Forces of the NPS ... 18
III.1 The Demand for Pensions in India ... 18
III.2 The NPS Supply Side ... 31
III.3 Mismatch of Supply and Demand: Reasons for Low Coverage ... 41
IV. Matching Demand and Supply: Recommendations to Increase NPS Coverage . 44 V. Conclusion ... 49
Bibliography ... 52
Appendix ... 59
1) List of Interview Partners ... 59
2) Characteristics of Potential Customers in Market Segments 1 & 2 ... 62
3) Summary View of Market Segment 1 ... 64
4) Small Retailing Businesses in Market Segment 1: ... 65
5) State Distribution of Key Occupations in Market Segments 1 & 2 ... 66
6) Subscribers Registered under NPS as of 7 February 2011... 67
7) Development of Real Wages per day of Regular Workers ... 67
8) Real Wages of Casual Workers ... 68
9) Risk Perceptions of Latent Demand ... 69
10) List of PFMs and PoPs as of December 2010 ... 70
11) List of Appointed Aggregators as of March 2011... 71
12) PFRDA Flyer to Promote NPS ... 72
13) Fees and Charges for NPS and NPS-Lite Accounts ... 75
List of Figures
Figure 1: Population of India by age and sex: 1997 and 2020 ... 18
Figure 2: Trends in life expectancy at birth by wealth quintiles ... 19
Figure 3: Potential NPS market share based on labor market status ... 21
Figure 4: Annual savings capacities ... 22
Figure 5: Potential NPS market segmentation based on savings capacities ... 23
Figure 6: Occupations in market segment 1 ... 25
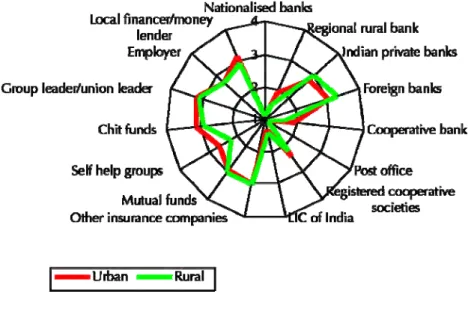
Figure 7: Degree of confidence in financial institutions ... 29
Figure 8: Acceptability of NPS features ... 30
List of Tables
Table 1: Coverage of pension schemes in India (various years) ... 16Table 2: Number of NPS subscribers as of 12 March 2011 ... 17
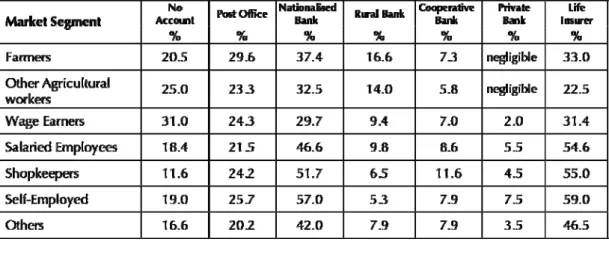
Table 3: Relations of potential NPS customers in market segments 1 and 2 with other financial institutions ... 28
Table 4: Incentive scheme for aggregators ... 35
vi
List of Abbreviations
A.
ADB
Appendix
Asian Development Bank ASP Annuity Service Provider BPL Below Poverty Line CRA Central Recordkeeping
Agency
DB Defined Benefit
DC Defined Contribution EPF Employee Provident Fund EPFO Employees Provident
Fund Organisation EPS Employees Pension
Scheme
GIZ Deutsche Gesellschaft für Internationale
Zusammenarbeit GoI Government of India IFMR Institute for Financial
Management and Research
IIEF Invest India Economic Foundation
IIMS Invest India Market Solutions Private Ltd.
IISS India Income and Savings Survey
INR Indian Rupee
IRDA Insurance Regulatory and Development Authority MFI Microfinance Institution MoF Ministry of Finance LE(0) Life expectancy at birth LE(30) Life expectancy at age 30 LDC Less Developed Countries LIC Life Insurance
Corporation of India MoHF Ministry of Health and
Family Welfare MoLE Ministry of Labour and
Employment
NCEUIS National Commission for Enterprises in the
Unorganized Sector
I. Introduction
If an emerging economy like India wants to foster “sustainable and inclusive growth”, fight poverty, and reduce inequalities (Planning Commission 2008), its government needs to provide a social safety net for its population. Otherwise, people will fall back into poverty again and again because of substantial income reductions due to social risks, including sickness, employment injury, and old age (Krishna 2010). Yet how can a country like India, which struggles with an increasing informal sector1, a poorly educated, non-registered and mobile population, establish social safety nets such as a pension system for a billion-plus population? Pension reform is one of the most difficult challenges in India’s “second generation” of economic reforms (IIEF 2011),2 which requires innovative public policy solutions primarily at the central government level.
In January 2004, the Government of India (GoI) established the “New Pension Scheme” (NPS) for central and state government employees. Extended on 1 May 2009 to all citizens, the NPS is an ambitious initiative that provides voluntary contributory pensions to India’s vast informal sector. This paper focuses on this latter NPS pillar for all citizens.3 The responsible Pension Fund Regulatory and Development Authority (PFRDA) implemented an internationally unique approach to distribute the scheme through a “system of licensing and registration arrangements” (Butel, Bhardwaj 2010: 4) with private sector financial institutions (MacKellar 2009: 20). This new public-private partnership aims at distributing NPS on a large scale in India but the current number of 167,002 voluntary NPS subscribers lags far behind its potential (Interview Nair 2011;
Sanyal et al. 2011: 18). To assess the malfunction of the NPS, the study will address two research questions:
1) Why has the NPS approach attracted so few new subscribers until now?
2) Which public policy solutions can increase the NPS enrollment rate significantly?
1 The development literature distinguishes formal from informal sectors. “Employees are considered to have informal jobs if their employment relationship is, in law or in practice, not subject to national labour legislation, income taxation, [and] social protection (...)” (Hussmanns 2004: 6; see also II.2).
2 The “first generation” refers to the liberalization of the economy and the opening of the markets after the foreign exchange crisis in 1991. “Second generation” reforms try to stimulate socioeconomic development with more comprehensive policies including economic, fiscal, and social policies (Jenkins, Khilnani 2004).
3 Hereafter, “NPS” refers to this pillar only and not to the NPS for civil servants.
I Introduction 2
I.1 Scope and Relevance
The rapidly growing Indian economy4 almost only generates informal jobs, which are not subject to labor law and do not foresee any form of social security for the aging population. Estimates of the percentage of the Indian workforce that comprises the informal sector range from 81 to 86 percent (Butel 2010; NCEUIS 2007: 4). The informal sector is where an estimated 95 percent of all new jobs in India are generated (Mariathasan 2010: 23). India is projected to become the most populous country by 2026 (Nelson 2010) but the age cohort over 60 is growing fastest among the population and will reach 200 million in 2030 (UN 2008). Hence, India will become a rapidly ageing country before it becomes a high-income economy (Asher, Bali 2010: 68). Longevity increased rapidly. Today, poor Indians have an average life expectancy at age 30 of 73 years (based on WHO 2009). At the same time the traditionally very strong Indian family, which has taken care of the elderly, is transforming because of rapidly decreasing fertility, rural depopulation, and altering value systems (PFRDA 2009). In 2007, an estimated 8.7 percent (37 million) of the approximately 425 million Indian workforce aged 15 to 65 was enrolled in a formal retirement plan including both public and private schemes (based on OECD 2009).5 In summary, the demographic transition, fiscal constraints, changing family structures, and low pension coverage define the importance of increasing coverage for the population that largely consists of informal sector workers.
With the NPS reform of 2009, the GoI has tried to implement a scheme that increases coverage, particularly to the informal sector. As the analysis of the demand shows, enrollments lag far behind their potential of 40 million in the medium term. This paper provides policy recommendations to expand pension coverage, addressing Indian policy makers and technical assistance agencies that support social security provision in India. Many LDC in Asia, Africa, or Latin America share both the problem of low pension coverage and the conditions of aging populations as well as rising informal sectors (Asher 2009; Olivier 2009). Institutional structures and development stages make country-based approaches necessary. Nevertheless, this paper provides a case study that is relevant for other countries as well.
4 GDP growth is projected to reach 8.43 percent in 2011 (Nasser 2010).
5 OECD 2009: 86, adjusted to a larger estimate on the size of the workforce based on Butel 2010: 109.
Today the enrollment rate should be slightly higher due to additional enrollments in the last two years.
I.2 Approach and Methodology
NPS is a voluntary defined contribution (DC) scheme,6 i.e. people have to favor NPS investments over other investments. Both market forces – demand and supply – need to be analyzed to understand where and how policy options should be targeted to address the current low enrollment rate resulting in these vast numbers of persons who will be without pension coverage in old age. Based on a comparison of the demand side for pensions in India and the NPS supply side, the study will assess the degree to which there is a mismatch of both sides resulting in low enrollment rates. The analysis is based on a review of the available literature, government documents, including regulations and policy papers of the PFRDA, as well as surveys including the following main sources:
IIMS Dataworks India Income and Savings Survey (IISS 2007 and 2008), and IFA Survey 2008 for indicators on the Indian financial and insurance market,
National Sample Surveys (NSS 1993-94; 2004-05) for indicators on female dependency and income,
New Pension Scheme Survey (NPSS 2004)7 for indicators on market segments, occupations, and financial behavior, and
UN Population Prospects (UN 2008) for demographic indicators.
The study is additionally based on expert interviews with Indian stakeholders including Rani Nair, Executive Director of PFRDA, T. Koshy, Former Executive Director of the Central Recordkeeping Agency (CRA), Gautam Bhardwaj, Director of the Invest India Economic Foundation (IIEF), and Nishant Jain, Senior Technical Specialist on Social Protection at the German Development Agency GIZ. The interviews were conducted during a research stay in New Delhi in January 2011 (A. 1).
There are two limitations of approach and methodology. First, there are limitations due to a lack of adequate data. Most surveys on India including the census are not conducted annually. The analysis often relies on data from 2004 due to the very relevant NPSS. For several indicators, there are different estimates, which are addressed in the
6 In a defined benefit (DB) system, the pension amount is predetermined. In a DC system “contributions are defined by a lump sum amount or percentage of salary. However benefits in this system depend sometimes on the returns of assets and sometimes are predetermined.” (Sanyal et al. 2011: 19).
7 The data differ from data of the NSS 2004-05, which is used in public reports (NCEUIS 2007: 4). The NSS does not measure most indicators on saving capacities and financial behavior, which is measured by the NPSS. Thus, for consistency, the analysis will be based on the NPSS concerning both labor market data and financial behavior and will indicate when there are large differences between survey data.
I Introduction 4
individual cases to provide a comprehensive picture. Second, there are conceptual limitations due to questions that require further investigation. There are vast development differences between the 28 Indian states. In general, India has a north/south gradient.
Most western and southern states are more developed, which is expressed in lower mortality, lower fertility, better education, and higher incomes (Adlakha 1997). The following analysis will, for the most part, rely on generalized data for India and differentiate only between rural and urban areas. In particular, this paper can only remain on this simplified level concerning policy options. If policy options are considered for implementation, additional research will be needed to check their appropriation for different Indian states. The same concern applies to the cost-analysis of the proposals, which has been simplified and would need to be analyzed further.
I.3 Structure of the Paper
The paper is divided into five chapters. Chapter II provides a theoretical and analytical basis for the empirical analysis in three steps. First, it develops a theoretical framework for the study by defining indicators for the analysis of supply and demand as well as criteria for the successful implementation of voluntary DC pension schemes in LDC. Second, it summarizes the development of the public pension system in India. And third, it provides a statistical picture of the policy problem. Chapter III constitutes the main part of the empirical analysis and investigates the market forces of NPS and in how far both sides match. The demand analysis provides a clearer picture of the relevant market segment in terms of gender, age, occupations, residential area, education, financial literacy, saving patterns, and the level of trust towards the private sector. In order to assess the supply of the NPS, the approach will be described in terms of its institutional architecture, enrollment processes, investment options, and marketing approaches. The chapter concludes with the answer to the first research question on reasons for low NPS coverage. Chapter IV answers the second research question on ways to increase NPS coverage. Finally, Chapter V concludes with a set of concrete policy recommendations, a medium-term outlook on the potential development of the NPS- scheme, and questions for further research.
II. Theoretical and Analytical Framework for the Study of Pensions in LDC
Traditional social security approaches are based on a strict interpretation of social security as “formal employment-based social insurance” (Olivier 2009: 3). This concept is not applicable to LDC because the majority of the populations are informal workers (Ahmad 1991; Olivier 2009). Particularly in the case of India, it is important to differentiate between the (in)formal sectors and (in)formal work8 because there is an increasing share of informal employment in the formal sector (NCEUIS 2007: 4). This raises the relevance of finding social security solutions for informal workers in the informal and in the formal sector. The characteristics of informal employment are relevant for the design of pension schemes for three reasons. First, there is no possibility for social security wage deductions, as they are known in most OECD countries. Second, workers and enterprises are not registered, which complicates the identification of persons and data collection. Third, incomes are low on average. Thus, pension schemes must be designed in a way so that they are voluntary, allow for low contributions, and are financed by workers’ contributions as long as workers have savings capacities.
The International Labour Organization (ILO) and the World Bank (WB) were the first institutions that extensively provided theoretical insights and empirical studies on social protection and pensions in LDC. The ILO established the “Social Protection Floor Initiative” in 2009, which is an institutionalized framework for knowledge sharing of researchers and policy makers. The WB established a research forum with its “Pension Primer” in 1998 with a strong focus on LDC. Nevertheless, social security in emerging economies is a research area that is still in its infancy.
Holzmann and Jorgensen established a theoretical framework of social risk management (SRM), which applies to LDC. SRM is seen as an “investment in human capital formation” targeting the poor and those at risk of poverty to foster socioeconomic development and increase individual and societal welfare (Holzmann, Jorgensen 2000:
2). Traditionally, people have shared risks informally in extended families or egalitarian
8 The terms (in)formal and (un)organized are used interchangeably and were first mentioned by the ILO in 1972 (WB 2011). “The unorganised sector consists of all unincorporated private enterprises owned by individuals or households engaged in the sale and production (...) operated on a proprietary or partnership basis (...). Unorganised workers consist of those working in the unorganised enterprises or households, excluding regular workers with social security benefits, and the workers in the formal sector without any employment/social security benefits provided by the employers” (NCEUIS 2007: 3).
II Theoretical and Analytical Framework 6
tribal systems. Yet, urbanization, declining fertility, and changing value systems are leading to “a break-down of (…) informal risk-sharing mechanisms” (Holzmann, Jorgensen 2000: 4). Holzmann and Jorgensen differentiate between SRM arrangements (informal, market-based, and public), SRM strategies (prevention, mitigation, and coping), and SRM instruments. The latter refers to the actual instruments that are chosen to match supply and demand (ibid: 3). According to this analytical differentiation, this study looks at NPS as an SRM arrangement but questions the scheme’s instruments to find out why the scheme does not match demand and supply.
Studies on pensions in LDC have primarily focused on SRM arrangements. A prominent example is the WB’s promotion of five pillar pension systems (Holzmann, Hinz 2005: 1). SRM instruments, i.e. questions on implementation problems, create a relatively new research field (Asher, Bali 2010). Case studies on DC pensions in LDC primarily cover countries, which have pioneered the development of pension systems, such as Argentina, Chile, and Uruguay. But these countries are of limited relevance for the case of India because these countries have larger formal sectors, covering 60 to 80 percent of the workforce (Ginneken van 2003: 285). Most African and Asian countries with larger informal economies like India struggle more with the implementation of pension systems, and have rarely been at the center of social security research.
This is the first study, which applies an analysis of both market forces to the case of low NPS coverage. Other studies applying this approach are not known. Based on the NPSS 2004, Butel and Bhardwaj have already analyzed the demand for NPS (Butel 2010;
Butel, Bhardwaj 2010), which is a main reference for the analysis of the demand side in this study, particularly concerning the identification of market segments and their financial behavior. However, this study will partly interpret the NPSS in a different way than these authors and complement the demand analysis with further data.
The following three sections define the analytical guidelines for this paper and the background of the research problem. Section II.1 develops a set of indicators and criteria to assess the implementation of such schemes. Section II.2 introduces the background of the NPS reforms in the context of the Indian pension system. And section II.3 provides a statistical description of the research problem.
II.1 Framework to Analyze Coverage Gaps of DC Pensions in LDC
There is no comprehensive theoretical background on functional mechanisms of implementation issues related to pensions. By collecting insights from other empirical studies, this study has tried to create a framework to analyze the implementation of voluntary DC pensions in LDC. According to James, two preconditions must prevail for the effective implementation of public DC pension schemes: (1) rudimentary capital markets and (2) considerable government regulations to prevent fraud and excessive risk (Sanyal 2011: 17 based on James 1997). Asher and Bali add five institutional and functional criteria such as that contributions are collected reliably, benefits are paid timely and correctly, the fund is managed in a financially secure way, records are kept accurately, and financial statements are produced to guarantee for transparency (Asher, Bali 2010: 49). India fulfills James’ basic criteria, and the PFRDA has implemented an institutional architecture that fulfills Asher’s and Bali’s criteria (Butel 2010) but still the NPS has not been implemented successfully (Sanyal 2011). That a scheme fulfills criteria to function from a pure institutional and financial point of view does not mean that it also attracts subscribers. Thus, there are further complex requirements for the implementation to become successful. “Successful implementation” should not only mean that the scheme works but that the scheme effectively attracts its target group to subscribe so that pension coverage is extended. Target groups of social protection in LDC are usually associated with the neediest (Suryahadi et al. 2010: 278). However, in contrast to the usual policies, which are publicly funded, voluntary DC schemes do not target the neediest as long as they do not have savings capacities.
Rajan describes the process of implementing pensions in LDC as “a major issue of social engineering (…) [which] will require the construction of institutional bridges under conditions of limited resources and assets in a system in which public-private relationships wreak of distrust (…)” (Rajan 2008: 31). Similarly, Asher and Bali describe implementation as “a complex logistical task, even more so for (…) countries with large populations” (Asher, Bali 2010: 68). Thus, the implementation of such schemes in LDC is hindered by several conditions, including corruption, limited financial resources, poverty, and as in India the challenge of country and population size. Another vital condition is the aforementioned prevailing informality of work.
II Theoretical and Analytical Framework 8
To better understand the functional mechanisms that influence the success of a DC pension scheme, it can be differentiated between the back-end and front-end of a scheme.
Whereas the back-end includes the design of the institutional architecture of a scheme, how funds are managed, how records are kept, the front-end refers to the direct customer- interface including aspects such as how and by whom the product is distributed, the enrollment process, and how a scheme is marketed (Interview Palacios 2011). Attraction of subscribers is back-end and heavily front-end driven. Of course, a subscriber has to be convinced by the investment scheme, and the scheme must function, for which Asher’s, Bali’s, and James’ criteria are vital. However, a subscriber must also be attracted by the scheme’s marketing and distribution channels. The subscriber’s demand and access to a scheme depend on conditions as they are described by Rajan.
As a result, once James’, Asher’s, and Bali’s requirements are fulfilled, the all- encompassing requirement for voluntary DC schemes to be implemented successfully is that the characteristics, which define and characterize the demand for pensions, have to be matched by the supply side of the pension scheme. Thus, this study approaches the research question for low coverage based on a comparative analysis of the NPS market forces. The analysis requires two different analytical tools comprising of indicators and criteria. First, indicators are necessary to guide the analysis of demand and supply. On the one hand, the indicators will define which aspects of the demand side are relevant for the design of the scheme. On the other hand, they will define which aspects of the supply side (the NPS) are necessary to analyze in order to assess, in a second step, how and why both sides do or do not match. Secondly, criteria are necessary to assess the degree to which demand and supply sides match and where policy options should be targeted to increase coverage. The following list of indicators and criteria serves as analytical framework for the analysis in the following chapters.
A) Indicators of demand and supply:
1) Demand:
a) Demographics: For a basic picture of the NPS demand, data on the current and future age pyramid are relevant. Life expectancy is the most important demographic indicator because it is linked to the adequacy of the NPS retirement age. Data on
demographic characteristics of further sub-groups of the population such as scheduled castes and tribes is very relevant for social protection in general. That being said, these groups belong to the poorest and most disadvantaged segments in India and will not have the savings capacities for NPS as a contributory scheme (Deshpande 2000 and 2001;
Borooah 2005). Thus, they can be neglected from the NPS demand analysis and should be targeted through publicly funded schemes, such as NOAPS.
b) Labor market status, income, and savings capacities: There are two perspectives on the NPS market segments. First, the market could simply be defined in terms of labor market status, i.e. all workers who are not eligible to formal sector schemes. But only a certain share of this group is able to afford NPS that builds on workers’ contributions.
Thus, a second perspective on savings capacities of this group is necessary to define potential market segments. The informal workforce is divergent in terms of income and savings capacities with important implications for the size of the NPS market segments.
Finally, the development of labor market segments and real wages is relevant to getting an outlook on the future development of NPS market segments.
c) Occupations and education: As shown in a study on Chile, the level of education correlates with the rate of participation in a voluntary pension scheme (Holzmann, Packard, Cuesta 2000: 22). The finding is so obvious that it would be surprising if education would have a different effect in India. Not only do the elderly require knowledge of the schemes and financial products that are offered (Asher, Bali 2010: 67), literacy is also required to master the bureaucratic act of enrolling in such a scheme.
Therefore, it is necessary to analyze data on education of the NPS market segments.
Occupations would provide important information for NPS distribution strategies and marketing approaches if they could be used as proxies for market segments. The indicators are coupled because it would be interesting to see whether occupational groups differ in levels of formal education. If occupations could be used as proxies for market segments, their educational levels would be relevant to assess how they would need to be approached.
d) Residential area: 77 percent of the total Indian workforce lives in rural areas (Butel 2010: 110) but whether the majority of potential NPS customers live in rural areas, and how they are distributed across the 28 Indian states, needs to be investigated.
II Theoretical and Analytical Framework 10
e) Language skills: English is the operating language of the Indian administration.
Thus, it needs to be analyzed which languages are spoken by the majority in India, and in how far English can be used as the operating language in a pension scheme.
f) Financial behavior and confidence in financial organizations: These indicators are highly relevant for the design of both the investment characteristics of NPS, and of the marketing approach. They will indicate the financial behavior, investment preferences of the market segments, and confidence in financial organizations. Thus, this analysis will show in how far marketing and distribution strategies can rely on financial literacy9 and the existence of bank accounts, and if the market segments have already built confidence in financial institutions, which are the major distributors of NPS.
2) Supply:
a) Institutional architecture: Of primary interest are the institutions, which distribute the scheme, and those, which provide the annuities. These aspects can point to eventual failures of NPS including reasons why distribution channels underperform. Thus, it is vital to analyze the incentives for the distribution channels to enroll subscribers.
Moreover, an unclear process of annuity-provision could be a reason that raises skepticism of potential subscribers.
b) Investment rules: The rules and conditions of investments are one of the most relevant aspects to attract subscribers to a long-term saving scheme. Relevant characteristics include terms for withdrawals, investment choices, rate of return, tax treatment, and retirement age. However, NPS characteristics can only be assessed against the background of the demand in terms of financial behavior and investment priorities.
c) Enrollment process: This indicator is relevant to understand the bureaucratic effort and transparency of the enrollment process, i.e. how complex are forms that have to be filled out, what is the operating language, and are their further charges and fees connected to enrollment.
d) Pull Marketing: New voluntary products that require own contributions have to convince customers. Thus, it needs to be analyzed how PFRDA tries to attract potential subscribers; if and how the institution markets the scheme.
9 The “ability to make informed judgments and to take effective decisions regarding the use and management of money” (IIMS 2008a: 1).
B) Criteria for the assessment of voluntary DC pension market forces:
1. Applying a holistic market perspective and developing a scheme that satisfies workers’ financial preferences: Participation in the NPS is voluntary and “will be driven entirely by consumer sentiment” (Butel 2010: 103). People have to actively decide to pay into an NPS account while they decide against other spending or saving options.
Thus, in order to fulfill this criterion, NPS would need to offer what people demand in terms of investment conditions. In addition, NPS must be viewed as one of several long- term saving options and put in the context of the Indian pension sector and its competing products. This means that NPS needs a higher rate of return, equal or better tax treatments, but it probably also needs to fulfill a high level of investment security, withdrawal possibilities, and flexibilities of contribution. The latter is important to incentivize poorer segments to participate because they witness greater uncertainties of income (Rusconi 2009: 72).
2. Building confidence in long-term (political) stability and the feasibility of scheme and investment: With regard to social security and pensions, it is vital to take long-term perspectives of seven to eight decades into account to assess the stability of a scheme over a long period (Asher, Bali 2010: 68). Both the actual and perceived sustainability of investments must be taken into account because these policies require public trust in their long-term reliability. Hence, “considerations of political economy have to be part of system design and reform” (Holzmann, Jorgensen 2000: 24). On the one hand, this criterion requires that the financial burdens of the scheme are fiscally sustainable and politically accepted in the long run. On the other hand, this criterion requires that people who invest their own money can built the required confidence in the security of their investment for old age. The latter aspect points to the fact that the administration of a scheme such as NPS can actively built public confidence if certain requirements are fulfilled including a sound legal basis, institutionalized possibilities to voice grievances, as well as transparency of all rules and cash flows.
3. Developing effective distribution channels and utilizing the private sector: In order to implement and deliver pension schemes, particularly in LDC, it is vital to utilize the comparative advantages of various actors including the private sector – especially of those with local expertise including municipalities, local NGOs, and think tanks. “They are characterized by different degrees of asymmetric information (…). All have different
II Theoretical and Analytical Framework 12
advantages but none can provide perfect social risk management instruments.”
(Holzmann, Jorgensen 2000: 26). The comparative advantages might change over time as markets develop, which should allow for changes of arrangements over time (ibid). Thus, according to Holzmann and Jorgensen, governments of LDC should act as regulator and supervisor but would ideally build on private experiences and infrastructure to deliver such instruments (ibid). Though the private sector might be an efficient distribution channel in general, their performance depends on three aspects: First, on the finding of effective incentives for organizations to perform; second, on people’s confidence in these organizations; and third, on the access of potential subscribers to these organizations.
4. Implementing targeted and tailored (pull-) marketing approaches: Marketing of voluntary pension schemes in LDC is necessary to attract people for two reasons. First, the concept of pensions is not known to the majority and second, income in old age is not a primary concern of most people (Holzmann et al. 2000). Marketing theories differentiate between push and pull marketing strategies. Following a push strategy, the producer would “push” its products through distribution channels. The producer tries to convince companies, which should sell the product, with conditions that are so advantageous for the trading companies that selling the producer’s product becomes one of their priorities. This aspect is already covered in criterion 3. With a pull strategy, the producer tries to “pull the consumer towards the point of sale” (Buttle 1996: 3). Then, the producer’s marketing activities target the end consumer. In the case of NPS a targeted approach would consider consumer peculiarities including level of education, language skills, financial behavior etc.
Particularly pull-marketing raises administrative costs (Suryahadi et al. 2010: 281).
Targeting efforts in general should be limited to a situation where welfare benefits still exceed economic costs. Unfortunately, this is difficult to measure and it is a question of political will and the priorities of the government.
II.2 Development of the Public Pension System in India
For a long time pension provision targeted only central and state government employees and formal sector workers based on financing through employer and employee participation (Swarup 2008: 2). Besides options offered by private and civil
society organizations, there were no pensions for the vast majority of the population, i.e.
workers in the informal sector including the economically disadvantaged segments of the population. In the last decade, the GoI started a reform process towards a more comprehensive multi-tier pension system, which generally is the most effective option to meet the demands of various groups (Asher, Bali 2010: 64 f; Robalino, Holzmann 2009).
The debate on the NPS reform process started in 1998 because the GoI wanted to improve the financial sustainability of the pensions for civil servants and to extend pension coverage to the informal sector (Swarup 2008; ADB 2003). In 1998, the Ministry of Welfare, later renamed the Ministry of Social Justice and Empowerment (MoSJE), commissioned the Invest India Microeconomic Foundation (IIEF) with the first comprehensive study on old age social and income security (“OASIS”). The GoI and IIEF set up an inter-ministerial OASIS Expert Committee (Mariathasan 2010: 24), which produced two final reports with concrete policy proposals. The OASIS Reports became the basis for the development of NPS. The PFRDA Bill provides the regulatory basis for the implementation of NPS for all citizens. Though the bill has not been passed by Parliament since 2005 (compare III.2), the NPS reforms have been implemented. Today, the Indian public pension system consists of four pillars10:
The first pillar is the oldest one and includes the pensions for central and state government employees. Pensions were defined under the Directive Principles of State policy. The directive was amended in 2003 to implement the New Pension Scheme (NPS) in 2004, which meant a change from the formerly DB scheme into a DC scheme.
Employees have to contribute a minimum of 10 percent (of salaries) and there is a matching 10 percent government contribution. Civil servants employed since 2004 have to enroll in the NPS. The old scheme still provides pensions for employees who joined the civil service prior to 2004. There are further special schemes for employees of the public enterprises Indian Railways, and India Post. (IIEF 2009)
The second pillar comprises the pensions for formal sector employees. There are several schemes with different target groups: According to the EPF&MP Act 1952, the Employees Provident Fund Organization (EPFO) compulsorily covers formal sector workers with monthly earnings of Indian Rupees [INR] 6,500 or less at firms with 20 or more members in defined industries. The two most important schemes managed by the
10 The four pillars are the author’s own description. The GoI does not differentiate between pillars.
II Theoretical and Analytical Framework 14
EPFO are the Employees Provident Fund (EPF) and the Employees Pension Scheme (EPS). The EPF was created in 1952 and has a DC rate of 16 percent and addresses workers with high salaries. The EPS is a DB-scheme and was introduced in 1995. It requires an employer’s contribution of 8.33 percent and includes a government- contribution of 1.16 percent of the wage. “Firms not covered under EPFO may run their own pension and provident fund for the benefit of their employees subject to certain regulations” (OECD 2009: 84). There are special schemes for coal miners under the Coal mines PF&MP Act 1948, and for companies in defined industries under the Payment of Gratuity Act 1972. (IIEF 2009)
The third pillar is a social pension, the Indira Gandhi National Old Age Pension Scheme (NOAPS), launched in 1995, for all persons below poverty line (BPL)11 aged 65 and above (IIEF 2011; Old Age Solutions 2010). The pension amount consists of INR 200 [3.18 €] per month from the central government plus smaller contributions by the state. For the 2011-12 budget, the finance minister proposed to reduce the eligibility age to 60 and to increase the GoI’s contribution to INR 500 [7.95 €] per month for those above 80 years (Asher 2011). “The NOAPS is known to have many problems in terms of coverage, targeting failures, inadequate payment levels and ineffective administration”
(Butel 2010: 148 f.).
The forth pillar includes voluntary DC pensions available to all citizens. In 1968 the GoI introduced the Public Provident Fund (PPF), which is not a typical pension scheme but a voluntary tax-advantaged DC saving option using personalized accounts.
This scheme has been open to all citizens but since it uses income tax rebates as incentives for customers, it has mainly attracted formal sector workers, who pay income taxes (Siraj 2009). Annual contributions can range from INR 500 to 70,000 [from 8 to 1109 €] and are tax-exempt. The GoI fixes the rate of interest annually, currently at eight percent (Madrasi 2011). Accounts can be opened at India Post and the State Bank of India. Withdrawals are possible after five years. Fifteen years of contributions give entitlement to a pension (India Post 1968). The combination of tax-exempt contributions
11 BPL is a need-testing tool for several social protection programs designed by the GoI. The last BPL Census (2002) involved 13 different criteria on asset ownership, education, occupation etc.. Based on scores, households are ranked per district and an individual cut-off score is applied with the result of a relative poverty and deprivation index (Dreze, Khera 2009: 3).
and easy withdrawal opportunities likely leads to the system being used for tax evasion by wage-earning, tax-paying individuals, and not for old-age provision.
Since 1 May 2009, the NPS was extended and made available to all citizens. The reformed NPS particularly addresses the informal sector workforce. This NPS strand does not involve the 10 percent government contribution but in the Union Budget 2010- 11, the GoI introduced a temporary subsidy – the Swavalamban benefit - for informal sector workers. Moreover, PFRDA developed a second version of NPS that is NPS-Lite, which became available on 1 April 2010. NPS-Lite is a different way of distributing the scheme and it has different investment rules targeting economically disadvantaged persons. This NPS strand, including NPS-Lite, is the focal point of this paper. (Asher 2003; Asher, Bali 2010; Swarup 2008; WB 2001)
In addition to publicly provided schemes, there are micropensions offered by microfinance institutions, long-term saving options offered by banks, and pension schemes offered by insurance companies that provide the investor with a choice of funds (IIEF 2009). Among those private sector products, micropensions have gained considerable relevance in India, whereas the other two options are rarely distributed (Interview Bhardwaj 2011). Micropensions address the needs of very specific individual groups or local communities and design tailored solutions based on low contributions and low premium (Churchill 2006: 12). In terms of coverage the Self-Employed Women’s Association (SEWA) is one of the most successful examples. In 2009, 50,000 self- employed women were enrolled in SEWA’s micro-pension scheme (Buisness Standard 2009). As micropensions are solutions targeting only specific groups, they cannot be considered as a solution to cover masses of workers but can certainly considered as means to provide tailored social protection to the economically most disadvantaged.
Several authors reveal that India lacks a comprehensive pension system (Bloom et al.
2010; IIEF 2009). However, considering the described four pillars, this interpretation is not correct as the schemes potentially cover all different target groups in terms of sectors and industries quite comprehensively. Thus, it must be stressed that the problem of low pension coverage in India is not due to a lack of available schemes, and therefore it must be caused by implementation failures.
II Theoretical and Analytical Framework 16
II.3 A Statistical Picture of the Policy Problem
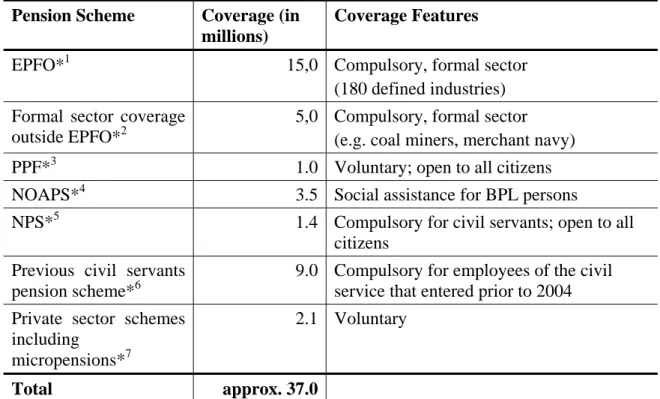
As measured by the NPSS 2004, on average around one third of the Indian workforce is unconfident that their children will financially take care of them in old age (Butel 2010: 141). But coverage of pension schemes is low in India. In 2007, an estimated 10.2 percent (= 37 million) of the projected 363 million paid Indian workforce aged 15 to 65 were enrolled in a pension scheme. This equals coverage of an estimated 8.7 percent of the total workforce12. The remaining 388 million lack any form of formal pension coverage. Table 1 shows the coverage in millions with regard to the aforementioned public pension schemes plus estimates for private sector pensions.
Formal sector pensions have by far the largest share.
Table 1: Coverage of pension schemes in India (various years)
Pension Scheme Coverage (in millions)
Coverage Features
EPFO*1 15,0 Compulsory, formal sector
(180 defined industries) Formal sector coverage
outside EPFO*2
5,0 Compulsory, formal sector (e.g. coal miners, merchant navy) PPF*3 1.0 Voluntary; open to all citizens NOAPS*4 3.5 Social assistance for BPL persons
NPS*5 1.4 Compulsory for civil servants; open to all citizens
Previous civil servants pension scheme*6
9.0 Compulsory for employees of the civil service that entered prior to 2004 Private sector schemes
including micropensions*7
2.1 Voluntary
Total approx. 37.0
(*1 Mariathasan 2011: 22; *2 OECD 2009: 84; *3 Butel 2010: 140 based on NPSS 2004; *4 Butel 2010:
149; *5 Interview Nair 2011; *6 estimated based on Economist 2008; *7 no data available, estimated based on subtraction of 37 m. minus the other schemes)
Voluntary pension products “have failed to capture a significant market” (Butel 2010: 104). The NPS has been designed with the aim of changing the low coverage
12 There are different projections on the size of the workforce, e.g. Mariathasan projects 450 million (Mariathasan 2010: 22). Butel projected a size of 425 million „based on the actual population according to the 2001 Census, uprated by a 1.8% per annum growth factor” (WB estimate; Butel 2010: 119). For data consistency reasons, the study uses Butel’s projection.
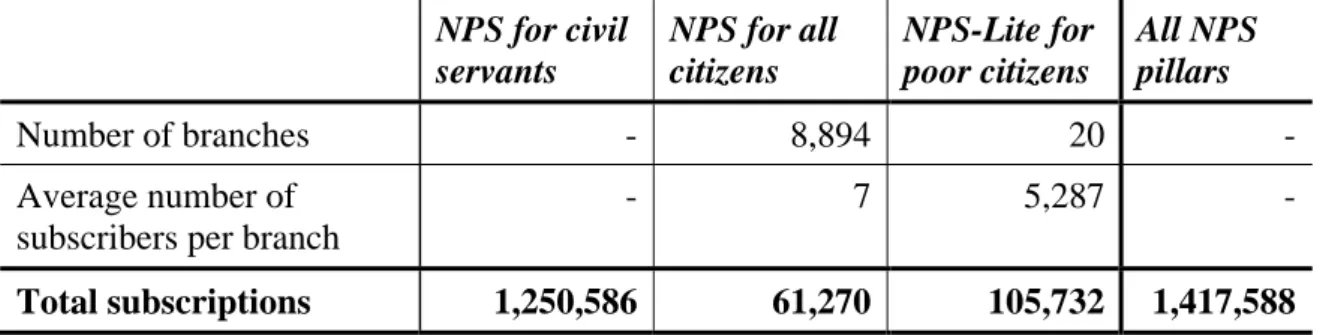
situation, but it is far from performing better than the other schemes. About 1,417,588 workers, including civil servants, have joined the scheme since May 2009 (Interview Nair 2011; data from 12 March 2011). About 90 percent of all subscribers are civil servants for whom the scheme is mandatory (ibid). Of the 1.4 million, 167,002 persons subscribed voluntary. Of the voluntary subscribers, 105,732 persons subscribed to NPS- Lite (table 2). Thus, about 0.04 percent of the total workforce has voluntarily subscribed to NPS. Around 4.5 percent of all subscribers are formal sector workers (A. 6).
Table 2: Number of NPS subscribers as of 12 March 2011
NPS for civil servants
NPS for all citizens
NPS-Lite for poor citizens
All NPS pillars
Number of branches - 8,894 20 -
Average number of subscribers per branch
- 7 5,287 -
Total subscriptions 1,250,586 61,270 105,732 1,417,588
(Interview Nair 2010; Sanyal et al. 2011: 18; compare A. 6 for data on February)
Subscriptions to the voluntary NPS for all citizens have increased at a constant but very slow pace. In contrast, NPS-Lite has witnessed a much higher enrollment rate in the last months and has overtaken the number of NPS subscriptions although NPS-Lite has been available since April 2010 and NPS since May 2009. On 7 February 2011, about two years after the launch of the scheme (not included in table 2), 42,982 workers have subscribed to NPS and 30,227 to NPS-Lite (PFRDA 2011; A. 6). About one month later on 12 March 2011, NPS-Lite suddenly had 75,505 subscribers more while NPS only received a few thousand new subscribers in the same period (Interview Nair 2011).
Moreover, there is a considerable performance difference between the distribution channels of NPS and those of NPS-Lite (table 2). Each branch distributing NPS on average only managed to enroll seven persons compared to branches distributing NPS- Lite that on average managed to enroll 5287 persons each. In summary, there is a general low coverage problem of NPS but the problem is more severe with regard to the
“original” NPS compared to NPS-Lite.
III Market Forces of the NPS 18
III. Market Forces of the NPS
The following chapter analyzes both market forces of the NPS scheme and builds on the analytical framework of Chapter II. Demand and supply are analyzed separately in sections III.1 and III.2. Based on the analysis of both market forces, the match of demand and supply is assessed in section III.3 to answer research question 1 on the reasons for low NPS coverage.
III.1 The Demand for Pensions in India
The Indian workforce is a very heterogeneous group in terms of pension relevant indicators. In order to know the parameters to adequately improve NPS, it is necessary to get a better picture of the demand side.
a) Demographics13
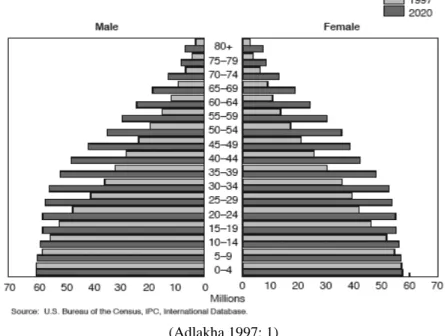
The age pyramid of the Indian population has started changing from the typical pyramid of a rapidly growing population to a pyramid of a stationary population (Figure 1). The latter is characterized by relatively constant numbers up to age 50 whereas afterwards mortality has “a larger effect” (Goldstein 2009: 11). A stationary population pyramid will be reached in the next two decades (ibid.).
Figure 1: Population of India by age and sex: 1997 and 2020
(Adlakha 1997: 1)
13 There is a data inadequacy because many people do not know their exact ages (Visaria 2000: 7).
Although statisticians try to correct data by mathematical smoothing, there remains an certain error.
The pattern of aging in India has just started unfolding. In 2005, India reached the threshold according to which the UN defines a country as “aging”, i.e. at least seven percent of the population is 60 and older (Prakash 1999: 2). Thus, now is the right time for the GoI to approach pension policies for the majority of the workforce before the pressure of an aging population becomes more severe in the next two to three decades. In 2010, the median age is projected to be 25 years and is projected to rise to 38.4 years in 2050 (UN 2008). The 60+ cohort is growing the fastest within the population. The number of the aged has risen by 300 percent from roughly 20 million to about 80 million from 1950 to 2005 (Bhattacharya 2000: 5). In the next 10 years, the share of elderly is projected to grow to 10 percent of the total population and to 20 percent in 2050, accordingly with 134.5 million elderly in 2020, 200 million in 2030, and 315.6 million in 2050 (UN 2008, Asher 2005: 14).
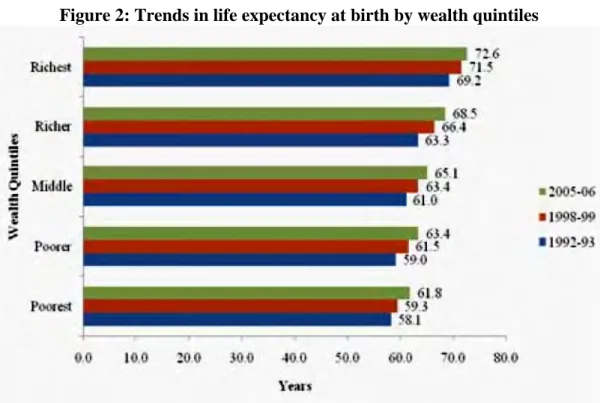
Socioeconomic development has led to a rapidly increasing life expectancy at birth (LE(0)). For the period 1950 to 1955, the LE(0) was only 37.1 years for females and 38.7 years for males. Both have risen to 63.5 years for both sexes, 65 years for females and 62.1 years for males, in the period 2000 to 2005 and they are projected to further increase to 75.4 years for females and 71.4 years for males for 2045 to 2050, which has mainly been caused by decreasing infant mortality (UN 2008). However, LE depends on the financial status of the household (Mohanty, Ram 2010).
Figure 2: Trends in life expectancy at birth by wealth quintiles
(Mohanty, Ram 2010: 1)
III Market Forces of the NPS 20
Figure 2 shows that between 1992-93 and 2005-06, LE(0) has increased quite consistently for all wealth quintiles. That being said, a large gap has remained between the richest and the poorer and poorest. The decision to retire is not made at birth but rather at ages 25 to 40, when LE is higher than at birth, because mortality risks were overcome. There is no data on LE at later ages sorted by financial status, but the average life expectancy at age 30 (LE(30)) is 76.2 for females and 73.1 for males (WHO 2009). Conversely, the average LE(30) is shaped heavily by the poor masses, so this paper estimates that LE(30) of the poorer and poorest quintiles is at a maximum one to two years lower than the total average, around 73 years for both sexes. Women on average live longer and there is a so-called “feminization of the elderly”, which is an international trend. India had a male-female ratio of the elderly at age 65+ of 0.88 in 2001, i.e. 880 males for 1,000 females (Chan et al. 2010: 96). As LE has increased rapidly, most workers are used to having experienced deaths of people who were in their 50s or early 60s. Accordingly “IISS 2007 results show that this perception is still widespread with less than one in eight workers believing that they will survive into their seventies” (IIMS 2008: 2).
There are large differences in the stages of the demographic transition between the states. Although the fertility rates of most states continue to be above 2.1 children per woman (TFR in Bihar of 4.0; in Uttar Pradesh of 3.8), some states already have fertility rates that compare to European countries. Karnataka (1.9), Kerala (1.7), and Tamil Nadu (1.7), for example, go hand in hand with higher LE (UN 2008).
As a result of the demographic transition, there is a rising demand for old age security, particularly of women. The choice for an internationally used retirement age of 60 years of age would be reasonable considering the rapidly rising LE.
b) Labor market status, income, and savings capacities
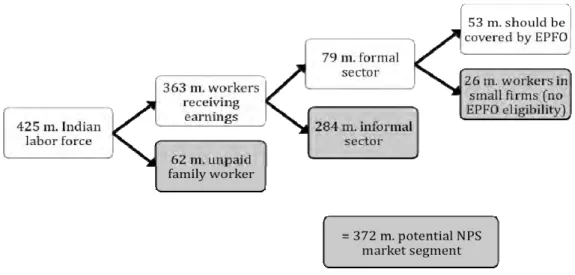
About 85 percent (363 million) of the total workforce comprising 425 million persons receive earnings while the other 15 percent or 62 million are unpaid family workers. As shown in Figure 3, the 363 million earners are divided into 284 million informal sector workers and 79 million formal sector workers. The formal sector consists of 53 million earners, who belong to the target group of the EPFO, and 26 million workers in small firms, who are excluded from EPFO coverage. Excluding
income, savings capacities, and coverage of workers by pension schemes other than EPFO-schemes, as shown in Figure 3, the NPS market encompasses 284 million informal sector workers, 62 million unpaid family workers, who could also be counted as informal workers, and 26 million formal sector workers, who are not eligible for EPFO, which equals 372 million persons, i.e. 87.5 percent of the total labor force. (Butel 2010: 109)
Figure 3: Potential NPS market share based on labor market status
(Own illustration based on NPSS 2004, see also Butel 2010: 109 ff.)
With NPS being a DC scheme, its potential market is limited to those workers who can pay the contribution for a sufficient amount of time so that enough pension claims can be accumulated. This excludes 18 percent of the informal sector that are unpaid family workers and the chronically unemployed (Butel 2010: 103 f.). The ADB undertook a conservative and realistic baseline study for the GoI to segment the pension market based on the assumption that there would be no subsidies for contributors and that contributors would have to bear all administrative costs for commercial partners (Butel 2010).14 It is based on the NPSS 2004 and assumes that pension contributions are sourced either in real earnings, reduced personal/household expenditure, or in the redirection of existing savings (ibid). Moreover, the survey only included the age cohort 30-50. While the survey assumes that those 50+ do not have
14 IIMS came up with an estimation on the private pension market: “(…) with up to an estimated eight crore [= 80 million] workers ready to participate” (IIMS 2008: 2). The report concludes, “the average annual bank savings of individuals with bank accounts at Rupees 39,000 [619 €] suggests that (...) the group can easily support regular and meaningful pension contributions” (IIMS 2008: 117). But the conclusion is overly simplistic because the average bank savings will likely be shaped drastically by a very small number of very wealthy persons.
III Market Forces of the NPS 22
enough time to collect enough money, “younger workers incomes are likely on average to be unrepresentatively low” (Butel 2010: 105). The real potential market is probably larger because a certain share of people under 30 years of age might be interested in a pension scheme.
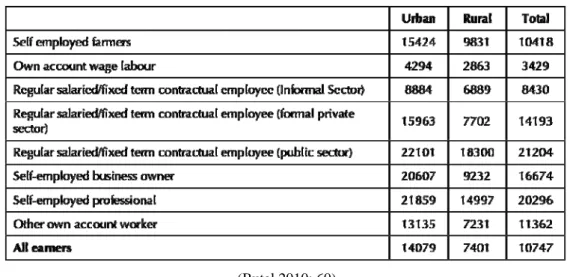
The NPSS “asked respondents to indicate what part of their present discretionary expenditure they could harvest for other purposes if they felt there was good reason to do so” (ibid), which indicates the potential pension market if these people could be convinced to invest in a pension scheme. Figure 4 shows the annual savings capacities of NPSS 2004 respondents. In all categories, workers in urban areas have higher savings capacities than the rural counterparts. Average annual capacities of INR 10,747 [170.33 €] appear surprisingly high for all earners.
Figure 4: Annual savings capacities
(Butel 2010: 60)
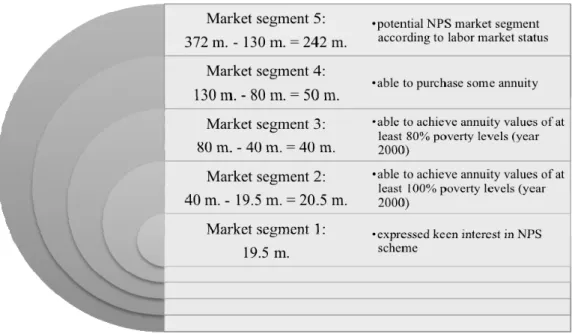
Based on the findings on available discretionary expenditure, the study calculated the potential pensions that contributors could expect with the NPS assuming that they pay into the scheme on a monthly basis over the full period of membership (Butel 2010: 107). However, in reality people will probably be willing to invest only a certain fraction of their actual savings capacities in a pension scheme. Figure 5 shows how the 372 million individuals in Figure 3 can be divided into five market segments.
Market segment 5 consists of 242 million persons. The majority of them are the least likely able to afford NPS because they do not have savings capacities.15 Market
15 However, due to the statistical approach, this group includes all persons, who based on their savings capapcities would belong to the other market segments but who were excluded there because they only
segments 1 to 4 total 130 million workers aged 30 to 50 who would be able to purchase some annuities. Yet, out of these 130 million only 40 million would be able to collect annuities high enough to live above the national poverty level16 after retirement (market segment 2). Included in the 40 million are also 1.34 million formal sector salaried workers in small firms, who are excluded from EPFO (A.2).
Overall, 40 percent of the respondents expressed keen interest in NPS. With regard to the 40 million who are able to afford NPS and annuities of at least poverty line level, 19.5 million expressed keen interest in NPS (market segment 1). Another 40 million could collect annuities high enough to live on a level of 80 to 100 percent of the national poverty level (market segment 3; Butel 2010: 106).
Figure 5: Potential NPS market segmentation based on savings capacities
(Own illustration based on NPSS 2004, see also Butel 2010: 109 ff.)
According to Bhardwaj, with the expectation of rising incomes market segments 1 to 3, comprising of 80 million persons, are potential NPS customers in the short- to medium-term (Interview Bhardwaj 2011). The expectation of rising incomes, however, is quite unrealistic. As shown in A. 8, trends in real wages of both male and female casual workers in urban areas declined slightly in 2004-2005 compared to
include respondents in the age group 30-50. All workers between 15 to 30 and 50 to 65 years of age, are included in the 242 million.
16 Measurement of the poverty level is based on statistics from 2000 (Butel 2010: 106). The GoI defines “poverty line for the urban areas is Rs. 296 per month and for rural areas Rs. 276 per month, i.e. people in India who earn less than Rs. 10 per day. As per GOI, this amount will buy food equivalent to 2200 calories per day (...)” (India Watch 2010).
III Market Forces of the NPS 24
1999-2000. In the formal sector, real wages have increased slightly for male rural workers in the same period by approximately INR 4 [0.06 €] per day but decreased remarkably for rural females by INR 20 [0.32 €] and slightly for urban females (ibid;
Appendix 8). This development “is truly remarkable for a country in which real GDP has been growing at an average rate of 8 percent over this period, and where much of this growth has been concentrated in urban areas” (Ghosh 2011: 146). As developments of wages differ so much with regard to gender and location it is unrealistic to expect real wages to go up just because of GDP development. As a result, a realistic NPS market rather consists of market segments 1 and 2.
Thus, NPS is not a pension scheme that could be afforded by those at the very bottom of the income distribution, in particular women and scheduled castes and tribes. Elderly women living in urban areas are a very vulnerable group. According to the NSS survey of 1993 to 1994, 64 percent of elderly females in urban areas categorized themselves as fully dependent with regard to food, clothing, and health care in contrast to 46 percent of men, 58 percent of females in rural areas, and 45 percent of males in rural areas (Rajan 2006: 13). Elderly females have the highest demand for social security (Asher 2009: 7). Conversely, women are not the major target group of the NPS approach because they have much less discretionary income that could be invested in a pension scheme. Since the suppression of women is all- encompassing in the Indian society, it is important to focus on female empowerment on a much broader footing. The same applies to scheduled castes and tribes.
c) Occupations and Education
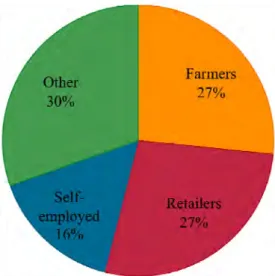
The rapid development of the Indian economy has been based on a very small knowledge and IT-intensive fraction of the economy. Due to a lack of structural economic change, the vast majority of the population has to continue work in low productivity, low-paid activities (Ghosh 2011: 126). The Indian economy is still an agricultural economy with 60 percent of the workforce employed in this sector although this sector is responsible for only 20 percent of the GDP (ibid). According to the NPS 2004 Survey and in line with the described macro-economic development, 70 percent of the 19.5 million persons in market segment 1 belong to only three occupational categories: traditional and merchandised farmers (26.6 percent; 5.2
million persons), small retailers (27.4 percent; 5.3 million persons), and self- employed persons (15.6 percent; 3 million persons) (Figure 6, A. 2). Unfortunately, this categorization is not clear-cut since most of the retail workers are also self- employed and there is no information on the definition of the category of self- employed versus self-employed in other categories.
Figure 6: Occupations in market segment 1
(Own illustration based on NPSS 2004, Butel 2010: 113)
Surprisingly, although the incomes of traditional farmers, in contrast to the incomes of merchandised farmers, belong to the lower income ranges, their savings capacities are broadly similar to the savings capacities of other occupational groups with higher average incomes (Butel 2010: 116). In terms of education, both traditional and merchandised farmers belong to a rather uneducated group in terms of formal education. Less than 30 percent have completed at least primary education, while 80 percent of the rest are illiterate (Butel 2010: 116). This fact, in particular, poses major challenges to finding a strategy towards approaching this group.
The small retailers can be divided into 70 retailing categories. However, more than half of them belong to six types: “grocery and general stores, clothing and footwear stores, household items, shops, certain street vendors and eateries of various kinds” (Butel 2010: 117; A. 3). On average, small retailers have a minimum of primary education and belong to medium income ranges with some exceptions, such as the grocers, who have higher incomes but same savings capacities as the average in market segments 1 and 2 (Butel 2010: 119).