Interest Intermediation in the European Union Revisited
Report on a Survey Study
Beate Kohler-Koch, Christine Quittkat
with Urszula Kurczewska
Beate Kohler-Koch Christine Quittkat
with Urszula Kurczewska
Interest Intermediation in the European Union Revisited
Report on a Survey Study
Arbeitspapiere – Working Papers Nr. 151, 2013
Mannheimer Zentrum für Europäische Sozialforschung
Beate Kohler-Koch:
Interest Intermediation in the European Union Revisited: Report on a Survey Study / Beate Kohler-Koch; Christine Quittkat; Urszula Kurczewska. – Mannheim: 2013
(Arbeitspapiere - Mannheimer Zentrum für Europäische Sozialforschung; 151) ISSN 1437-8574
Not available in book shops.
Token fee: € 3,00
Purchase: Mannheimer Zentrum für Europäische Sozialforschung (MZES) D – 68131 Mannheim
www.mzes.uni-mannheim.de
Editorial Note:
Beate Kohler-Koch, former Professor, University of Mannheim, is a project director at the Mannheim Centre for European Social Research (MZES).
Christine Quittkat, post-doc, is a project director at the Mannheim Centre for European Social Research (MZES), University of Mannheim.
Urszula Kurczewska, Assistant Professor at the Warsaw School of Economics.
Abstract
This paper presents first results of a comprehensive survey of business interest associations (BIAs) in France, Germany, Poland, the United Kingdom, and at the European level, as well as of selected compa- nies and EU level NGOs. Comparing the 2012 EUROLOB II data with our survey data of 1999 (EUROLOB I), we investigate whether or not national and European interest representatives modified their strategies of interest intermediation to respond to the new competitive situation caused by enlargement, institutional reform and the Commission’s turn to new modes of governance.
Our results reveal that while the number of associations has grown over the years, the number of those having contacts with EU level institutions has decreased compared to 1999. We witness a trend towards the delegation of EU lobbying to higher-level functional and higher-level territorial organizations, i.e. to national umbrella associations and to EU level BIAs.
However, among those who have contacts the frequency of contacts with EU level political actors has intensified considerably. This holds especially true for the European Parliament, whose competences have increased since the turn of the century. The data also show that national business interest associations continue to differ in their approach to EU interest representation. They display different patterns concerning the selection of their contact partners, their timing of activities, and their readiness to open a representation in Brussels. As regards the new consultation instruments introduced by the European Commission in the past decade to make EU governance more open, transparent, and participatory, EUROLOB II reveals that just these instruments (online-consultations, policy forums, platforms and hearings as well as conferences) rank lower than any of the traditional instruments of interest representation.
Contents
What we did 7
1. Actor profile 2012 9
2. EU interest intermediation in 2012 10
2.1 Appraisal of and relations to EU institutions 10
2.2 Appraisal of and relations to national institutions 15 2.3 Selection of contact partners and timing of activities 18 2.4 Disparate capacities: The importance of size and being on the spot 20
3. Continuity and change in the lobbying approach of BIAs from
1999 to 2012 20
3.1 Changes in the conditions of interest intermediation 20 3.2 Changes in the appreciation of target institutions 20 3.3 Old and new instruments of interest intermediation 22
3.4 Cooperation patterns 23
Summary 25
Appendix: Regression analyses focusing on the frequency of contacts with EU and
national institutions 27
What we did
We present here first findings of a large-N research project (EUROLOB II; 2012) that addressed all nation- al business interest associations (BIAs) in France, Germany, Poland, and the United Kingdom, and all BIAs at the EU level. We also included a representative sample of the largest companies in the four case countries. In addition, we expanded the survey to non-governmental organizations (NGOs) at the EU level.
Between March 2012 and September 2012 we have asked these actors about their contacts and relation- ship with European and national political institutions and other organizations as well as about their organi- zational characteristics. The study is unique in the sense that it is a replication of a survey we did twelve years ago (EUROLOB I; 1999) so that our data allow for a comparison across countries and time. The former survey, however, did not cover NGOs and also not Poland, the latter not being a member of the EU at the time.
We started the first survey (1999) to get reliable data on business lobbying in the EU:1 Who is involved?
What strategies and instruments do actors prefer? Which institutions at national and EU level do they consider to be important and which do they contact frequently? Who are preferred partners? And apart from country origin, do organizational properties and membership characteristics make a difference?
With our recent research (2012) we want to find out how the business world responds to changes in their lobbying environment. In the last decade conditions have changed considerably. Especially three devel- opments are likely to have a noticeable impact on the relations of trade associations to EU decision- makers:
- Enlargement: The widening of the EU from 15 to 25 member countries in 2004 and to 27 member countries in 2007 and with it the inclusion of countries with a weak tradition of independent economic interest association may have an effect both for the EU umbrellas and the direct lobbying of national associations at EU level.
- Institutional reforms: The further increase of decision making by majority in the Council and increasing competence of the European Parliament (EP) through the co-decision procedure since the Treaty of Nice (2001) have altered the institutional constraints and opportunities.
- Governance: The White Paper on European Governance (Commission 2001) and subsequent activi- ties have set off a turn to “good governance” with an emphasis on new modes of governance, an elaborate consultation regime, and a call for social corporate responsibility.
The empirical analysis presented here draws on the 1999 EUROLOB I database and the 2012 EUROLOB II database. The paper provides information on three main topics,
(1) The actor profile,
(2) EU interest intermediation in 2012,
(3) Comparison of the lobbying approach 1999 and 2012.
The data was collected in form of a total-population survey. For address collection we started with well- established directories;2 in addition we carefully scanned the research literature for names of BIAs and
1 For a general summary of EUROLOB I see Kohler-Koch/Quittkat 1999: Intermediation of Interests in the European Union; Working Paper – Mannheim Centre for European Social Research, 9/99.
2 France:
- Mouvement des Entreprises de France 2011: L'Annuaire du MEDEF 2011/2012. Paris: Medef.- Confédération générale du patronat des petites et moyennes entreprises 2011: (http://www.cgpme.fr/le-reseau/federations; accessed 7.12.2011)
Germany:
- Oeckl. 2009: Taschenbuch des öffentlichen Lebens. Deutschland 2010. Bonn: Festland Verlag GmbH.
8/ Working Papers 151 - Mannheimer Zentrum für Europäische Sozialforschung
used internet search-engines in order to compensate for inconsistency in data availability. Despite our efforts, the set of addresses turned out to be partly inaccurate with roughly ten percent stray letters due to considerably volatile “birth and death rates” of BIAs. Thus the addresses collected are likely to be incom- plete.
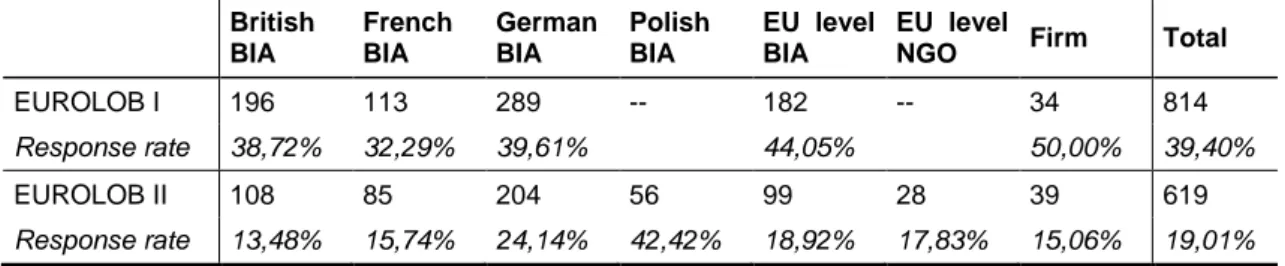
Table 1: Size of dataset EUROLOB I and dataset EUROLOB II
British BIA
French BIA
German BIA
Polish BIA
EU level BIA
EU level
NGO Firm Total
EUROLOB I 196 113 289 -- 182 -- 34 814
Response rate 38,72% 32,29% 39,61% 44,05% 50,00% 39,40%
EUROLOB II 108 85 204 56 99 28 39 619
Response rate 13,48% 15,74% 24,14% 42,42% 18,92% 17,83% 15,06% 19,01%
As regards the rate of returns we find that the willingness to participate in our written survey has decreased considerably in 2012 compared to 1999 (see Table 1) despite offering the possibility to use both, the paper or the online-version of our questionnaire, and despite the same number of reminding letters in 1999 and 2012. From the comments we received it is quite clear that a number of potential survey participants, especially companies, generally pursue a policy of non-participation in surveys, disregarding whether they are for commercial or for academic use. In addition, we find that many BIAs which only present part of an industrial sector, “delegated” participation in our survey to their “branch BIA”; similarly, some national BIAs asked us to contact rather “their” EU level BIA, i.e. many national BIAs referred us to higher-level sectoral or territorial BIAs. These they considered better placed to answer our questions, not least because EU lobbying often is delegated to these higher-level organizations.
In more abstract terms, three main reasons for a decline in the response rate can be pointed out: (1) Sur- vey inflation: Cost reduction thanks to new possibilities of electronic surveying has resulted in a prolifera- tion of surveys and this obviously provoked a “participation fatigue” of potential participants. (2) Stronger division of labor: specialized associations channel their EU concerns through the Brussels’ office of their higher-level association (3) Political-economic environment of 2012: The economic and financial crisis forced business associations to concentrate their resources on crisis management.
Poland:
- Urząd Zamówień Publicznych 2010: Lista organizacji uprawnionych do wnoszenia środków ochrony prawnej w 2010r, (http://www.uzp.gov.pl/cmsws/page/?D;1290; accessed 8.10.2010).
- Ministerstwo Gospodarki, Departament Analiz i Prognoz 2007: Funkcjonowanie samorządu gospodarczego w Polsce, Warsaw 2007 (http://www.mg.gov.pl/NR/rdonlyres/EECFD29E-4EE1-4B81-B38B-3421FD74C13E/31956/Funkcjonowaniesamorzdu
gospodarczegowPolsce.pdf, accessed 11.10.2010).
UK:
- Trade Association Forum 2011. Trade Associations (http://www.taforum.org/Members; accessed 12.10.2011).
EU NGOs:
- Social Platform 2011: Members and associate members (http://www.socialplatform.org/AboutUs.asp?DocID=8144; accessed 17.11.2011)
EU:
- Oeckl. 2009: Taschenbuch des öffentlichen Lebens. Europa 2009/10 [Directory of public life. Europe 2009/10], Bonn: Festland Verlag GmbH.
Firms:
- Financial Times 2012: Top 150 Non-Publicly listed companies (http://www.ft.com/cms/s/2/5de6ef96-8b95-11db-a61f- 0000779e2340.html#axzz1l29nFGGH; accessed 31.1.2012)
- FORTUNE Magazine 2012: FORTUNE Magazine's annual ranking of the world's 500 largest companies (http://money.cnn.com/magazines/fortune/global500/; accessed 30.1.2012)
- Rzeczpospolita: Lista 500. Lista największych przedsiębiorstw w polskiej gospodarce (http://www.rzeczpospolita.pl/
pliki/rankingi/lista500/alfabetyczny.pdf; accessed 3.10.2010).
1. Actor profile 2012
All organizations (claim to) represent a large portion of their potential members, though with significant variations across countries. BIAs from the EU level and from Germany stand out with very high levels of representativity. Next come Polish BIAs, whereas a considerable number of British and French BIAs only represent a part of their potential members (see Table 2)
Table 2: Representativity, i.e. share of potential members of associations (in percent)
British BIA
French BIA
German BIA
Polish BIA
EU level BIA
EU level NGO
1-25% 21,52 17,39 8,50 13,64 7,23 20,00
26-50% 17,72 23,19 11,76 11,36 9,64 20,00
51-75% 20,25 21,74 29,41 36,36 26,51 6,67
76-100% 40,51 37,68 50,33 38,64 56,63 53,33
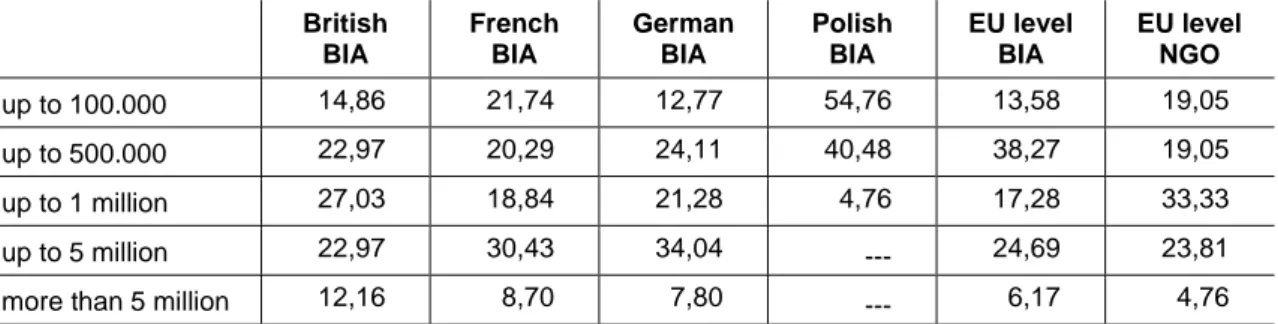
Table 3: Financial resources of associations (in percent)
British BIA
French BIA
German BIA
Polish BIA
EU level BIA
EU level NGO
up to 100.000 14,86 21,74 12,77 54,76 13,58 19,05
up to 500.000 22,97 20,29 24,11 40,48 38,27 19,05
up to 1 million 27,03 18,84 21,28 4,76 17,28 33,33
up to 5 million 22,97 30,43 34,04 --- 24,69 23,81
more than 5 million 12,16 8,70 7,80 --- 6,17 4,76
British and German BIAs are financially well off. French BIAs differ in so far as the share of financially weak (and obviously rather small) BIAs is twice as high. Polish BIAs are out of line with strikingly low re- sources (see Table 3). Indeed, Polish BIAs are the least well equipped financially, which has also an im- pact on their EU lobbying strategies (see below).
Having a representation at the site of the EU institutions is certainly a matter of resources. Thus, it is not surprising that only few Polish BIAs have an office in Brussels (see Table 4). However, resources alone do not explain why so many more German BIAs have an office in Brussels compared to French and British BIAs. Geographical distance and fast train connections from London and Paris to Brussels may make a difference, but more important are different lobbying traditions. It needs further examination if one of the reasons is that British BIAs and companies are more inclined to cooperate with law firms, think tanks or consultancies. Above all we have to find out by interviews why today far less British and French BIAs have a representation in Brussels than 12 years ago, whereas the share of German BIAs with an office in Brus- sels has increased.
Table 4: Office in Brussels (in percent)
British BIA French BIA German BIA Polish BIA Firm
2012 8,20 21,10 44,30 4,20 41,70
1999 15,48 32,41 28,89 --- n. a.
EU level BIA and EU level NGO are not listed because, per definition, they (nearly all) have an office in Brussels.
10/ Working Papers 151 - Mannheimer Zentrum für Europäische Sozialforschung
Another relevant profile characteristic of interest representatives is their enrollment at the Commission’s and the European Parliament’s Transparency Register, a central register in which any organization en- gaged in activities aiming at influencing the EU decision making process is expected to register by giving information on interests pursued and the level of resources invested in these activities. The readiness to list is most pronounced among EU level NGOs, which have been very active in supporting its implementa- tion, and it is also very high among EU level BIAs. National BIAs consider this to be less useful with the exception of those which have an office in Brussels. It comes as no surprise that the registration of firms and national BIAs correlates highly with a representation in Brussels. When you open an office you want to make sure that you fulfill the formal conditions to get informed, to gain access and to be heard (see Table 5).
Table 5: Registration in Transparency Register (in percent)
British BIA
French BIA
German BIA
Polish BIA
EU level BIA
EU level
NGO Firm
Listed 22,70 45,30 55,80 11,90 79,10 81,80 46,90
2. EU interest intermediation in 2012
2.1 Appraisal of and relations to EU institutions
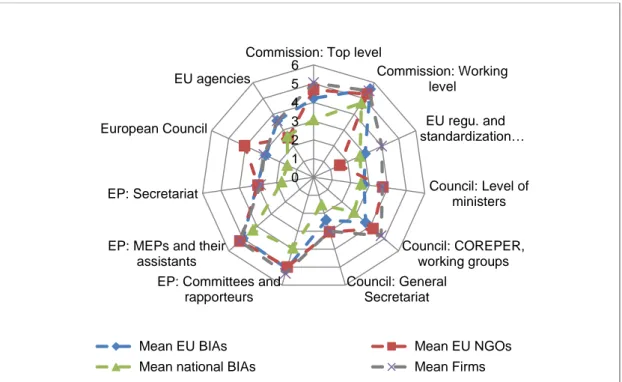
Importance of EU institutions for EU interest intermediation
The answer to the question of how important contacts with the EU institutions are for the representation of the organizations’ interests largely reflects the relative importance of the different EU public actors in the process of EU policy making: The working level of the Commission ranks first, followed by committees and rapporteurs of the European Parliament (EP) and members of the EP (see Figure 1). Further, for EU level organizations and firms, EU institutions rank higher in importance than for national BIAs. EU level NGOs, finally, diverge from the general assessment in two respects: they have a comparatively low esteem of the EU regulatory and standardization authorities and attribute more importance to the European Council.
all; 6 = very important)
Frequency of contacts
The frequency of contact follows the ranking of importance (see Figure 2). However, the contact patterns with EU institutions not only reflect differences in importance but also differences in the accessibility of the respective institutions (see Table 6). Like in the past, the EP and the Commission are rated as more ac- cessible than the Council, and the European Council comes last. Indeed, all interest representatives in our dataset have contacts with the EP and around 96 percent have contacts with the European Commission, although the frequency of contacts varies.
Table 6: Share of interest representatives who assign EU political institutions a high accessibility (in percent)
Commission Council EP European Council
Co-operative relationship 61,32 52,27 65,78 48,17
Easy access to information 58,95 32,93 59,23 46,10
In general, EU level BIAs, EU level NGOs and firms have more frequent contacts with EU institutions than national BIAs (see Figure 2). All three actor groups have far more frequent contacts with both the Commis- sion and the European Parliament than national BIAs (measured in monthly or weekly contacts); EU level BIAs and firms further surpass EU level NGOs and national BIAs with regard to other EU institutions.
0 1 2 3 4 5 6
Commission: Top level
Commission: Working level
EU regu. and standardization…
Council: Level of ministers Council: COREPER,
working groups Council: General
Secretariat EP: Committees and
rapporteurs EP: MEPs and their
assistants EP: Secretariat European Council
EU agencies
Mean EU BIAs Mean EU NGOs
Mean national BIAs Mean Firms
12/ Working Papers 151 - Mannheimer Zentrum für Europäische Sozialforschung
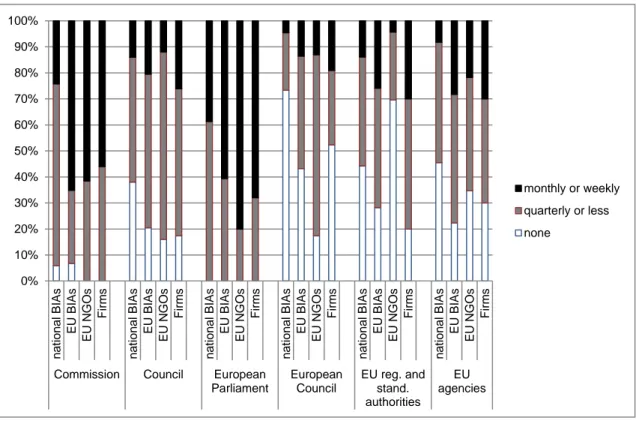
Figure 2: All actors: Frequency of contacts with EU Institutions
When we differentiate between levels of contact (top level or working level) of the Commission and the Council and look at national BIAs country by country, more variations become apparent. The data show that more than half of the national BIAs have no contact to the ministerial level of the Council and also more than half of the national BIAs do not have contact to the working level of the Council, i.e. COREPER.
This only holds true for a quarter of the EU level NGOs and firms. As regards the EU level BIAs, their focus is clearly on the working level of the Council, with 74.39 percent having contact to COREPER and the Council’s working groups, but only 37.80 percent being in contact with the national ministers constituting the top level of the Council.
Taking a closer look at national BIAs, we find that German BIAs are the most active as regards direct EU level contacts (see Figure 3) and hereby are in blatant contrast to British BIAs which show the least direct lobbying activities at EU level. Even a higher share of Polish BIAs, the newcomers in the EU arena, has contacts to EU level institutions than of British BIAs. Yet, those British BIAs which do have contacts are more intensively involved than the Polish or the French BIAs.
0%
10%
20%
30%
40%
50%
60%
70%
80%
90%
100%
national BIAs EU BIAs EU NGOs Firms national BIAs EU BIAs EU NGOs Firms national BIAs EU BIAs EU NGOs Firms national BIAs EU BIAs EU NGOs Firms national BIAs EU BIAs EU NGOs Firms national BIAs EU BIAs EU NGOs Firms
Commission Council European Parliament
European Council
EU reg. and stand.
authorities EU agencies
monthly or weekly quarterly or less none
Light colored column part: monthly or weekly contacts
Medium colored column part: yearly, half-yearly or quarterly contacts Dark colored column part: no contacts
0%
10%
20%
30%
40%
50%
60%
70%
80%
90%
100%
British BIAs French BIAs German BIAs Polish BIAs British BIAs French BIAs German BIAs Polish BIAs British BIAs French BIAs German BIAs Polish BIAs British BIAs French BIAs German BIAs Polish BIAs British BIAs French BIAs German BIAs Polish BIAs British BIAs French BIAs German BIAs Polish BIAs British BIAs French BIAs German BIAs Polish BIAs British BIAs French BIAs German BIAs Polish BIAs British BIAs French BIAs German BIAs Polish BIAs
Commission - Top level
Commission - Working level
Council - Level of Ministers
Council - COREPER, working groups
EP - Committees,
rapporteurs
EP - MEPs, assistants
EU Council EU reg. and stand.
authorities
EU agencies
14/ Working Papers 151 - Mannheimer Zentrum für Europäische Sozialforschung
Initiative of contacts
Figure 4: Share of interest representatives sometimes or often contacted by EU level public actors (in percent)
Divergence in contact patterns obviously also results from initiatives by EU institutions. Our survey docu- ments significant differences (see Figure 4). Nearly all survey participants report that contacts where sometimes or often initiated by the EU institution. The Commission, the EP and also EU level regulation and standardization authorities are very outgoing. Only the Council is reserved when it comes to initiating contacts. More than half of our respondents declared that they have never been contacted by the Council.
Apart from the variations between EU institutions, it is noteworthy that EU level actors profit more than national BIAs or firms from such contact initiatives. When it comes to business, EU institutions today seem to attribute a pivotal role to EU level BIAs as interlocutors. By aggregating their members’ interests and articulating a common view, EU level BIAs are said to help reduce transaction costs and therefore are relevant contact partners for EU institutions.
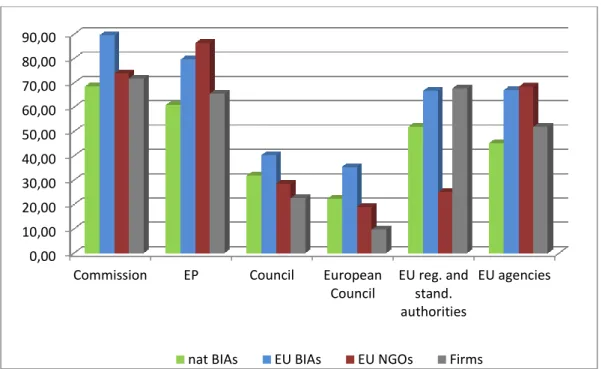
Access to information of EU institutions
EU information is easily accessible though this varies, as expected, among institutions (see Table 7). The business world has a very long experience with information gathering from EU institutions and above all has been in close contact with the Commission from the very beginning. EU level NGOs, when compared to business, have mostly arrived much later but met open doors and thus also maintain close links to the European Commission and to the European Parliament.
Next to the EP and the Commission come EU regulation and standardization authorities as well as EU agencies. They, too, offer easy access to information and thus live up to their work description which com- prises information provision. The EU institutions considered least open as regards access to information are the Council and the European Council.
0,00 10,00 20,00 30,00 40,00 50,00 60,00 70,00 80,00 90,00
Commission EP Council European Council
EU reg. and stand.
authorities
EU agencies
nat BIAs EU BIAs EU NGOs Firms
Table 7: Access to information from EU institutions (mean; 1 = very difficult; 6 = not difficult at all)
Commission Council EP European
Council
EU reg. and stand. au-
thorities
EU agencies
Mean 4,45 3,72 4,53 3,73 4,30 4,22
2.2 Appraisal of and relations to national institutions
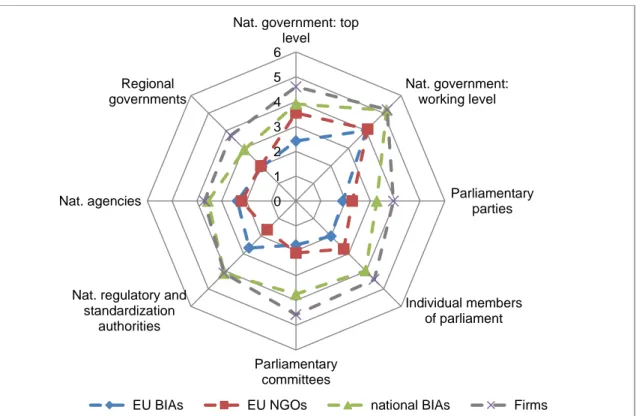
Importance of national institutions for EU interest intermediation
National institutions are still a strong player in the EU policy making. This is the clear message of our survey respondents. Evidently the national business interest associations and firms attribute higher im- portance to national institutions than the EU level BIAs and also the EU level NGOs (see Figure 5).
Figure 5: Importance of contacts with national institutions for EU lobbying (mean; 1 = not im- portant at all; 6 = very important)
Contacts
Like contacts to EU institutions, contacts to national institutions follow the assessment of importance.
Considering their embeddedness in the national system, it is logical that national BIAs and firms have more frequent contacts with national institutions than EU level actors (see Figure 6).
0 1 2 3 4 5 6
Nat. government: top level
Nat. government:
working level
Parliamentary parties
Individual members of parliament
Parliamentary committees Nat. regulatory and
standardization authorities Nat. agencies
Regional governments
EU BIAs EU NGOs national BIAs Firms
16/ Working Papers 151 - Mannheimer Zentrum für Europäische Sozialforschung
National BIAs address primarily the working level of government (from the permanent secretary down to the desk officer) and have less frequent, but still rather continuous contacts with individual members of Parliament (see Figure 6).
It is worth noting that a very small percentage of national associations direct their lobbying efforts directly to EU institutions and do not contact national institutions (7.73 percent). EU level BIAs concentrate their national contacts also on the working level of government, but otherwise focus mainly on more “technical lobbying”, namely on national regulatory and standardization authorities and on national agencies (see Figure 6).
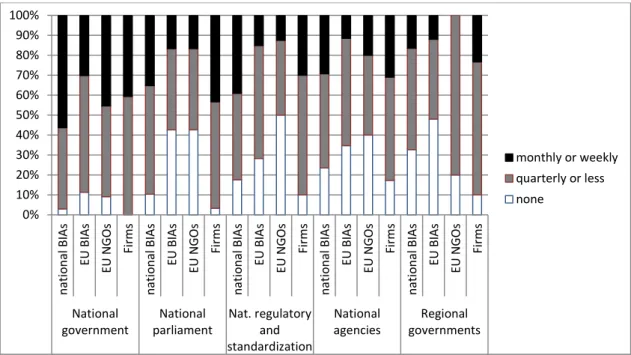
Figure 6: All actors: Frequency of contacts with national institutions in the context of EU law mak- ing (in percent)
As regards the frequency of contacts with national institutions in the context of EU lobbying, we also find national differences (see Figure 7). BIAs from all case countries have frequent contacts with their national government and clearly concentrate their attention to the working level of government. In comparison, the share of the Polish BIAs having contacts with their national government is highest . Compared to the other national BIAs, the German BIAs show a high concentration on parliamentary party groups. Finally, the share of BIAs having contacts with national regulatory and standardization authorities is lowest in France, whereas British BIAs have particularly frequent contacts with these institutions.
0%
10%
20%
30%
40%
50%
60%
70%
80%
90%
100%
national BIAs EU BIAs EU NGOs Firms national BIAs EU BIAs EU NGOs Firms national BIAs EU BIAs EU NGOs Firms national BIAs EU BIAs EU NGOs Firms national BIAs EU BIAs EU NGOs Firms
National government
National parliament
Nat. regulatory and standardization
authorities
National agencies
Regional governments
monthly or weekly quarterly or less none
Light colored column part: monthly or weekly contacts
Medium colored column part: yearly, half-yearly or quarterly contacts Dark colored column part: no contacts
0%
10%
20%
30%
40%
50%
60%
70%
80%
90%
100%
British BIAs French BIAs German BIAs Polish BIAs British BIAs French BIAs German BIAs Polish BIAs British BIAs French BIAs German BIAs Polish BIAs British BIAs French BIAs German BIAs Polish BIAs British BIAs French BIAs German BIAs Polish BIAs British BIAs French BIAs German BIAs Polish BIAs British BIAs French BIAs German BIAs Polish BIAs British BIAs French BIAs German BIAs Polish BIAs
Nat. government: top level
Nat. governmnent:
working level
Nat. parliament:
parties
Individual members of nat. parliament
Nat. parliament:
comittees
Nat. regulatory and standardization
authorities
Nat. agencies Regional governments
18/ Working Papers 151 - Mannheimer Zentrum für Europäische Sozialforschung
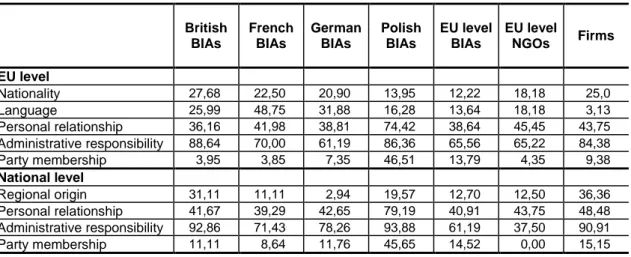
2.3 Selection of contact partners and timing of activities
Selection of contact partners
Selecting a contact partner follows roughly the same logic at the national as well as at the European level, with some minor, though telling, national differences (see Table 8). With one exception (national level contacts of EU level NGOs), administrative responsibility is put first, and personal relationship comes second. It is striking that the Polish BIAs attach high importance to party membership both at EU and national level. Party-membership is an important selection criterion for Polish BIAs because of the growing role of political cleavages in Poland. Opinion polls show that identification with political parties and party membership has become a considerable aspect of societal division in Poland, the main cleavage in the Polish party system being between the “Civic Platform” (Platforma Obywatelska (PO); center-liberal) and the party “Law and Justice” (Prawo i Sprawiedliwość (PiS); right-conservative).
Table 8: Percentage of interest representatives considering the following criteria as very important (categories 5 and 6) for the selection of their contact partner
British BIAs
French BIAs
German BIAs
Polish BIAs
EU level BIAs
EU level
NGOs Firms
EU level
Nationality 27,68 22,50 20,90 13,95 12,22 18,18 25,0
Language 25,99 48,75 31,88 16,28 13,64 18,18 3,13
Personal relationship 36,16 41,98 38,81 74,42 38,64 45,45 43,75 Administrative responsibility 88,64 70,00 61,19 86,36 65,56 65,22 84,38
Party membership 3,95 3,85 7,35 46,51 13,79 4,35 9,38
National level
Regional origin 31,11 11,11 2,94 19,57 12,70 12,50 36,36
Personal relationship 41,67 39,29 42,65 79,19 40,91 43,75 48,48 Administrative responsibility 92,86 71,43 78,26 93,88 61,19 37,50 90,91
Party membership 11,11 8,64 11,76 45,65 14,52 0,00 15,15
Timing of activities
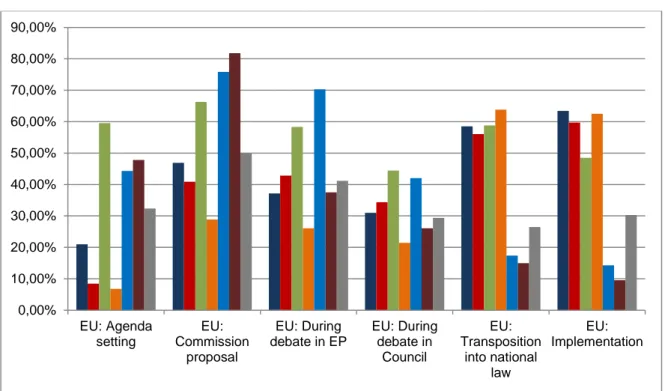
Although it is the typical advice of any lobbying handbook that (EU) lobbying should start as early as pos- sible, it is eye-catching that the majority of the national BIAs do not at all or only occasionally intervene when the political agenda is set (and this has only very slightly changed over the years). They rather take action in the later phases of the policy cycle and compared to the EU level interest groups (EU level BIAs and EU level NGOs) most of the national BIAs are latecomers (see Figure 8 and Figure 9). An exception to this rule presents the German case: at EU level, German BIAs are early birds, just like EU level BIAs and EU level NGOs. It is noteworthy that the share of German BIAs actively trying to influence the political agenda at EU level and at national level is higher than of any other group in our dataset.
At the national level the domestic BIAs intervene far earlier but again with marked differences among countries. The Polish BIAs mostly only become very active in the last stage, when EU laws are transposed into national law or during the implementation by the national administration. The brief membership of Poland in the EU cannot be the only reason, because French BIAs act in a similar manner: Hardly any of the French or the Polish BIAs are present at the initial stage of EU policy-making, neither at the EU level nor at the national level.
tive during the different steps of the EU policy cycle (in percent)
Figure 9: Timing of interest representation at national level: Share of interest representatives often active during the different steps of the EU policy cycle (in percent)
0,00%
10,00%
20,00%
30,00%
40,00%
50,00%
60,00%
70,00%
80,00%
90,00%
EU: Agenda setting
EU:
Commission proposal
EU: During debate in EP
EU: During debate in
Council
EU:
Transposition into national
law
EU:
Implementation
BIAs UK BIAs France BIAs Germany BIAs Poland EU BIAs EU NGOs Firms
0,00%
10,00%
20,00%
30,00%
40,00%
50,00%
60,00%
70,00%
80,00%
90,00%
National: Agenda setting
National: Formulation of national position
National: Transposition into national law
National:
Implementation BIAs UK BIAs France BIAs Germany BIAs Poland EU BIAs EU NGOs Firms
20/ Working Papers 151 - Mannheimer Zentrum für Europäische Sozialforschung
2.4 Disparate capacities: The importance of size and being on the spot
Our data brings to the open that the size of an association – measured in terms of budget – and a repre- sentation in Brussels make a difference (see regression analyses in the appendix). Whenever budget and being present in Brussels had a significant influence on the responses, it conveyed the impression that it is a matter of capacity and low transaction costs. Both characteristics often had similar effects which is trivial when it concerns lobbying contacts. It is to be expected that the respective associations have significantly more contacts to all EU institutions. It is more telling that they deviate less in their contacts to the working level of the Commission than in their contacts to the political decision makers. More precisely, they deviate in their contacts to the top level of the Commission, to the European Council and to the Council of Minis- ters, including COREPER and the Council secretariat. And they enjoy far closer relationships with the EP than those national BIAs which do not have an office in Brussels. The intensity of contacts with the EP is very high, both to the committees and the rapporteurs and to the individual members of the EP, and less intensive but still very frequent with the secretariat of the EP. Budget is also an advantage for close con- tacts with the national level, whereas an office in Brussels which helps in getting early information does not make a difference.
3. Continuity and change in the lobbying approach of BIAs from 1999 to 2012
3.1 Changes in the conditions of interest intermediation
We started the EUROLOB II project on the assumption of marked changes in EU lobbying conditions including an increase of interest groups. The latter has been confirmed with regard to business interest associations: The number of addressees of our questionnaire in Germany, France, Great Britain, and at the EU level increased from roughly 2.000 in 1999 to 3.300 in 2012. The national and also the EU level BIAs confirmed this trend. When asked to assess changes in the conditions of interest intermediation, the overwhelming majority expressed the opinion that considerable changes have occurred since the 1990s (national BIAs: 81.36 %, EU level BIAs: 94.74 %). The perceived changes are equally pronounced with regard to an increase in the competition between interest groups and the growing relevance of political considerations. Most respondents also agree that the importance of the European Commission (63,03 %) and the European Parliament (74,60 %) has increased considerably over the years. In view of this widely- held assumption it is noteworthy that the contacts of the business world both to EU institutions and to national institutions have declined. EU interest representation has obviously become more centralized. As already mentioned above, small and highly specialized associations tend to delegate their EU lobbying to their federations which often operate through their representations in Brussels.
3.2 Changes in the appreciation of target institutions
When comparing the level of importance attributed to the EU institutions in 1999 and 2012 the data give a clear picture (see Figure 10 and Figure 11): In general, BIAs rate the importance of national and EU institu- tions lower than 12 years ago. As regards the national institutions an exception to this rule is the im- portance national BIAs attribute to the working level of the national government, which has remained stable. As regards EU level institutions we find two exceptions: The working level of the Commission is
considered to be as important as before and the EP has gained a higher standing among EU level BIAs except for the secretariat. EU regulatory and standardization authorities now definitely rank lower in the assessment of associations. The ratings of the Council are slightly lower than before among the national BIAs and unambiguously lower than before among the EU level BIAs. It is remarkable that EU associations de-emphasize the importance not just of the Council of Ministers but also of COREPER and of the Council secretariat.
Figure 10: National and EU level BIAs: Change in importance attributed to EU institutions (compar- ison of means 1999 – 2012)
Figure 11: National and EU level BIAs: Change in importance attributed to national institutions (comparison of means 1999 – 2012)
However, we have to remind the reader again that these figures could be misleading because we have to take into consideration that the decline in appreciation is relative. In other words, the importance attributed
-2,90 -2,40 -1,90 -1,40 -0,90 -0,40 0,10 0,60
Commission: top level Commission: working level EU regulatory and standardisation authorities Council: level of ministers Council: COREPER Council: General Secretary Parliamentary committees Members of parliament EP: General Secretary
national BIAs EU BIAs
-2,90 -2,40 -1,90 -1,40 -0,90 -0,40 0,10 0,60
Nat. government: top level Nat. government: working level Parliamentary parties Individuel members of parliament Parliamentary committees Nat. regulatory and standardisation authorities
national BIAs EU BIAs
22/ Working Papers 151 - Mannheimer Zentrum für Europäische Sozialforschung
to the Commission (top level and working level) used to be comparatively high in the past and the rising appreciation of the EP does not bring the EP up to the level of importance attributed to the Commission’s directorates-general.
Table 9: National and EU level BIAs: weekly and monthly contacts in percent of total contacts (1999 – 2012; in percent)
Contacts to … the Commission the Council the EP
Work level Top level Ministers COREPER Committees Members
Weekly
1999
National BIAs 10,70 2,49 1,69 4,40 4,00 6,11
EU BIAs 42,38 8,40 0,00 7,07 8,90 16,00
2012
National BIAs 11,97 3,35 2,70 7,87 20,88 10,98
EU BIAs 42,86 6,25 9,68 9,84 47,06 26,83
Monthly
1999
National BIAs 21,93 8,71 11,86 15,72 15,60 19,61
EU BIAs 24,50 12,21 14,29 17,17 25,20 28,00
2012
National BIAs 14,08 9,50 9,91 15,75 16,12 19,22
EU BIAs 26,19 17,19 12,90 16,39 14,12 26,83
Notwithstanding this overall decline, among those who have contacts, the frequency of contacts increased.
This is most evident when we look at those who have monthly, and even more important, weekly contacts (see Table 9). Though the result is mixed, the data show three trends: First, the national BIAs have be- come more active contacting political decision makers (top level of the Commission) and their national representatives in the EU (Council and COREPER). Secondly, as expected, they contact more often the EP (individual members of the EP, and even much more so EP committees and rapporteurs). Finally, as regards contacts of national BIAs to the administrative level of the Commission, the share of those having weekly contacts remained stable whereas the share of national BIAs having monthly contacts with the working level of the Commission decreased by nearly eight percent points, underpinning our hypothesis of a stronger division of labor today than a decade ago with specialized associations channeling their EU concerns through their higher-level association.
3.3 Old and new instruments of interest intermediation
In general, all actors agree that the traditional lobbying instruments such as personal, targeted and regular contacts as well as position papers are the most useful lobbying instruments (see Table 10). The participa- tion in committees and expert groups is more appreciated by the EU level actors than by the national BIAs and firms, and also the rather expensive exercise of presenting scientific expertise is slightly more appre- ciated by the EU level BIAs and again by firms. The mobilization of the public and the media is the tradi-
tional lobbying instrument the least appreciated by the BIAs, with the EU level BIAs being even more reluc- tant than the national BIAs to use this instrument.
Table 10: Traditional and new lobbying instruments
Position papers Personal contacts Regular contacts, back- ground information Targeted contacts Participation in expert groups committees Presentation of scientific expertise Mobilization of the public and media Participation in policy forums, platforms, hearings Participation in online- consultations Participation in conferences
All
Mean 4,74 5,25 5,01 5,12 4,70 4,13 3,82 3,97 3,77 3,72
Firms
Mean 4,74 5,14 5,20 5,35 4,74 4,32 4,45 4,23 4,12 3,97
NGOs
Mean 4,76 5,31 5,27 5,28 5,00 4,05 4,20 4,54 3,56 3,88
EU BIAs
Mean 4,98 5,47 5,22 5,47 5,04 4,35 3,48 4,43 4,15 4,10
Nat. BIAs
Mean 4,68 5,20 4,92 5,00 4,60 4,06 3,82 3,79 3,66 3,60
With the new governance approach (White Paper on EU Governance, 2001) the European Commission expanded its consultation instruments. Online-consultations, policy forums, platforms and hearings as well as conferences have become widely used by most Directorates General. In the stakeholders’ view they are less useful than propagated and they are clearly considered to be only second-rank (see Table 10). This holds particularly true for conferences, but also for online-consultations, which have been praised for providing easy access and allowing for openness, inclusiveness and transparency.
3.4 Cooperation patterns
Cooperation was and still is considered to be important; today even more so than in the past (see Figure 12). The plausible assumption that the increase in the competition between interest groups may spur alliance building, however, is not supported by our data.
As to the preference for particular cooperation partners this has not changed. The 1999 data as well as the 2012 data support the assessment that business associations “have a strong preference for dealing with
‘likes’ and with like-minded actors”3 (see Figure 12). Yet, what has changed is the readiness among busi- ness associations, both at national and EU level, to extend cooperation across cleavage (see Figure 13).
3 Eising, Rainer 2009: The Political Economy of State-Business Relations in Europe. Interest Mediation, Capitalism and EU Policy Making, London: Routledge, p. 184.
24/ Working Papers 151 - Mannheimer Zentrum für Europäische Sozialforschung
Figure 12: Usefulness of cooperation with other interest representatives in 1999 and in 2012 (mean;
1= not useful at all; 6 = very useful)
Figure 13: National and EU level BIAs 2012: Perception of extent of cooperation between BIAs and NGOs (in percent)
0 1 2 3 4 5 6
1999: Nat. BIAs 2012: Nat. BIAs 1999: EU BIAs 2012: EU BIAs
0%
20%
40%
60%
80%
100%
nat. BIAs EU BIAs nat. BIAs EU BIAs at national level at EU level
7,37 13,11 6,13 8,43
48,40 49,18
42,90
24,10 44,23 37,70
50,97
67,47
increased remained stable decreased
Summary
Conventional wisdom has it that the growing economic and regulatory power of the EU calls for more active interest representation and the best way to do so, is to get into contact with decision-makers. The respondents to our survey support this assessment but the assessment does not translate one-to-one into strategy. Surprisingly, the share of business actors (we do not have comparable data for NGOs) contacting EU institutions remained more or less constant (about three quarters in 1999 and in 2012), while contacts to national institutions declined significantly from about 87 percent in 1999 to 78 percent in 2012, though national contacts are still slightly more frequent than contacts to the EU level. At closer inspection, howev- er, it turns out that those who have contacts have intensified their relations; more business associations than before now contact the relevant institutions weekly instead of monthly. Thus, it is fair to suppose that the division of labor between associations has changed, with specialized associations channeling their EU concerns through the Brussels’ office of their higher-level association.
It is self-explanatory that efficient interest representation is tantamount with addressing the most important institutions. The European Commission is still considered to be the most important and accessible actor in EU policies and still attracts most of the contacts. The working level of the Commission has top priority for EU lobbying, just as the working level of member state governments.
Some changes have occurred over the past twelve years: Clearly the European Parliament now attracts considerably more attention than before and the national parliaments profited from this upward trend although at a far lower level. In addition, the business world has intensified its contacts to the political actors, namely to the national ministers and the Commissioners.
It comes to no surprise that resources make a difference. The size of budget and staff correlates with activities but it is even more important to have a representative on site. EU level associations, irrespective if they represent business or the non-profit sector, as well as national business associations and firms with an office in Brussels maintain significantly more contacts both to the working and the top level of EU insti- tutions and they also make use of a wider range of lobby instruments than their competitors.
As to the choice of instruments, business actors stick to the proven mix of personal, targeted and regular contacts as well as position papers. Brussels-based business interest associations as well as NGOs are obviously best placed to profit from the participation in committees and expert groups. The mobilization of the public and the media is for all groups only of secondary importance; NGOs and firms for their part appreciate it more than others. The new consultation instruments, which the European Commission intro- duced in the past decade to make EU governance more open, transparent, and participatory, did not re- ceive a very positive response among the professionals. Online-consultations, policy forums, platforms and hearings as well as conferences rank lower than any of the traditional instruments of interest representa- tion.
It goes without saying that national business interest associations differ in their approach to EU interest representation. These differences cannot just be explained by the endowment with resources. National business associations display different patterns concerning the selection of their contact partners, their timing of activities, and their readiness to open a representation in Brussels. For the selection of a contact partner administrative responsibility always ranks first and personal relationship comes second, though with some significant variations. Polish business associations stand out with putting twice as much empha- sis on the importance of personal relationship and four times more emphasis on party membership. For the French, language is an important selection criterion, whereas for firms it is a non-issue. More striking are differences in the timing of the interest representation activities. Only EU level actors, both business inter-
26/ Working Papers 151 - Mannheimer Zentrum für Europäische Sozialforschung
est associations and NGOs, and the German BIAs intervene when the political agenda is set. At the EU level and at the national level alike, the German associations are the early birds, whereas all other national associations are latecomers. It is noteworthy that Polish business interest associations mostly only be- come very active in the last stage of the policy cycle, when EU laws are transposed into national law or in the phase of implementation. The brief EU membership of Poland cannot be the only reason because French associations, too, are barely present at the initial stage of EU policy-making. The largest difference is in having an office in Brussels and here, again, simple explanations such as differences in resources are not fully conclusive. When British BIAs cut their representations in Brussels by half, and French BIAs also dramatically reduce their presence, whereas German offices expand, entrenched attitudes must play a role.
Appendix: Regression analyses focusing on the frequency of contacts with EU and national institutions
Commission:
Top level
Commission:
Working level
Council:
Level of ministers
Council:
COREPER
Council:
General Secretariat
European Council
Constant 2,027 ** 3,070 ** 1,268 * 1,328 * ,826 2,141 **
Nationality (Ref.: EU)
French BIAs -,750 * -1,314 ** ,501 ,120 ,031 ,271
German BIAs -,504 * -,958 ** -,142 ,241 -,103 -,636
Polish BIAs -,285 -,823 * ,042 ,909 * ,584 -,391
British BIAs -,536 -,513 -,267 ,261 ,635 -,186
Office in Brussels ,297 ,675 ** ,664 * ,717 * ,959 ** ,416
Budget size ,333 ** ,291 ** ,171 ,310 ** ,414 ** ,343 **
Share of potential
members ,067 ,113 ,280 * ,163 ,062 ,026
Adj. R² ,174 ** 0,3 ** 0,166 ** 0,144 ** 0,249 ** 0,156 **
N 270 271 94 141 89 81
** Significant at 1 percent level; * significant at 5 percent level EP:
Committees
EP:
MEP
EP:
General Secretariat European Council
Constant 2,200 ** 2,382 ** 1,948 ** 2,141 **
Nationality (Ref.: EU)
French BIAs -,728 * -,891 ** -,445 ,271
German BIAs -,453 -,305 -,591 * -,636
Polish BIAs ,072 ,217 -,412 -,391
British BIAs -,573 -,518 -,304 -,186
Office in Brussels ,749 ** ,808 ** ,564 ** ,416
Budget size ,311 ** ,334 ** ,221 ** ,343 **
Share of potential
members ,292 ** ,092 ,123 ,026
Adj. R² 0,264 ** 0,242 ** 0,155 ** 0,156 **
N 267 251 254 81
** Significant at 1 percent level; * significant at 5 percent level
National government:
Top level
National government:
Working level
National Parliament:
Parliamentary Parties
National Parliament:
MPs
National Parliament:
Parliamentary committees
Regional governments
Constant -,058 1,835 ** -,050 ,368 ,038 ,861
Nationality (Ref.: EU)
French BIAs 1,034 ,887 ** ,917 * 1,072 ** 1,031 ** ,081
German BIAs ,853 ,981 ** 1,592 ** 1,788 ** 1,609 ** 1,298 **
Polish BIAs 1,925 ** 1,755 ** 1,939 ** 2,465 ** 3,205 ** 1,686 **
British BIAs 1,304 ** 1,346 ** 1,554 ** 1,626 ** 2,169 ** ,923 *
Office in Brussels ,818 ** ,466 * ,919 ** ,851 ** ,901 ** ,692 **
Budget size ,326 ** ,353 ** ,308 ** ,246 ** ,278 ** ,067
Share in potential
members ,159 ** ,094 ,105 ,150 ,079 ,132
Adj. R² 0,161 ** 0,176 ** 0,16 ** 0,158 ** 0,231 ** 0,127 **
N 285 301 291 299 290 261
** Significant at 1 percent level; * significant at 5 percent level