Do medical students like communication? Validation of the German CSAS (Communication Skills Attitude Scale)
Abstract
Objectives:Attitudes towards communication skills of medical under- graduates can be gathered using the Communication Skills Attitude
Anne-Kathrin Busch
1Katrin Rockenbauch
1Scale (CSAS). We aimed to develop a German version of the CSAS (CSAS-
Gabriele Schmutzer
1G) in order to explore attitudes towards communication skills in a Ger-
Elmar Brähler
1man cohort. Additionally the potential influence of demographic factors was examined.
Methods:We realized the CSAS-G and conducted a survey with 529
participants from 3 different years of study. We then carried out an ex- 1 University Hospital Leipzig, Department of Psychic plorative as well as confirmatory factor analysis and compared the atti-
tudinal scores. Multiple regression analysis was performed. Health, Division for Medical Psychology and Medical Sociology, Leipzig, Germany Results:The confirmatory analysis confirmed the two-subscale system
revealed by the explorative factor analysis. Students indicate low levels of negative attitudes and moderate levels of positive attitudes. Attitu- dinal scores differ significantly in relation to gender.
Conclusion:The CSAS-G can be used in German cohorts to evaluate attitudes towards communication skills. Medical students in our study show basically a positive approach. Further investigation is necessary to explore and understand attitudes towards communication skills of German medical students.
Keywords:communication, medical education, undergraduate, attitude of health personnel
Introduction
The physician-patient encounter presents an interpersonal process of highest complexity. The decisive key for the arrangement of a healing patient-doctor relationship is professional communication [1]. With regard to the variety of patients´ needs a physician is supposed to master different communicative challenges. Research has re- vealed that professional communication can be acquired as ´a series of learned skills´ [2]. Considering communic- ation skills training in medical education, a process to- wards increasingly detailed educational objectives is ob- served [3], [4]. To support an adequate communication skills teaching and learning medical education integrates attitude development [5] as underlined by the ongoing professionalism debate [6]. Attitudinal work deepens the learners´ understanding of different communication is- sues and skills allow the effective transfer into practice [2]. Ajzen as one of the leading attitude scientists states that an `attitude represents a summary evaluation of a psychological object captured in such attribute dimen- sions as good-bad, harmful-beneficial, pleasant-unpleas- ant, and likable-dislikable.´ [7]. Consequently attitudes facilitate the adaption of the individual to the environment [8]. Furthermore, according to the Theory of Reasoned Action, attitudes influence behavior [9]. In a qualitative study concerning the Attitude-Social Influence-Self-Effic- acy-Model the crucial role of affective components such
as emotions with regard to behavior is indicated [10].
Psychosocial attitudes of primary care physicians are re- lated to their communication behaviors as shown by Levinson and Roter [11]. High levels of psychosocial ori- entation in physicians and medical students are desirable therefore. In contrast Eron [12], [13] noticed a decreasing psychosocial orientation in medical students and shaped the term of dehumanization already in the middle of the twentieth century. This development seems to continue:
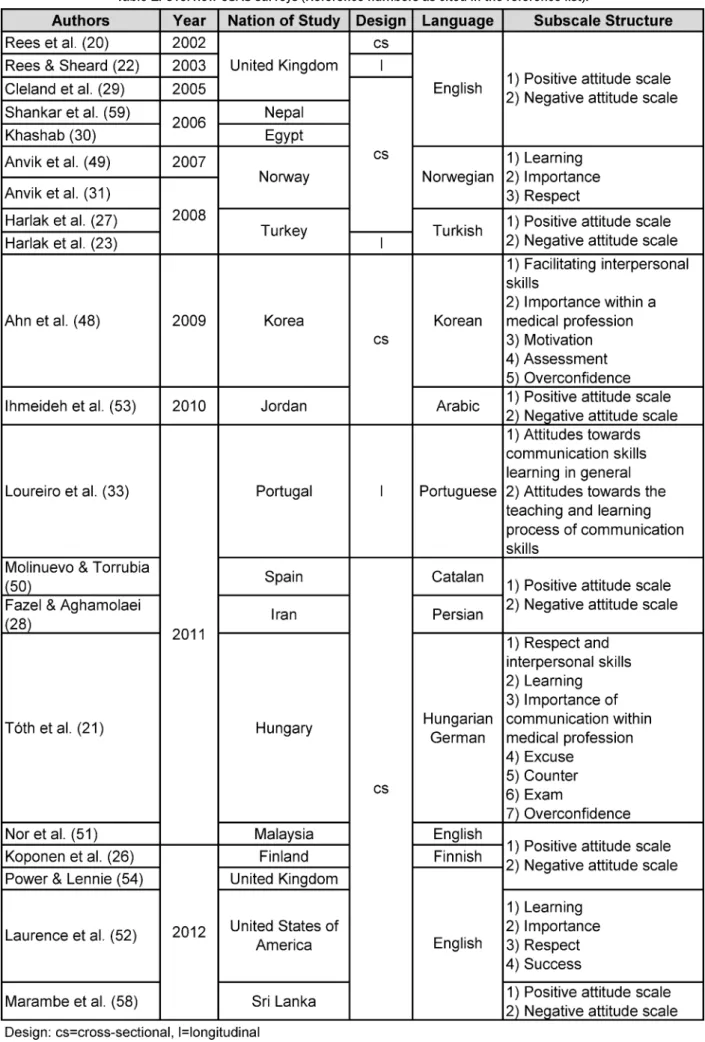
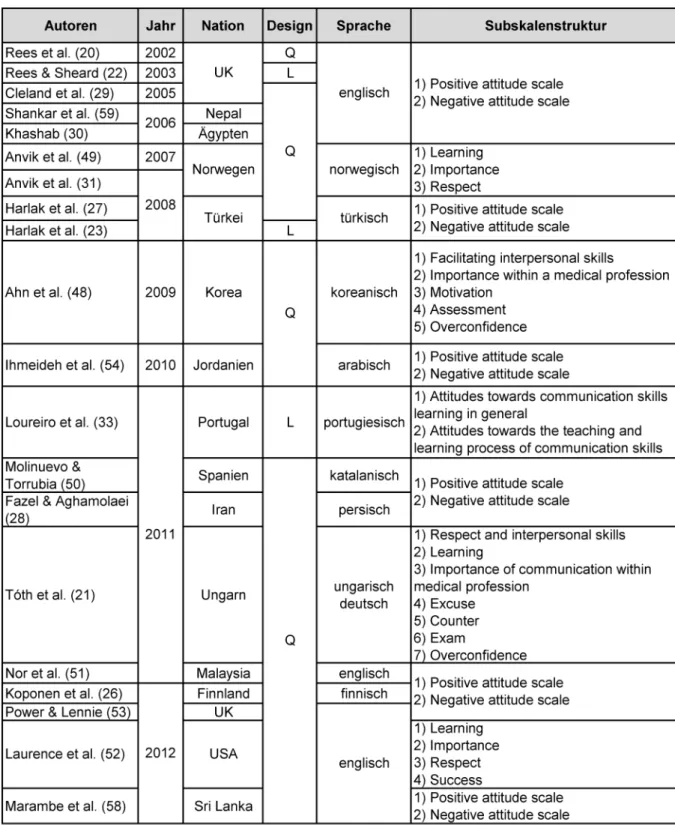
contemporary studies show lack of increase or even de- cline in empathy [14], [15] and patient-centeredness [16], [17], [18]. The given trend is mainly attributed to an assumed negative influence of increasing experience in patient interaction. As consequence the third year in medical education seems to be critical for psychosocial orientation since most medical curricula include more direct patient contact after year two [19]. Current research literature on empathy decline reveals distress as second key factor [14]. Research literature offers an instrument asking for attitudes towards communication skills of medical students: the Communication Skills Attitude Scale (CSAS) [20]. Since its development multiple surveys in- cluded the original English-speaking or a translated CSAS- version proving the continuing interest in attitudes to- wards communication skills (see table 1). A German CSAS version was created and applied with German speaking medical students in Hungary [21]. The corresponding
Table 1: Overview CSAS surveys (Reference numbers as cited in the reference list).
publication is written in Hungarian and therefore inaccess- ible for non-Hungarian speaking audience.
Several studies have examined attitudinal scores before and after a communication skills training [22], [23], [24], [25], [26]. Research using the CSAS shows different patterns of attitude development during medical educa- tion, longing from decrease [27], [28], [29] to increase [30]. Anvik and colleagues found stable cognitive atti- tudes in contrast to decreasing affective attitudes [31], which is similar to the findings of empathy research [32].
Furthermore attitudes towards communication skills ap- pear to be less positive in students with higher levels of state anxiety [33].
So far no data about attitudes towards communication skills of German medical students is available. In order to close this gap in educational research a study with the following aims was carried out:
1. Developing a German CSAS version (CSAS-G), 2. validation of CSAS-G with a German cohort,
3. exploring the attitudinal scores in different years of study and
4. investigating the potential impact of demographic factors on attitudinal scores.
Methods
Setting
The cohort in this cross-sectional study comprises stu- dents in years 1 (n=88), 2 (n=355) and 4 (n=86). Year 1 students´ experience in patient contact depends on indi- vidual´s activities before entering medical school. The curriculum in the Leipzig university provides lectures on
´Medical Psychology and Medical Sociology´ without any communication skills training in year 1. Year 2 students attend two communication skills courses. The first part covers 18 hours focusing general communication com- bined with examples taken from physician-patient com- munication. Elements such as cooperative communica- tion, active listening [34] and regulation of emotions are integrated. The second training unit covers 21 hours and comprises specific conversation techniques in the physi- cian-patient encounter such as shared-decision making, dealing with taboos, breaking bad news or life-style counseling [35], [36], [37]. Year 4 students have compar- atively much patient contact due to a regular bed-side teaching and compulsory clerkship. In the clinical part no communication skills training is offered.
Data collection
1. Procedure
The original CSAS was translated into German using standard forward-backward procedure supported by a native English speaker. The first author contacted Char- lotte Rees via email for detailed clarification of item meaning. The two steps of translation process were per-
formed repeatedly and supplemented by a pretest until a satisfying German version close to the English original was developed (see table 2, translated CSAS is part of the German version of this article)).
Since students from three different years of medical school with different access to communication skills training were involved, communication skills training re- lated wordings were adapted. Year 1 students have had no contact to communication skills training when answer- ing the questionnaire. Therefore item 12 „Learning com- munication skills is fun.“ was modified into „Learning communication skills will be fun.“ No adaption of wording was indicated for year two students that filled out the CSAS-G shortly after they had attended the communica- tion skills training.
During courses participants had been invited to particip- ate voluntarily. They were informed about anonymous data analysis. The questionnaires were passed to the students by one of the authors giving a short instruction without mentioning the aim of the study. Sensitive per- sonal information was not required and no kind of exper- iment was part of the study. Therefore ethical approval was not necessary considering rules of ethics commission of the University of Leipzig.
2. Instrument
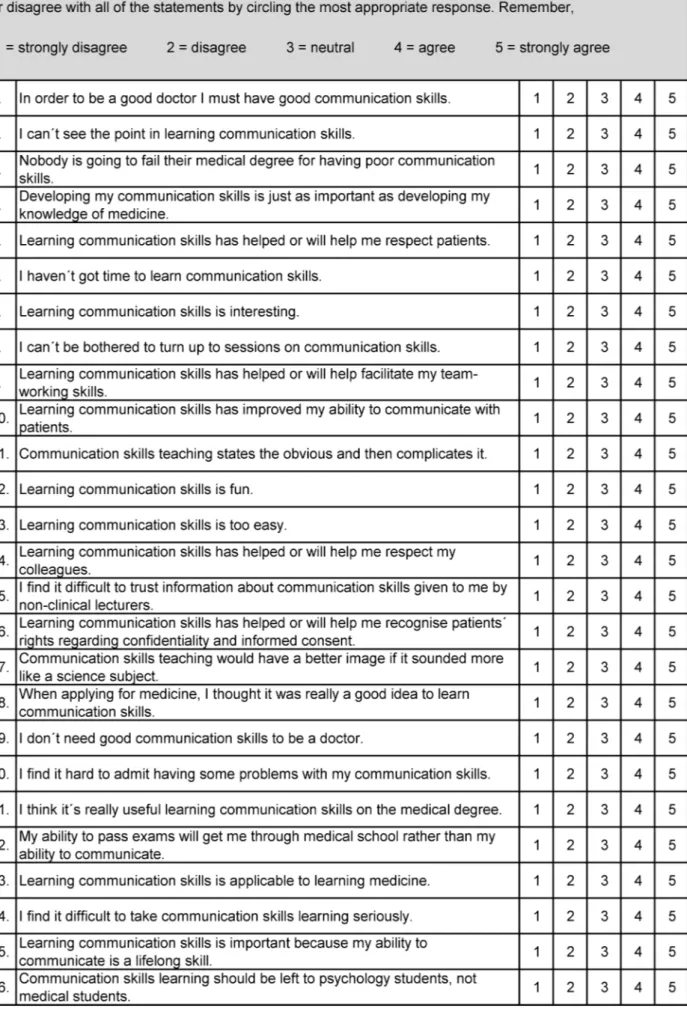
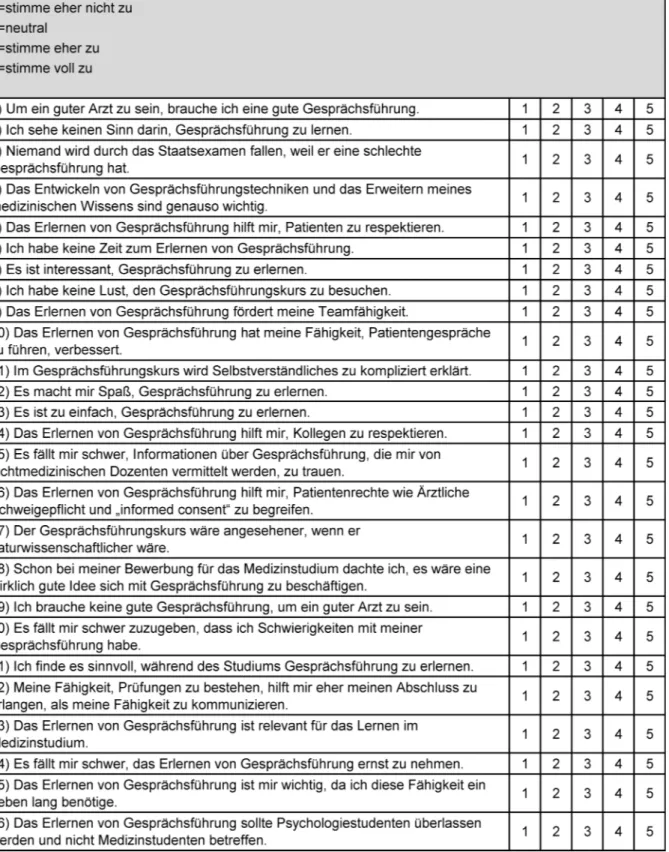
Students of our subject group completed the CSAS-G to- gether with a demographic questionnaire including year of study, age and gender. The CSAS itself consists of 26 items with statements towards learning, teaching and using communication skills. Responders choose along a five-point Likert scale that ranges from 1 (strongly dis- agree) to 5 (strongly agree). Therefore higher values ex- press stronger attitudes. According to the original valida- tion the CSAS measures attitudes along two dimensions:
1. Positive attitude scale (PAS) and 2. Negative attitude scale (NAS).
3. Statistics
Data analysis was performed using the Statistical Package for Social Sciences (SPSS version 18.0). An explorative factor analysis with direct oblimin rotation was conducted and Cronbach´s a for each factor was calculated leading to a reduction in item numbers of the two subscales.
Confirmatory factor analysis to test the factorial structure was performed for the reduced subscales and the original subscales additionally. AMOS 20 was used as statistical program for this purpose. The confirmatory factor ana- lyses were compared to each other based on the following model fit indices: the minimum discrepancy, divided by its degrees of freedom (CMIN/DF); the goodness-of-fit- index (GFI); the normed-fit-index (NFI); the comparative- fit-index (CFI); the Tucker-Lewis-Index (TLI); the root mean square error of approximation (RMSEA); and the Akaike Information Criterion (AIC). The ratio CMIN/DF should be possibly small for a satisfactory model fit [38], [39]. GFI ought to range between 0.97 and 1 and NFI is ideally
Table 2: Communication Skills Attitude Scale (CSAS)
higher than 0.95 [39]. A good model fit is indicated by values of CFI and TLI close to 0.95 or even higher [39], [40]. RMSEA should be 0.05 or smaller. A descriptive in- dicator of the badness of fit is provided by the AIC. It al- lows comparisons of two varying models whereby the lower AIC belongs to the preferable model [38], [39]. In order to test each model we used covariance matrices and the maximum likelihood method approach. Attitude scores were calculated by dividing the sum of item scores of each subscale by the number of items per subscale according to factor analysis result. Correlation between attitude scores and demographic characteristics were studied using Pearson´s correlation coefficient. Normality was assessed by the help of the Kolmogorov-Smirnov test, which indicated a missing normal distribution.
Therefore we used the non-parametric Kruskal-Wallis-H- test for comparison of CSAS scores of different study years. As a result significant rank differences were re- vealed. Assuming that significant non-parametric test results justify using a parametric test without normal distribution, we conducted t-tests to study differences of male and female CSAS scores. Comparisons between CSAS scores of the three different years of study were based on single factor variance analyses with post-hoc Scheffé-test. To determine group differences the following levels of significance were applied: *p<0.05, **p<0.01 and ***p<0.001. Effect sizes (d) were calculated for significant differences in attitude scores because of varying subcohort sizes. Effect sizes d>0.50 are inter- preted as large, 0.50>d>0.30 as medium, 0.30>d>0.10 as small and d<0.10 as trivial [41].
Results
Demographic results
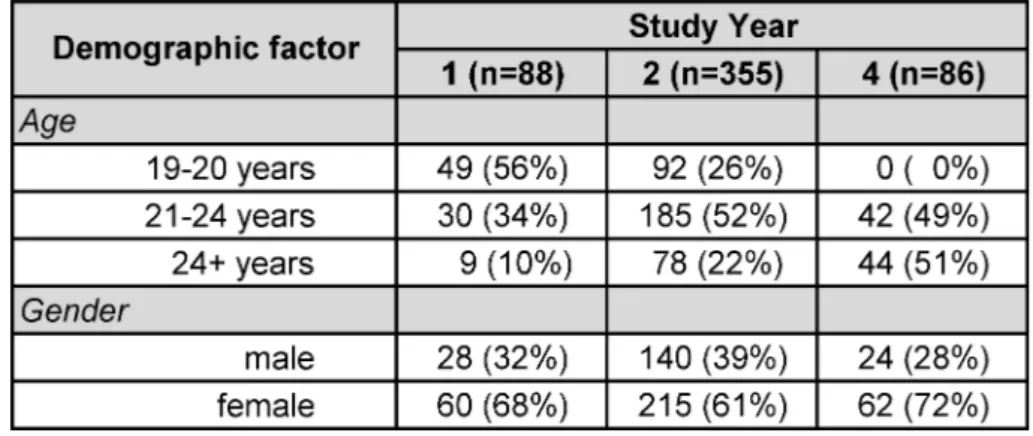
529 questionnaires have been completed satisfactorily.
The subjects´ age ranged from 19 to 47 years (mean age= 26 years). Female participants build the majority in the sample (64%) in comparison to male participants (36%) (see table 3). The gender distribution of this cohort corresponds to the predominantly female fraction of medical students in Germany [42].
Validation of CSAS-G
The Kaiser-Meyer-Olkin measure was 0.899 and a positive p-value of <0.001 was revealed by Bartlett´s test of sphericity, both results showing the adequacy for conduct- ing factor analysis. The initial explorative factor analysis showed seven factors with eigenvalues larger than 1, explaining 58% of variance. The original validation [20]
offered a two-factor solution with 13 items per subscale.
We tried to replicate this in a second explorative factor analysis with determination of two factors. The derived factors were not identical to those in their study. Never- theless, we decided to follow the two subscales´ system because of the qualitative basement provided by Rees
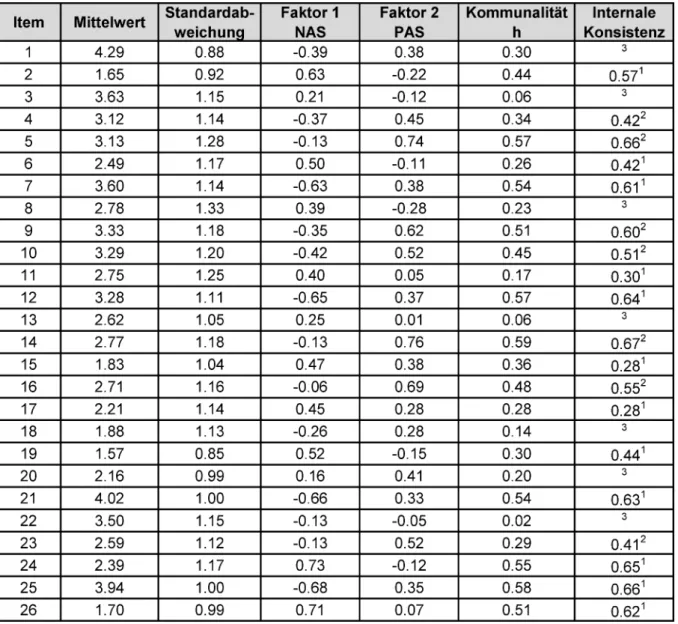
and colleagues [43], [44], [45]. Items were assigned to one factor, if they load at least 0.28 on one factor (see table 4). Items 01, 03, 08, 13, 18, 20 and 22 were ex- cluded due to minimal or ambiguous loading on one factor. As a result the subscale NAS in our sample con- tains 7 items (Cronbach´s α=0.838) and the subscale PAS consists of 12 items (Cronbach´s α=0.864). The Pearson correlation coefficient for PAS score and NAS score in the total study sample is r=-0.49 (p<0.001) in- dicating a converse linear relationship between PAS score and NAS score which supports the founding idea of the original subscale structure: a low PAS score is associated with a high NAS score and reversely.
Subsequently we calculated the confirmatory factor analysis. The results for the original subscales were less satisfactory. The model for the CSAS-G was estimated in a second step. The reduced subscale structure was adop- ted from the results of the second explorative factor analysis. We found an insufficient model fit. Therefore we gradually allowed correlations between single item- influencing error indices by considering the respectively highest modification indices. As a result an assumable model was won. Therefore we consider our two factor model of explorative factor analysis as confirmed. Con- sequently we used the CSAS-G subscales as described in our explorative factor analysis for further calculations.
Attitudinal scores
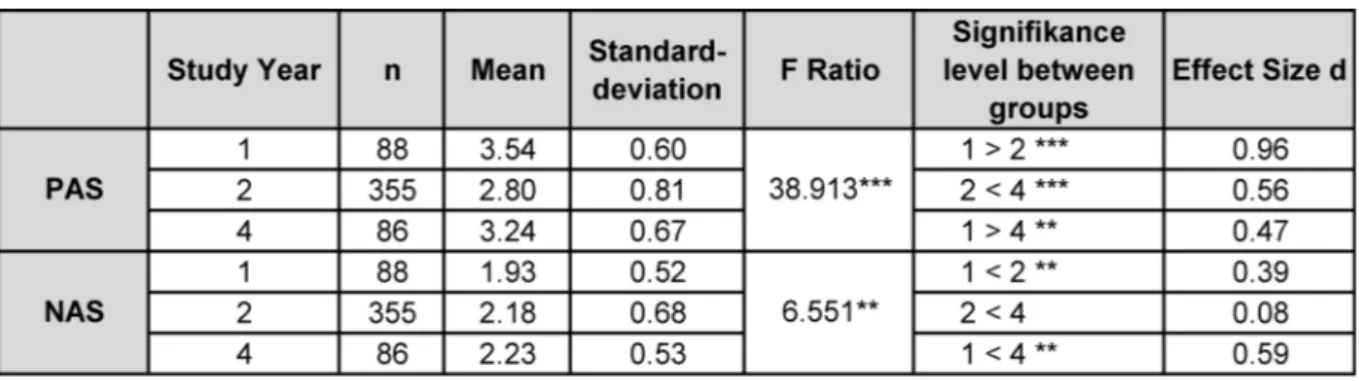
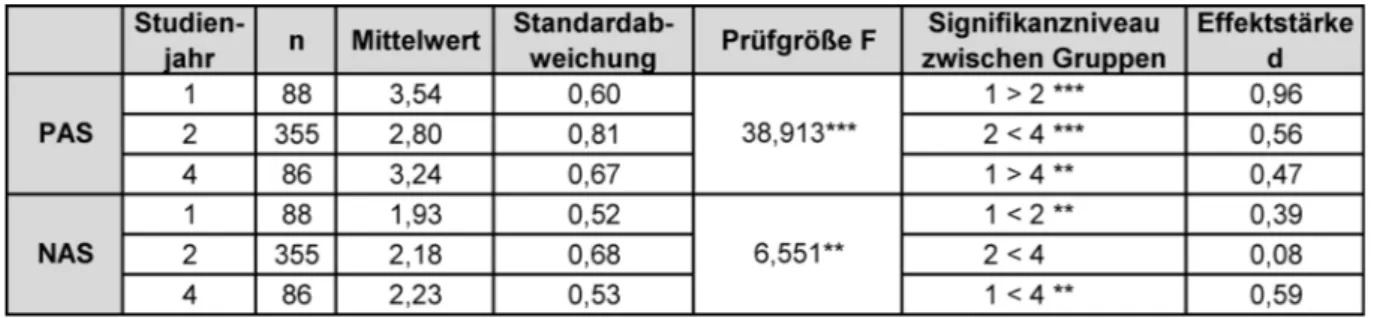
The attitudinal scores of both subscales in relation to year of study are presented in table 5.
Negative attitudes towards communication skills slightly increase from year 1 to year 2. Negative attitudes are more pronounced in year 4 in comparison to year 1. There was a significant difference between year 2 and year 4.
With regard to mean scores measured along the PAS subscale, a significant reduction in positive attitude levels occurs from year 1 to year 2, followed by rising levels from year 2 to year 4.
In the complete study sample female students show lower NAS scores than male students (mean=2.32) (p=0.000;
d=0.48) and higher PAS scores (mean=3.12) than male students (mean=2.80) (p=0.000; d=0.38). Calculating the correlation coefficients for age and subscale scores identified no clear correlation (PAS score/age: r=-0.49 (p=0.43); NAS score/age: r=0.09 (p<0.05)). With respect to gender a correlation was deducted (PAS score/gender:
r=0.21 (p<0.001); NAS score/gender: r=-0.21 (p<0.001)).
Regression analysis
Multiple regression (see table 6) was conducted progress- ively. In the first step a low significance for age is detected referring to the NAS score. However, in the second step adding gender, the significance of age is cancelled whereas the impact of gender on NAS and PAS score is highly significant. We repeated the procedure using year of study instead of age without finding significant different results. As consequence regression analysis reveals that
Table 3: Demographic characteristics of the study sample in absolute numbers and proportions (in parentheses).
Table 4: Rotated component matrix.
gender has some bearing on CSAS scores. In general, the contribution of the regression analysis is limited as indic- ated by R²=0.044/0.041.
Table 5: Single factor variance analyses: Comparison of attitudinal scores in relation to year of study.
Table 6: Multiple regression.
Discussion and conclusion
Discussion
(1) First purpose of this study was to translate the English CSAS (CSAS-E) into German. In our study we used a for- ward-backward procedure for translation to win CSAS-G.
Any translational procedure affects the study results. It is known that even slight changes in item wording influ- ence understanding of interviewees and measurement [46]. The potential impact of translation is magnified by the modifications of wording for study year 1 (see Proced- ure), which therefore presents a study limitation. In our case we consider adaption of wording as necessary to raise the understanding for study participants of study year 1. Despite the translation-related effects the original CSAS contains wordings that stand in contrast to general
recommendations for questionnaire construction. Items should be phrased without suggestion or negation for best possible interviewee understanding [47]. CSAS wordings like ´Communication skills teaching would have a better image if it sounded more like a science subject.´
(Item 17) or ´I don´t need good communication skills to be a doctor.´ (Item 19) can reduce survey participants´
understanding.
(2) Second aim of this survey was to validate the CSAS- G. The two subscales of the CSAS-G are reliable after elimination of seven items. Confirmatory analysis ap- proved this subscale system. To reach a satisfactory model fit stepwise modification was necessary. This fact points out a limited validity of the questionnaire. A validity check of good quality was not feasible due to missing German-speaking instruments that cover medical stu- dents´ attitudes towards communication skills.
Rees and colleagues [20] initially describe a six-factor solution but decided to stick to a two-subscale system.
In multiple validations this two-factor structure was con- firmed, even though in some cases different items were assigned to the two subscales. Three other studies clearly describe elimination of items [48], [49], [50]. Items that have been eliminated repeatedly in several studies were not identified. Beside the two-factor solution of the CSAS- E, other subscale systems were developed (see table 1).
The factor solution for our sample does not replicate any of the other subscale structures described in research literature.
The variety of validation results can be ascribed to translation. Considering the different cultures and lan- guages various factor-models can be evaluated as accept- able. Similar findings are known from other question- naires that have been translated.
Another possible reason for varying CSAS factor solutions can be seen in selection of interviewees. Whereas the original CSAS was designed for medical undergraduates, research literature presents studies with psychology stu- dents [25], dental students [51], [52], teachers [53], di- etetic students [54] and nursing students [50]. In view of known factor analytic difficulties and critical item wordings some authors deduce a need for a modification of the original CSAS [48], [50].
(3) The third aim of our study was to explore the attitudin- al scores of medical undergraduates towards communic-
ation. Our results show low levels of negative attitudes and moderate levels of positive attitudes. We conclude that students in our cohort like communication therefore.
In our study voluntary participation could mean that sur- veyed students are generally more interested in commu- nication. Comparison of mean scores and year of study in our cohort conveys the following picture: the NAS scores increase significantly and PAS scores decrease. According to significant mean differences illustrating a negative trend, one may subsume a decline of attitude towards communication skills in conclusion. With regard to abso- lute means and their development, it is questionable whether this decline truly impacts attitudes. No influential change along the Likert-scale can be found with PAS means around a score of 3 and NAS means around 2. In our study findings no evidence of a decline of practical implication value is present [55]. Research literature of- fers only single other works that show similar results [56], [57]. These conclusions with regard to attitudinal devel- opment have only limited expressiveness because of the cross-sectional study design. To truly measure the course of attitudes during medical school a longitudinal survey is indispensable.
Another limitation is given by the unequal sample sizes per study year. The majority of the cohort is built by year 2 students. To avoid sample size-related bias we calcu- lated additionally the effect sizes which confirmed the significant mean differences.
As known from another CSAS study women show more favorable attitudes [45]. This tendency is also present in our study findings. Two Asian CSAS studies reveal no significant differences between female and male attitude scores [58], [59]. An alternative study result was found in a UK cohort where an increase in male empathy scores in contrast to decreasing female scores was detected [60].
Conclusion and practice implication
In medical education exists sustained interest in attitu- dinal research. The CSAS is a helpful instrument to eval- uate students´ attitudes towards communication skills.
Translation delivered the CSAS-G which proved to be reli- able in our pilot study. In principle CSAS-G is suitable for German-speaking medical education purposes. Under certain circumstances rephrasing of specific items is re- commended for closer adaption to the respective study object. Beside the use of the translated CSAS version, no accompanying qualitative evaluation of the students´
views towards communication skills learning has been conducted. In order to develop a German version consid- ering special thoughts of German students, further re- search will be beneficial [61].
We saw difficulties in factor analytic verification that are already known from other CSAS-studies, even from the original validation of CSAS-E. Up to now a study comparing the different factor-models is missing. Further studies are necessary to examine validity and test-retest-reliabil- ity. So far it is questionable whether the construction of
negative and positive attitudes towards communication skills aligns reality.
The students in our study seem to like communication.
For a deeper understanding of attitude development fu- ture research including a longitudinal design is necessary.
Acknowledgements
We thank our study participants. Thanks to Prof. Charlotte Rees for allowing and supporting us to translate the CSAS and Prof. Andreas Hinz for his revision suggestions.
Competing interests
The authors declare that they have no competing in- terests.
References
1. Street RL, Makoul G, Arora NK, Epstein RM. How does communication heal? Pathways linking clinician-patient communication to health outcomes. Patient Educ Couns.
2009;74(3):295–301. DOI: 10.1016/j.pec.2008.11.015 2. Kurtz SM, Silverman J, Draper J. Teaching and learning
communication skills in medicine. Abingdon: Radcliffe Medical Press; 1998.
3. Kiessling C, Dieterich A, Fabry G, Hölzer H, Langewitz W, Mühlinghaus I, Pruskil S, Scheffer S, Schubert S. Basel Consensus Statement "Communicative and Social Competencies in Medical Education": A Position Paper of the GMA Committee Communicative and Social Competencies. GMS Z Med Ausbild.
2008;25(2):Doc83. Zugänglich unter/available from: http://
www.egms.de/static/de/journals/zma/2008-25/
zma000567.shtml
4. Hahn EG, Fischer MR. National Competence-Based Learning Objectives for Undergraduate Medical Education (NKLM) in Germany: Cooperation of the Association for Medical Education (GMA) and the Association of Medical Faculties in Germany (MFT).
GMS Z Med Ausbild. 2009;26(3):Doc35. Zugänglich
unter/available from: http://www.egms.de/static/de/journals/
zma/2009-26/zma000627.shtml
5. Fragstein M von, Silverman J, Cushing A, Quilligan S, Salisbury H, Wiskin C. UK consensus statement on the content of communication curricula in undergraduate medical education.
Med Educ. 2008;42(11):1100–1107. DOI: 10.1111/j.1365- 2923.2008.03137.x
6. Dubois A, Patil V. The status quo of modern medical professionalism. Clin Teach. 2012;9(4):267–268. DOI:
10.1111/j.1743-498X.2012.00608.x
7. Ajzen I. Nature and operation of attitudes. Annu Rev Psychol.
2001;52:27–58. DOI: 10.1146/annurev.psych.52.1.27 8. Eagly AH, Chaiken S. The psychology of attitudes. Fort Worth,
Tex: Harcourt Brace Jovanovich College Publishers; 1993.
9. Fishbein M, Ajzen I. Belief, attitude, intention and behavior: An introduction to theory and research. Reading, Mass. [u.a.]:
Addison-Wesley; 1975.
10. Bombeke K, Symons L, Debaene L, Winter B de, Schol S, van Royen P. Help, I'm losing patient-centredness! Experiences of medical students and their teachers. Med Educ.
2010;44(7):662–673. DOI: 10.1111/j.1365- 2923.2010.03627.x
11. Levinson W, Roter D. Physicians' psychosocial beliefs correlate with their patient communication skills. J Gen Intern Med.
1995;10(7):375–379. DOI: 10.1007/BF02599834 12. Eron LD. Effect of Medical Education on Students´ Attitudes.
Med Educ. 1955;10:559–566.
13. Eron LD. The Effect of Medical Education on Attitudes: A Follow- up Study. Med Educ. 1958;33:25–33.
14. Neumann M, Edelhäuser F, Tauschel D, Fischer MR, Wirtz M, Woopen C, Haramati A, Scheffer C. Empathy decline and its reasons: a systematic review of studies with medical students and residents. Acad Med. 2011;86(8):996–1009. DOI:
10.1097/ACM.0b013e318221e615
15. Pedersen R. Empathy development in medical education--a critical review. Med Teach. 2010;32(7):593–600. DOI:
10.3109/01421590903544702
16. Tsimtsiou Z, Kerasidou O, Efstathiou N, Papaharitou S, Hatzimouratidis K, Hatzichristou D. Medical students' attitudes toward patient-centred care: a longitudinal survey. Med Educ.
2007;41(2):146–153. DOI: 10.1111/j.1365- 2929.2006.02668.x
17. Woloschuk W, Harasym PH, Temple W. Attitude change during medical school: a cohort study. Med Educ. 2004;38(5):522–534.
DOI: 10.1046/j.1365-2929.2004.01820.x
18. Haidet P, Dains JE, Paterniti DA, Hechtel L, Chang T, Tseng E, Rogers JC. Medical student attitudes toward the doctor-patient relationship. Med Educ. 2002;36(6):568–574. DOI:
10.1046/j.1365-2923.2002.01233.x
19. Hojat M, Vergare MJ, Maxwell K, Brainard G, Herrine SK, Isenberg GA, Veloski J, Gonnella JS. The devil is in the third year: a longitudinal study of erosion of empathy in medical school. Acad Med. 2009;84(9):1182–1191. DOI:
10.1097/ACM.0b013e3181b17e55
20. Rees C, Sheard C, Davies S. The development of a scale to measure medical students' attitudes towards communication skills learning: the Communication Skills Attitude Scale (CSAS).
Med Educ. 2002;36(2):141–147. DOI: 10.1046/j.1365- 2923.2002.01072.x
21. Tóth I, Bán I, Füzesi Z, Kesztyüs M, Nagy L. Elsö évfolyamos orvostanhallgatók attitüdjei az orvosi kommunikáció oktatásával kapcsolatban. Orv Hetil. 2011;152(38):1535–1543. DOI:
10.1556/OH.2011.29185
22. Rees C, Sheard C. Evaluating first-year medical students' attitudes to learning communication skills before and after a
communication skills course. Med Teach. 2003;25(3):302–307.
DOI: 10.1080/0142159031000100409
23. Harlak H, Gemalmaz A, Gurel FS, Dereboy C, Ertekin K.
Communication skills training: effects on attitudes toward communication skills and empathic tendency. Educ Health (Abingdon). 2008;21(2):62.
24. Bombeke K, Van Roosbroeck S, Winter B de, Debaene L, Schol S, Van Hal G, Van Royen P. Medical students trained in communication skills show a decline in patient-centred attitudes:
an observational study comparing two cohorts during clinical clerkships. Patient Educ Couns. 2011;84(3):310–318. DOI:
10.1016/j.pec.2011.03.007
25. Tiuraniemi J, Läärä R, Kyrö T, Lindeman S. Medical and psychology students' self-assessed communication skills: A pilot study. Patient Educ Couns. 2011;83(2):152–157. DOI:
10.1016/j.pec.2010.05.013
26. Koponen J, Pyörälä E, Isotalus P. Comparing three experiential learning methods and their effect on medical students' attitudes to learning communication skills. Med Teach. 2012;34(3):e198- 207. DOI: 10.3109/0142159X.2012.642828
27. Harlak H, Dereboy C, Gemalmaz A. Validation of a Turkish translation of the Communication Skills Attitude Scale with Turkish medical students. Educ Health (Abingdon).
2008;21(1):55.
28. Fazel I, Aghamolaei T. Attitudes toward learning communication skills among medical students of a university in Iran. Acta Med Iran. 2011;49(9):625–629.
29. Cleland J, Foster K, Moffat M. Undergraduate students' attitudes to communication skills learning differ depending on year of study and gender. Med Teach. 2005;27(3):246–251. DOI:
10.1080/01421590400029541
30. Khashab SS. Attitudes of Alexandria Medical Students towards Communication Skills Learning. J Egypt Public Health Assoc.
2006;81(5-6):355–372.
31. Anvik T, Grimstad H, Baerheim A, Bernt Fasmer O, Gude T, Hjortdahl P, Holen A, Risberg T, Vaglum P. Medical students' cognitive and affective attitudes towards learning and using communication skills--a nationwide cross-sectional study. Med Teach. 2008;30(3):272–279. DOI:
10.1080/01421590701784356
32. Quince TA, Parker RA, Wood DF, Benson JA. Stability of empathy among undergraduate medical students: a longitudinal study at one UK medical school. BMC Med Educ. 2011;11:90. DOI:
10.1186/1472-6920-11-90
33. Loureiro EM, Severo M, Bettencourt P, Ferreira MA. Attitudes and anxiety levels of medical students towards the acquisition of competencies in communication skills. Patient Educ Couns.
2011;85(3):e272-e277. DOI: 10.1016/j.pec.2011.07.005 34. Rogers CR, Farson RE. Active listening. Chicago: Industrial
Relations Center, The University of Chicago; 1957.
35. Rockenbauch K. Medizindidaktik: Götz Fabry. Z Med Psychol.
2010;19:102.
36. Rockenbauch K. Kompetent kommunizieren in Klinik und Praxis [Feedbackregeln]. Lengerich [u.a.]: Pabst Science Publ.; 2006.
37. Stöbel-Richter Y, Rockenbauch K. Feedbackregeln. In:
Rockenbauch K (Hrsg). Kompetent kommunizieren in Klinik und Praxis; Feedbackregeln. Lengerich [u.a.]: Pabst Science Publ.;
2006. p.241–62 .
38. Arbuckle R, Clark M, Harness J, Bonner N, Scott J, Draelos Z, Rizer R, Yeh Y, Copley-Merriman K. Item reduction and psychometric validation of the Oily Skin Self Assessment Scale (OSSAS) and the Oily Skin Impact Scale (OSIS). Value Health.
2009;12(5):828–837. DOI: 10.1111/j.1524- 4733.2009.00504.x
39. Schermelleh-Engel K, Moosbrugger H, Müller H. Evaluating the Fit of Structural Equation Models:Tests of Significance and Descriptive Goodness-of-Fit Measures. Meth Psychol Res Online.
2003;8(2):23–74.
40. Hu L, Bentler PM, Hu L. Fit indices in covariance structure modeling: Sensitivity to underparameterized model misspecification. Psychol Method. 1998;3(4):424–453. DOI:
10.1037/1082-989X.3.4.424
41. Bortz J, Döring N. Forschungsmethoden und Evaluation für Human- und Sozialwissenschaftler. Heidelberg: Springer; 2006.
S.606. DOI: 10.1007/978-3-540-33306-7
42. DESTATIS Statistisches Bundesamt. Bildung und Kulter:
Studierende an Hochschulen - Vorbericht- Wintersemester 2013/14. Wiesbaden: DESTATIS; 2014.
43. Rees CE, Garrud P. Identifying undergraduate medical students' attitudes towards communication skills learning: a pilot study.
Med Teach. 2001;23(4):400–406. DOI:
10.1080/01421590120057067
44. Rees C, Sheard C, McPherson A. Communication skills assessment: the perceptions of medical students at the University of Nottingham. Med Educ. 2002;36(9):868–878. DOI:
10.1046/j.1365-2923.2002.01300.x
45. Rees C, Sheard C. The relationship between medical students' attitudes towards communication skills learning and their demographic and education-related characteristics. Med Educ.
2002;36(11):1017–1027. DOI: 10.1046/j.1365- 2923.2002.01333.x
46. Foddy WH. Constructing questions for interviews and
questionnaires: Theory and practice in social research. Cambridge (UK), New York (USA): Cambridge University Press; 1993. DOI:
10.1017/CBO9780511518201
47. Bühner M. Einführung in die Test- und Fragebogenkonstruktion.
München [u.a.]: Pearson Studium; 2004.
48. Ahn S, Yi Y, Ahn D. Developing a Korean communication skills attitude scale: comparing attitudes between Korea and the West.
Med Educ. 2009;43(3):246–253. DOI: 10.1111/j.1365- 2923.2008.03271.x
49. Anvik T, Gude T, Grimstad H, Baerheim A, Fasmer OB, Hjortdahl P, Holen A, Risberg T, Vaglum P. Assessing medical students' attitudes towards learning communication skills--which components of attitudes do we measure? BMC Med Educ.
2007;7:4. DOI: 10.1186/1472-6920-7-4
50. Molinuevo B, Torrubia R. Validation of the Catalan version of the communication skills attitude scale (CSAS) in a cohort of south European medical and nursing students. Educ Health (Abingdon).
2011;24(1):499.
51. Nor NA, Yusof ZY, Shahidan MN. University of Malaya dental students' attitudes towards communication skills learning:
implications for dental education. J Dent Educ.
2011;75(12):1611–1619.
52. Laurence B, Bertera EM, Feimster T, Hollander R, Stroman C.
Adaptation of the Communication Skills Attitude Scale (CSAS) to dental students. J Dent Educ. 2012;76(12):1629–1638.
53. Ihmeideh FM, Al-Omari AA, Al-Dababneh KA. Attituders toward Communication Skills among Students'-Teachers' in Jordanian Public Universities. Aust J Teach Educ. 2010;35(4):1–11.
54. Power BT, Lennie SC. Pre-registration dietetic students' attitudes to learning communication skills. J Hum Nutr Diet.
2012;25(2):189–197. DOI: 10.1111/j.1365- 277X.2012.01226.x
55. Colliver JA, Conlee MJ, Verhulst SJ, Dorsey JK. Reports of the decline of empathy during medical education are greatly exaggerated: a reexamination of the research. Acad Med.
2010;85(4):588–593. DOI: 10.1097/ACM.0b013e3181d281dc 56. Batenburg V, Smal JA, Lodder A, de Melker RA. Are professional attitudes related to gender and medical specialty? Med Educ.
1999;33(7):489–492. DOI: 10.1046/j.1365- 2923.1999.00333.x
57. Dornbush RL, Singer P, Brownstein EJ, Freedman AM.
Maintenance of psychosocial attitudes in medical students. Soc Sci Med. 1985;20(1):107–109. DOI: 10.1016/0277-
9536(85)90318-1
58. Marambe KN, Edussuriya DH, Dayaratne KM. Attitudes of Sri Lankan medical students toward learning communication skills.
Educ Health (Abingdon). 2012;25(3):165–171.
59. Shankar RP, Dubey AK, Mishra P, Deshpande VY, Chandrasekhar TS, Shivananda PG. Student attitudes towards communication skills training in a medical college in Western Nepal. Educ Health (Abingdon). 2006;19(1):71–84.
60. Austin EJ, Evans P, Magnus B, O'Hanlon K. A preliminary study of empathy, emotional intelligence and examination performance in MBChB students. Med Educ. 2007;41(7):684–689. DOI:
10.1111/j.1365-2923.2007.02795.x
61. Beaton DE, Bombardier C, Guillemin F, Ferraz MB. Guidelines for the process of cross-cultural adaptation of self-report measures. Spine. 2000;25(24):3186–3191. DOI:
10.1097/00007632-200012150-00014
Corresponding author:
Katrin Rockenbauch
University Hospital Leipzig, Department of Psychic Health, Division for Medical Psychology and Medical Sociology, Ph.-Rosenthal-Straße 55, D-04103 Leipzig, Germany, Phone: +49 (0)341/97-18808, Fax: +49
(0)341/97-18809
katrin.rockenbauch@medizin.uni-leipzig.de
Please cite as
Busch AK, Rockenbauch K, Schmutzer G, Brähler E. Do medical students like communication? Validation of the German CSAS (Communication Skills Attitude Scale). GMS Z Med Ausbild.
2015;32(1):Doc11.
DOI: 10.3205/zma000953, URN: urn:nbn:de:0183-zma0009538
This article is freely available from
http://www.egms.de/en/journals/zma/2015-32/zma000953.shtml
Received:2014-03-19 Revised:2014-06-19 Accepted:2014-10-30 Published:2015-02-11
Copyright
©2015 Busch et al. This is an Open Access article distributed under the terms of the Creative Commons Attribution 4.0 License. See license information at http://creativecommons.org/licenses/by/4.0/.
Mögen Medizinstudierende Kommunikation? Validierung der deutschsprachigen CSAS (Communication Skills
Attitude Scale)
Zusammenfassung
Zielsetzung: Die Lehre ärztlicher Gesprächskompetenz schließt die Vermittlung förderlicher Einstellungen ein. Mittels der Communication
Anne-Kathrin Busch
1Katrin Rockenbauch
1Skills Attitude Scale (CSAS) werden Einstellungen Medizinstudierender
Gabriele Schmutzer
1zum Erwerb von kommunikativer Kompetenz erfasst. Ziel der vorliegen-
Elmar Brähler
1den Erhebung ist die Entwicklung einer deutschsprachigen CSAS-Fas- sung (CSAS-G), um die Einstellungen in einer deutschsprachigen Kohorte zu messen. Ergänzend untersuchten wir den Einfluss demographischer
Merkmale auf die Einstellungswerte. 1 Universitätsklinikum Leipzig,
Abteilung für Methodik:Wir erstellten die CSAS-G und befragten in unserer Untersu-
chung 529 Studienteilnehmer aus drei verschiedenen Studienjahren. Medizinpsychologie und Medizinsoziologie, Leipzig, Deutschland
Wir führten eine explorative wie konfirmatorische Faktorenanalyse durch und verglichen anschließend die Einstellungswerte nach Studienjahr.
Ebenso wurde eine multiple Regressionsanalyse berechnet.
Ergebnisse: Die konfirmatorische Faktorenanalyse bestätigte das zweifaktorielle System aus der explorativen Faktorenanalyse. Die Stu- dierenden gaben wenig Zustimmung zu negativen Einstellungen und mäßige Zustimmung zu positiven Einstellungen an. Die Einstellungswerte differieren signifikant nach Geschlechtszugehörigkeit.
Schlussfolgerung:Die CSAS-G eignet sich zur Einschätzung von Einstel- lungsausprägungen zu Kommunikationskompetenz in deutschsprachi- gen Kohorten. Die Medizinstudierenden unserer Studie zeigten grund- legend eine positive Einstellung. Weiterführende Untersuchungen sind erforderlich, um die Einstellungen deutschsprachiger Medizinstudieren- der zu kommunikativer Kompetenz zu erfassen und zu verstehen.
Schlüsselwörter:Kommunikation, Medizinstudierende, Einstellungen
Einleitung
Die Arzt-Patienten-Beziehung entspricht einem zwischen- menschlichen Prozess höchster Komplexität. Die Schlüsselkompetenz zur Gestaltung eines heilsamen Arzt- Patienten-Verhältnisses ist professionelle Kommunikation [1]. Diese befähigt den Arzt, verschiedenste kommunika- tive Herausforderungen zu bewältigen, um den vielfältigen Patientenbedürfnissen gerecht werden zu können. For- schungsergebnisse weisen darauf hin, dass professionelle Kommunikation als „Serie erlernter Fähigkeiten“ (‚series of learned skills‘) angeeignet werden kann [2]. In der medizinischen Ausbildung wird die Vermittlung kommuni- kativer Kompetenz in zunehmend detaillierten Ausbil- dungszielen festgelegt [3], [4]. Die Lehre sowie der Erwerb von Gesprächskompetenz schließen die Entwicklung förderlicher Einstellungen ein [5], wie die anhaltende Diskussion zum Thema Professionalität veranschaulicht [6]. Für den Lernenden ermöglicht die Auseinanderset- zung mit den eigenen Einstellungen eine Vertiefung des
Verständnisses unterschiedlicher Bereiche professioneller Kommunikation. Der Erwerb kommunikativer Fähigkeiten ermöglicht den Transfer der Einstellungen in die Kommu- nikationspraxis [2]. Ajzen, einer der führenden Einstel- lungsforscher, konstatiert, dass „Einstellung eine zusam- menfassende Bewertung eines psychologischen Objektes darstellt, das in Merkmalsdimensionen wie gut-schlecht, schädlich-nützlich, angenehm-unangenehm, sympathisch- unsympathisch erfasst wurde“ (`attitude represents a summary evaluation of a psychological object captured in such attribute dimensions as good-bad, harmful-bene- ficial, pleasant-unpleasant, and likable-dislikable.´) [7].
Folglich erleichtern Einstellungen die individuelle Anpas- sung an die Umgebung [8]. Weiterhin beeinflussen Ein- stellungen gemäß der Theorie des überlegten Handelns (Theory of Reasoned Action) das Verhalten [9]. Den deutlichen Einfluss auf das Verhalten affektiver Einstel- lungskomponenten wie Emotionen, veranschaulicht eine aktuelle qualitative Studie an Hand des „Attitude-Social Influence-Self-Efficacy-Model“ [10]. Psychosoziale Einstel- lungen von Hausärzten stehen in Verbindung zu ihrem Kommunikationsverhalten, wie Levinson und Roter zeigen
Tabelle 1: Überblick CSAS-Studien
konnten [11]. Eine starke psychosoziale Orientierung von Ärzten und Medizinstudierenden ist daher wünschens- wert. Bereits Mitte des zwanzigsten Jahrhunderts erkann- te Eron [12], [13] eine sinkende psychosoziale Orientie- rung bei Medizinstudierenden. Daraufhin formte er den Begriff der Dehumanisierung. Dieser hat – wie heutige Studien zeigen - nichts an Aktualität eingebüßt: im Verlauf der ärztlichen Ausbildung entwickeln sich Empathie [14], [15] und Patientenorientierung [16], [17], [18] rückläufig.
Als ursächlich wird der anscheinend ungünstige Einfluss
zunehmender Patientenkontakte angenommen. Da die meisten medizinischen Curricula nach dem zweiten Aus- bildungsjahr mehr Patienteninteraktion beinhalten, bildet das dritte Jahr ein sensibles Zeitfenster für die weitere Entwicklung der psychosozialen Orientierung [19]. Als zweiter Hauptverursacher des Empathie-Verlusts gilt Stress [14]. Die Fachliteratur bietet zur Erfassung der Einstellungen Medizinstudierender zu kommunikativer Kompetenz den Fragebogen „Communication Skills Atti- tude Scale“ (CSAS) [20]. Dem anhaltenden Interesse an
Einstellungen zu Gesprächskompetenz entsprechend, wurde die CSAS in zahlreichen Studien eingesetzt. Dabei kamen die englischsprachige Originalversion oder deren Übersetzung zur Anwendung (siehe Tabelle 1). Aus Ungarn stammt eine deutschsprachige CSAS-Version [21]. Die zugehörige Publikation ist in ungarischer Sprache verfasst und daher unzugänglich für weite Teile des Fachpubli- kums.
In einigen der in Tabelle 1 genannten Studien wurden Einstellungswerte vor und nach einem Kommunikations- training untersucht [22], [23], [24], [25], [26]. Die CSAS- basierte Forschung zeigt gegenläufige Einstellungsent- wicklungen während der medizinischen Ausbildung.
Überwiegend fand sich ein Rückgang positiver Einstellun- gen [27], [28], [29], den bisher nur eine Untersuchung widerlegt [30]. Die Arbeitsgruppe um Anvik [31] entdeckte stabile kognitive Einstellungen im Verlauf des Studiums.
Im Kontrast dazu sanken die affektiven Einstellungen.
Diese Feststellung entspricht den Ergebnissen der Empa- thie-Forschung [32]. Bei Studierenden mit höherem Ängstlichkeitsniveau wurden weniger positive Einstellun- gen zu Gesprächskompetenz belegt [33].
Bislang fehlen Daten, die die Einstellungen deutscher Medizinstudierender zu kommunikativer Kompetenz be- leuchten. Um diese Lücke in der Ausbildungsforschung zu schließen, wurde diese Studie mit folgenden Zielen durchgeführt:
1. Entwicklung einer deutschsprachigen CSAS-Version (CSAS-G),
2. Validierung der CSAS-G mit einer Kohorte deutscher Studierender,
3. Vergleich der Einstellungswerte nach Studienjahr und 4. Ermittlung möglicher Einflüsse demografischer Fakto-
ren auf die Einstellungswerte.
Methodik
Setting
Die Kohorte dieser Querschnittsstudie umfasst Studieren- de aus den Jahren eins (n=88), zwei (n=355) und vier (n=86). Das Curriculum der Universität Leipzig enthält im ersten Studienjahr Vorlesungen im Fach „Medizinische Psychologie und Medizinische Soziologie“. Ein Kommuni- kationstraining findet nicht statt. Die Erfahrungen mit Patientenkontakt sind somit für die Befragten aus dem ersten Studienjahr begrenzt auf deren individuellen Tätig- keiten vor Aufnahme des Studiums. Studierende des zweiten Studienjahres nehmen an zwei Gesprächsfüh- rungskursen teil. Der erste Kurs thematisiert über 18 Stunden Grundlagenwissen zu Kommunikation kombiniert mit Beispielen aus der Arzt-Patienten-Kommunikation.
Als weitere Elemente werden Aspekte der kooperativen Kommunikation, des aktiven Zuhörens [34] und der Re- gulation von Emotionen integriert. Im zweiten Kurs á 21 Stunden werden spezifische Konversationstechniken der Arzt-Patienten-Beziehung vermittelt. Dazu zählen partizi-
pative Entscheidungsfindung (PEF; englisch: shared deci- sion-making, SDM), Umgang mit Tabus, Überbringen schlechter Nachrichten und Beratung zur Lebensstilmodi- fikation [35], [36], [37]. Im klinischen Studienabschnitt wird an der Leipziger Medizinfakultät kein reguläres Kommunikationstraining angeboten. Studierende aus dem vierten Studienjahr erleben im Unterricht am Kran- kenbett und in Pflichtfamulaturen vergleichsweise viel Patientenkontakt.
Datenerfassung
1. Durchführung
Die Original-CSAS wurde mittels des standardisierten Vorwärts-Rückwärts-Verfahrens ins Deutsche übersetzt.
Die Erstautorin kontaktierte mehrfach Verfasserin Rees per Email, um die genaue Bedeutung der Items zu klären, und nahm dann die Übersetzung ins Deutsche vor. Für die Rückübersetzung wurde ein englischer Muttersprach- ler engagiert. Die beiden Übersetzungsschritte wurden wiederholt und durch einen Vorversuch ergänzt, bis eine zufriedenstellende deutschsprachige CSAS-Fassung nahe am englischen Original entwickelt war (siehe Tabelle 2).
Die gewonnene CSAS-G bedurfte vereinzelter Item-Modi- fikationen, da Medizinstudierende aus drei Studienjahren und mit unterschiedlichem Bezug zum Gesprächsführungs- kurs involviert wurden. Studierende aus dem ersten Stu- dienjahr hatten zum Befragungszeitpunkt noch kein Kommunikationstraining absolviert. Daher wurde Item 12 „Es macht mir Spaß, Gesprächsführung zu lernen“
durch „Es wird mir Spaß machen, Gesprächsführung zu lernen.“ ersetzt. Eine Anpassung von Formulierungen für Studierende aus dem zweiten Studienjahr war nicht nötig, da diese den Fragebogen kurz nach ihrer Teilnahme am Gesprächsführungskurs ausfüllten.
Im Rahmen von Lehrveranstaltungen wurden Studierende zur freiwilligen Studienteilnahme eingeladen. Sie wurden über die anonymisierte Datenauswertung informiert. Die Fragebögen wurden von einem der Autoren an die Studie- renden ausgeteilt, wobei eine kurze Anleitung gegeben wurde ohne das Studienziel zu nennen. Sensible perso- nenbezogene Informationen wurden nicht erfasst. Auf jegliche Form von Experiment wurde verzichtet. Eine Zu- stimmung der Ethikkommission der Universität Leipzig war daher nicht notwendig.
2. Messinstrument
Die Teilnehmer füllten die CSAS-G zusammen mit einem demografischen Kurz-Fragebogen aus. Dieser erfasste Studienjahr, Alter und Geschlecht. Die CSAS-G besteht aus 26 Items mit Aussagen zu Vermittlung, Erlernen und Anwendung von Kommunikationskompetenz. Die Beant- wortung erfolgt entlang einer fünfteiligen Likert Skala von eins (stimme überhaupt nicht zu) bis fünf (stimme voll- ständig zu). Folglich stehen höhere Werte für stärkere Einstellungsausprägungen. Gemäß der ursprünglichen Konstruktion misst die CSAS getrennt positive (Positive
Tabelle 2: CSAS-G
attitude scale (PAS)) und negative Einstellungsanteile (Negative attitude scale (NAS)).
3. Statistische Auswertung
Die statistische Auswertung wurde mit SPSS und AMOS vorgenommen. Im ersten Schritt wurde eine explorative Faktorenanalyse mit schiefwinkliger Rotation berechnet.
Zur Reliabilitätsanalyse wurde Cronbach’s α für jeden Faktor ermittelt. Um eine angemessene interne Konsis- tenz zu gewährleisten, war eine Item-Reduktion beider Subskalen erforderlich. Die Faktorenstruktur wurde mit- tels konfirmatorische Faktorenanalyse für die reduzierten Subskalen als auch für die originalen Subskalen geprüft.
Die Ergebnisse der beiden konfirmatorischen Faktoren- analysen wurden basierend auf folgenden Modellgüte- Indizes verglichen: minimale Diskrepanz geteilt durch Freiheitsgrade (CMIN/DF); Anpassungsgüte (goodness- of-fit-index (GFI)); normierter Anpassungs-Index (normed- fit-index (NFI)); komparativer Anpassungs-Index (compa- rative-fit-index (CFI)); Tucker-Lewis-Index (TLI); absoluter Fit-Index (the root mean square error of approximation (RMSEA)) und Akaike Informationskriterium (Akaike Infor- mation Criterion (AIC)). Das Verhältnis CMIN/DF sollte für eine zufriedenstellende Modellgüte möglichst klein sein [38], [39]. GFI sollte zwischen 0,97 und 1 liegen und NFI ist idealerweise größer als 0,95 [39]. Eine geeignete Modellgüte wird durch CFI- und TLI-Werte nahe 0,95 oder sogar höher angezeigt [39], [40]. RMSEA sollte 0,05 oder kleiner sein. AIC zählt zu den Badness of Fit-Indizes und gilt als deskriptiver Indikator. AIC ermöglicht Vergleiche zwischen zwei unterschiedlichen Modellen, wobei der niedrigere AIC-Wert dem zu bevorzugendem Modell ange- hört [38], [39]. Um die Modelle zu testen, haben wir Ko- varianzmatrizen und die Maximum-Likelihood-Methode eingesetzt.
Die Einstellungswerte wurden berechnet, indem die Summe der Likert-Werte jeder Subskala durch die Item- Anzahl pro Subskala geteilt wurde. Korrelationen zwischen den Einstellungswerten und demografischen Daten wur- den mit dem Pearson-Korrelationskoeffizienten unter- sucht. Zur Prüfung auf Normalverteilung verwendeten wir den Kolmogorow-Smirnow-Test. Bei fehlender Normalver- teilung wurde der nicht-parametrische Kruskal-Wallis-H- Test für den Vergleich der CSAS-Ergebnisse verschiedener Studienjahre genutzt. Dieser ergab signifikante Rangun- terschiede. Wir betrachteten somit die Nutzung eines parametrischen Verfahrens trotz fehlender Normalvertei- lung als gerechtfertigt. Zum Vergleich der Einstellungswer- te nach Geschlecht haben wir T-Tests durchgeführt. Die Vergleiche nach Studienjahr wurden über einfaktorielle Varianzanalyse mit post-hoc Scheffé-Test vorgenommen.
Um Gruppenunterschiede zu ermitteln, wurden die folgen- den Signifikanzniveaus angewandt: *p<0,05, **p<0,01 und ***p<0,001. Da die Subkohorten in ihrer Größe variierten, wurden die Effektgrößen (d) für signifikante Mittelwerts-Differenzen berechnet. Effektgrößen von d>0,50 werden als groß interpretiert, 0,50>d>0,30 als moderat, 0,30>d>0,10 als klein und d<0,10 als belanglos [41].
Ergebnisse
Demografische Kohortenbeschreibung
529 Fragebögen wurden vollständig ausgefüllt. Die Alters- range der Befragten reichte von 19 bis 47 Jahren (Durchschnittsalter = 26 Jahre). Weibliche Teilnehmer bildeten die Mehrheit (64%) gegenüber den männlichen Teilnehmern (36%) (siehe Tabelle 3). Die Geschlechter- verteilung dieser Kohorte entspricht dem dominierenden Anteil weiblicher Studierender der Humanmedizin in Deutschland [42].
Validierung der CSAS-G
Die Messung des Kaiser-Meyer-Olkin-Kriteriums ergab einen Wert von 0,899. Die Signifikanz nach Bartlett liefer- te einen positiven p-Wert von <0,001. Beide Ergebnisse belegen die Stichprobeneignung zur Durchführung einer explorativen Faktorenanalyse (EFA). Die initial durchge- führte Faktorenanalyse ergab sieben Faktoren mit Eigen- werten größer 1, die 58% der Varianz erklärten. Da eine inhaltliche Grundlage zur Annahme der siebenfaktoriellen Lösung fehlte, wurden in einer zweiten EFA zwei Faktoren vorgegeben. Diese Vorgehensweise gründet auf der Ori- ginal-Faktorenlösung nach Rees [20]. Erneut konnten die beiden Original-Item-Bündel nicht reproduziert werden.
Dennoch entschieden wir uns auf Grund des von Rees und Kolleginnen vorgelegten, qualitativen Fundaments [43], [44], [45] zur Beibehaltung des zweifaktoriellen Systems. Die Faktorenzuordnung wurde ab einer Ladung von mindestens 0,28 auf einen Faktor zugelassen (siehe Tabelle 4). Die Items 01, 03, 08, 13, 18, 20 und 22 wurden wegen unzureichender oder uneindeutiger Fakto- renladung eliminiert. Daraus folgt, dass die NAS-Subskala in unserer Stichprobe sieben Items beinhaltet (Cron- bach´s α= 0,838) und die PAS-Subskala zwölf Items (Cronbach´s α= 0,864). Der Pearson-Korrelationskoeffi- zient für die PAS- und NAS-Werte fällt unter Berücksichti- gung der Gesamtkohorte negativ aus (r= -0,49 (p<0.001)). Somit wird ein nicht- linearer Zusammenhang zwischen den beiden Subskalen angenommen: ein niedriger PAS-Wert ist verbunden mit einem hohen NAS- Wert im Sinne einer negativ gefärbten Einstellung und umgekehrt. Diese Konstellation entspricht der inhaltlichen Ausrichtung des CSAS-Originals.
Anschließend haben wir die konfirmatorischen Faktoren- analysen berechnet. Im ersten Schritt untersuchten wir die originalen Subskalen, im zweiten das Modell der CSAS-G nach Item-Elimination. Die Werte für die Original- struktur waren im Vergleich weniger zufriedenstellend, woraufhin das CSAS-G System weiter untersucht wurde.
Um eine annehmbare Modellgüte der CSAS-G zu errei- chen, duldeten wir schrittweise Korrelationen zwischen einzelnen Item-bezogenen Fehlerindizes unter Berück- sichtigung möglichst hoher Modifikationsindizes. Unter diesen Bedingungen wurde die zweifaktorielle Lösung der CSAS-G bestätigt und konnte für weitere Berechnun- gen verwendet werden.
Tabelle 3: Demographie der Gesamtkohorte
Tabelle 4: Rotierte Komponentenmatrix
Einstellungswerte
Die Einstellungsausprägungen entlang beider Subskalen sind in Tabelle 5 nach Studienjahr getrennt dargestellt.
Negative Einstellungen zu kommunikativer Kompetenz steigen vom ersten über das zweite zum vierten Studien- jahr leicht an. Als signifikant erwies sich die NAS-Mittel-
werts-Differenz zwischen den Studienjahren zwei und vier. Die Mittelwerte der PAS-Subskala sinken signifikant vom ersten zum zweiten Studienjahr ab, gefolgt von an- steigenden Werten vom zweiten zum vierten Studienjahr.
In der Gesamtkohorte zeigen weibliche Studierende signi- fikant niedrigere NAS-Werte (Mittelwert NAS=2,05) als männliche Studierende (Mittelwert NAS=2,32) (p=0.000;
Tabelle 5: Einfaktorielle Varianzanalyse zum Vergleich PAS- und NAS-Scores im ersten, zweiten und vierten Studienjahr
d=0,48). Gleichzeitig stimmen weibliche Studierende positiven Aussagen stärker zu (Mittelwert PAS=3,12) als ihre Kommilitonen (Mittelwert PAS=2,80) (p=0,000;
d=0,38). Zusätzlich konnte ein signifikanter Zusammen- hang zwischen Geschlecht und Einstellungsausprägung an Hand des Korrelationskoeffizientens belegt werden (PAS-Wert/Geschlecht: r=0,21; p<0,001; NAS-Wert/Ge- schlecht: r=-0,21; p<0,001). Für das Merkmal Alter geling dies nicht (PAS-Wert/Alter: r=-0,49; p=0,43; NAS Wert/Alter: r=0,09; p<0,05).
Regressionsanalyse
Eine multiple Regression (siehe Tabelle 6) wurde schritt- weise durchgeführt. Im ersten Schritt zeigte sich das Merkmal Alter von geringer Signifikanz in Bezug auf den NAS-Wert. Bei Berücksichtigung des Geschlechts verlor Alter an Bedeutung, wohingegen der Einfluss des Ge- schlechts auf die NAS- und PAS-Werte hoch signifikant erschien. Wir wiederholten das Verfahren mit dem Merkmal Studienjahr statt Alter. Dabei fanden wir keine relevant abweichenden Ergebnisse. Folglich bestätigt die Regressionsanalyse quantitativ den Einfluss des Ge- schlechts auf die CSAS-Subskalenwerte. Allerdings ist der Beitrag der Regressionsanalyse angesichts des gerin- gen Determinationskoeffizientens AdjR²=0,044/0,041 limitiert.
Tabelle 6: Multiple Regressionsanalyse
Diskussion und Schlussfolgerung
Diskussion
(1) Das erste Ziel dieser Forschungsarbeit war die Über- setzung der englischsprachigen CSAS ins Deutsche. Dazu nutzten wir das etablierte Vorwärts-Rückwärts-Verfahren.
Grundsätzlich wirkt sich jeglicher Übersetzungsvorgang auf die Studienergebnisse aus. Es ist bekannt, dass selbst geringfügige Änderungen des Item-Wortlauts das Befrag- tenverständnis und die Messung beeinflussen [46]. In unserer Studie wurde der potenzielle Einfluss der Über- setzung verstärkt durch die Item-Modifikationen für das erste Studienjahr (siehe 2.2.1 Durchführung), welche eine methodische Schwäche bedeuten. Dennoch verstehen wir die Anpassung einzelner Item-Formulierungen als unverzichtbar für das Verständnis der Teilnehmer aus dem ersten Studienjahr. Unabhängig davon enthält die
originale CSAS Item-Formulierungen, die allgemeinen Empfehlungen zur Fragebogenkonstruktion nicht gerecht werden. So sollten Items für ein bestmögliches Verständ- nis nicht suggestiv oder verneinend formuliert sein [47].
Entsprechend verwirrend für den Befragten können manche Formulierungen der CSAS wirken wie Item 17:
“Der Gesprächsführungskurs wäre angesehener, wenn er naturwissenschaftlicher wäre.“ (´Communication skills teaching would have a better image if it sounded more like a science subject.´) oder Item 19: “Ich brauche keine gute Gesprächsführung, um ein guter Arzt zu sein.“ (´I don´t need good communication skills to be a doctor.´).
(2) Das zweite Ziel dieser Studie war die Validierung der CSAS-G. Nach Item-Elimination boten die beiden Subska- len eine moderate Reliabilität. Die konfirmatorische Faktorenanalyse bestätigt erst nach stufenweiser Anpas- sung die hinreichende Modellgüte der zweifaktoriellen Lösung. Dieser Umstand schränkt die Validität der CSAS- G ein. Eine umfassende Validierung mittels Außenkriteri- um war zu diesem Zeitpunkt nicht möglich, da ähnlich gelagerte Fragebögen in deutscher Sprache fehlen.
In der Originalarbeit zur Entwicklung der CSAS entdeckten Rees und Kolleginnen zuerst eine sechsteilige Faktoren- struktur, verfolgten jedoch das System mit zwei Subskalen [20]. Mehrere Validierungen konnten diese Faktorenlö- sung bestätigen, wenngleich in einigen Fällen den zwei Subskalen unterschiedliche Items zugeordnet wurden.
Drei andere Studien neben unserer Arbeit weisen auf notwendige Item-Eliminationen hin [48], [49], [50]. Dabei variierten die entfernten Items. Neben der zweifaktoriellen Lösung wurden weitere Subskalensysteme entwickelt (siehe Tabelle 1). Die Faktorenstruktur unserer Stichprobe weicht ab von allen bereits in der CSAS-Forschungslitera- tur beschriebenen Subskalen. In Anbetracht der struktu- rellen Schwierigkeiten und teils ungünstiger Item-Formu- lierungen schließen manche Autoren auf die Notwendig- keit einer generellen CSAS-Modifikation [48], [50].
Die Vielfalt der CSAS-Validierungsergebnisse kann zum Teil als Folge der Übersetzungen gesehen werden. In Anbetracht der unterschiedlichen Kulturen und Sprachen können verschiedene Faktorenlösungen eines Forschungs- instruments als annehmbar bewertet werden. Ein ähnli- ches Bild findet sich bei anderen Fragebögen, die über- setzt wurden.
Die unkritische Auswahl der Befragten kann eine weitere mögliche Ursache für variierende CSAS-Subskalen sein.
Während die CSAS ursprünglich für Medizinstudierende konzipiert wurde, offeriert die Literatur auch Befragungen von Studierenden der Psychologie [25], Zahnmedizin [51], [52] und Ernährungswissenschaften [53], sowie Lehrern [54] und Krankenpflegepersonal in Ausbildung [50].
(3) Das dritte Ziel dieser Studie war die Untersuchung der Einstellungsausprägungen Leipziger Medizinstudie- render. Unsere Ergebnisse zeigen niedrige Werte bei den negativen Einstellungen und moderate Werte bei den positiven Einstellungen. Wir schlussfolgern daher, dass Studierende unserer Kohorte das Erlernen von Gesprächs- kompetenz mögen. Die freiwillige Teilnahme an unserer
Studie kann bedeuten, dass die Befragten grundsätzlich mehr Interesse an Kommunikation haben. Der Vergleich der Mittelwerte nach Studienjahr ergibt in unserer Stich- probe folgenden Verlauf: die NAS-Werte steigen signifikant an und die PAS-Werte sinken. Ein allein von signifikanten Mittelwerts-Differenzen abgeleiteter Trend entspräche einer im Ausbildungsverlauf negativen Einstellungsent- wicklung. Bei der Betrachtung der absoluten Mittelwerte ist es jedoch fraglich, ob dieses geringfügige Verände- rungsmaß die Einstellungen wirklich beeinflusst. Abgebil- det auf der Likert-Skala liegen alle PAS-Mittelwerte bei Stufe drei und alle NAS-Mittelwerte bei Stufe zwei. Dem- zufolge liefern unsere Studienergebnisse keine Anhalts- punkte für einen ungünstigen Einstellungsverlauf von praktischer Relevanz [55]. In der Forschungsliteratur finden sich nur einzelne andere Arbeiten, die ähnliche Ergebnisse vorlegen [56], [57]. Die Schlussfolgerungen zur Einstellungsentwicklung in der Leipziger Kohorte ha- ben aufgrund des Querschnittsdesigns nur eingeschränk- te Aussagekraft. Zur zuverlässigen Erfassung des Einstel- lungsverlaufs während des Medizinstudiums, ist eine Längsschnittstudie unabdingbar. Eine weitere methodi- sche Schwäche ist durch die ungleichen Subkohorten- Größen gegeben. Die Mehrheit der Studierenden stammt aus dem zweiten Studienjahr. Um eine Verzerrung vor diesem Hintergrund zu vermeiden, haben wir zusätzlich die Effektstärken berechnet. Diese haben die signifikan- ten Mittelwerts-Differenzen bestätigt.
Wie eine andere CSAS-Studie beweist, geben weibliche Befragte wünschenswertere Einstellungen an [45]. Diese Tendenz spiegelt sich in unseren Ergebnissen wider.
Demgegenüber ergaben zwei CSAS-Studien aus dem asiatischen Raum keinen signifikanten Einfluss der Ge- schlechtszugehörigkeit auf die Einstellungsausprägung [58], [59]. Ein gänzlich anderes Bild zeigt eine Studie aus Großbritannien, die wachsende Empathie bei männlichen Befragten bei gleichzeitig sinkender Empathie der Teil- nehmerinnen belegte [60].
Schlussfolgerung und Praxisbezug
In der ärztlichen Ausbildung besteht anhaltendes Interes- se an Einstellungsforschung. Die CSAS ist ein hilfreiches Instrument zur Erfassung der Einstellungen Studierender zu Gesprächskompetenz. Die Übersetzung lieferte die CSAS-G, die sich in unserer Pilotstudie als reliabel erwies.
Prinzipiell kann die CSAS-G für zukünftige Forschung an deutschsprachigen Medizinfakultäten eingesetzt werden.
Wir empfehlen abzuwägen, ob die Umformulierung einzel- ner Items notwendig ist. In unserer Erhebung verzichteten wir auf eine begleitende qualitative Einstellungserfassung.
Für die Entwicklung einer deutschsprachigen CSAS- Ver- sion, die spezifische Einstellungen deutschsprachiger Medizinstudierender berücksichtigt, wäre weitere For- schung zuträglich [61]. Wie aus vorhergehenden CSAS- Studien inklusive der Original-Validierung bekannt ist, stellten auch wir Schwierigkeiten bei der Faktorenbildung fest. Bisher fehlen vergleichende Untersuchungen der verschiedenen Faktorenmodelle. Es besteht zusätzlicher