Essays in Infrastructure Investment
DISSERTATION by
Diplom-Kaufmann, Master of Science Konrad Finkenzeller
Submitted to the Faculty of Business Administration at the University of Regensburg
in partial fulfillment of the requirements for the degree of
Doctor rerum politicarum Dr. rer. pol.
Regensburg, January 2012
Table of Contents
1. Introduction ... 4
1.1 General Motivation ... 4
1.2 Research Question ... 6
1.3 Course of Analysis ... 9
2. The Interactions Between Direct and Securitized Infrastructure and its Relationship to Real Estate ... 11
2.1 Introduction ... 12
2.2 Data ... 15
2.2.1 Correlations ... 18
2.3 Methodology ... 19
2.4 Results ... 21
2.4.1 Long-Run Dynamics... 21
2.4.2 Short-Run Dynamics ... 25
2.5 Summary and Conclusions ... 26
2.6 Appendix ... 27
2.5 Literature ... 28
3. Infrastructure - A New Dimension of Real Estate? An Asset Allocation Analysis ... 31
3.1 Introduction ... 32
3.2 Applied Data ... 33
3.3 Why Infrastructure is not Real Estate ... 34
3.4 Infrastructure Asset Allocation ... 37
3.4.1 Modern Portfolio Theory (MPT) ... 37
3.4.2 Mean Semivariance Optimization ... 38
3.4.3 Research Design ... 40
3.4.4 Asset Allocations ... 40
3.5 Concluding Remarks ... 43
3.7 References ... 45
4. Real Estate: A Victim of Infrastructure? Evidence from Conditional Asset Allocation ... 47
4.1 Introduction ... 48
4.2 Literature Review ... 51
4.3 The Concept of Downside Risk ... 53
4.4 Data ... 55
4.5 Descriptive Statistics and Downside Risk ... 60
4.5 Downside Correlations ... 62
4.6 Asset Allocations ... 65
4.6.1 Unconditional Portfolios ... 65
4.6.2 Bull Market Portfolios ... 66
4.6.3 Bear Market Portfolios ... 67
4.6.4 Constrained Asset Allocations ... 70
4.7 The Effects of Infrastructure on Asset Weights ... 73
4.7.1 Unconditional Portfolios ... 73
4.7.2 Bull Market Portfolios ... 74
4.7.3 Bear Market Portfolios ... 75
4.8 Conclusion ... 78
4.9 References ... 81
5. How much into Infrastructure? Evidence from Dynamic Asset Allocation ... 85
5.1 Introduction ... 86
5.2 Literature Review ... 87
5.3 Data ... 89
5.4 Methodology ... 91
5.5 Descriptive Statistics ... 95
5.6 Results ... 97
5.6.1 Mean-Variance Optimization ... 97
5.6.2 Mean-Downside Risk Optimization ... 99
5.6.3 The Effects of Infrastructure on Portfolio Performance ... 101
5.6.4 The Role of the Investment Horizon... 103
5.6.5 Nominal vs. Real Returns ... 106
3.6.6 Infrastructure and Real Estate ... 107
5.7 Conclusion ... 110
5.8 References ... 112
6. Direct Infrastructure Investment and its Role in Drawdown-Efficient Portfolios ... 114
6.1 Introduction ... 115
6.2 Data and Descriptive Statistics ... 117
6.3 Methodology ... 120
6.4 Results ... 125
6.4.1 The Role of Infrastructure in Drawdown Efficient Portfolios ... 125
6.4.2 Infrastructure, Pension Liabilities and Target Rate Relative Drawdown Risk ... 130
6.4.3 Downside Beta Hedged Portfolios ... 137
6.5 Conclusion ... 142
6.6 Appendix ... 144
6.7 References ... 150
7. Conclusion ... 153
7.1 Executive Summary ... 153
7.2 Final Remarks and Further Research ... 158
1. Introduction
1.1 General Motivation
The importance of asset allocation is widely discussed in the academic literature and free of any controversy. It constitutes the essential foundation of investment decisions and is the main determinant of portfolio performance. However, there is no consensus on how much wealth should be allocated on a given asset class, as this depends on numerous variables such as return expectations, risk aversion, macroeconomic circumstances, illiquidity and the specif- ic investment horizon. The original basis for asset allocation has been eroded during the last decade, as the traditionally main assets such as bonds, stocks and real estate have been affect- ed by significant losses and are subject to considerable uncertainty. This makes it even more difficult for fund managers to decide how much wealth should be allocated to the various po- tential assets. Stock markets have suffered substantially through macroeconomic distortions reflected in high volatility and poor average performance. Bonds, which constitute a major share of institutional investment portfolios, are currently heavily influenced by growing gov- ernmental debt obligations. The former “save haven” of real estate was the main activator of the recent financial crisis and property markets lost substantially in value.
These impacts on investment portfolios have substantially altered investor perceptions and attitudes towards their original asset allocation strategy. In order to avoid further substantial losses as experienced during recent years, investors are now seeking sources of diversification to supplement core assets like stocks, bonds and real estate. In this context, private invest- ments in infrastructure have been identified by many institutional investors as a viable alter- native. The infrastructure asset universe can be divided into two main categories: economic and social infrastructure. Economic infrastructure includes long-lasting, large-scale physical structures like transportation and communication infrastructure, as well as energy and utility facilities. Social infrastructure, on the other hand, includes education, healthcare, waste dis- posal and judicial facilities. Despite this diversity and heterogeneity, infrastructure assets are considered to have attractive investment characteristics. The nature of infrastructure as a con- servative, tangible and real asset seems to constitute a viable alternative to synthetic and com- plex financial products. Furthermore, due to their monopolistic nature, infrastructure invest- ments are expected to provide stable and predictable long-term cash flows, which may enable investors to match their long-term liabilities. This monopolistic character and the provision of basic services, might induce cash flows which are less vulnerable to economic downturns than
those from other, more cyclical assets. In consequence, infrastructure might be able to stabi- lize portfolio returns and reduce volatility. The private involvement in the infrastructure sec- tor is driven by financial strains on governments, which render the public sector unable to guarantee adequate infrastructure provision. However, this imbalance between infrastructure provision and demand is expected to gain further momentum and increase privatization pres- sure over the long run. Nevertheless, despite the promising future infrastructure’s track record and its investment history are still young, raising the question of whether infrastructure will really be able to meet optimistic investor expectations.
The infrastructure sector still lacks of professional structures and standardization at different levels and additionally faces a classification problem within the portfolio. Accordingly, infra- structure assets are often managed together with (seemingly) related assets like real estate.
Short histories and a lack of good quality direct performance data still impede independent (academic) research and render infrastructure investment in-transparent, which in turn hinders investment. The objective of this dissertation is to deal with some of these shortcomings and to coherently analyze the role of direct infrastructure in a diversified portfolio, by using a novel set of direct infrastructure performance data. In order to provide robust and meaningful results, the dissertation deals with a number of different aspects which are important to the asset allocation management process. In particular, the investigation accounts for different markets, empirical models, expected returns, target rates, market phases, nominal and real returns, hedging abilities in the context of liabilities and systematic market risk. Furthermore, there is a specific and detailed focus on the relationship between real estate and infrastructure and on the relationship between direct and indirect infrastructure returns.
1.2 Research Question
The section provides a basic framework for this dissertation and the five articles, dealing with the related research questions for each.
The Interactions Between Direct and Securitized Infrastructure and its Relationship to Real Estate
What are the contemporaneous correlations between direct and indirect infrastructure and other asset returns?
What is the long-run relationship between direct and indirect real infrastructure i.e. are investors able to achieve long-term portfolio diversification benefits by allocating funds to both direct and securitized infrastructure?
Are indirect and direct infrastructure assets driven in the long run by the same underlying business factor - namely infrastructure?
Are there similarities regarding the long-run relationship between direct and indirect real estate and direct and indirect infrastructure and are there any links between infrastructure and real estate returns over the long run?
What are the adjustment speeds between direct and indirect infrastructure and the long-run equilibrium?
What are the short-run dynamics between direct and indirect infrastructure and what are the theoretical and empirical implementations?
Does indirect infrastructure reflect stock market or infrastructure performance in the short run?
Infrastructure - A New Dimension of Real Estate? An Asset Allocation Analysis
What is an appropriate definition of infrastructure and what is the present status of research on infrastructure investment research and what is the future potential in an asset allocation context?
What mechanisms and frameworks are necessary to further develop the infrastructure in- vestment market?
What data are currently available and to what extent do they limit infrastructure investment research?
What are the risk, return and diversification characteristics of direct and indirect infrastruc- ture assets compared to other main assets?
What are the theoretical similarities and differences between real estate and infrastructure assets?
What are the empirical similarities and differences between infrastructure and real estate and should both be regarded as unique and separate asset classes?
Which role do direct and indirect infrastructure play in a multi-asset portfolio using a semi- variance optimization (Estrada, 2007) and different investor specific target rates of return?
Real Estate: A Victim of Infrastructure? Evidence from Conditional Asset Allocation
What is the present state and scope of the literature in this relatively new field of invest- ment research?
What role does infrastructure play in a multi-asset portfolio when using a downside risk optimization (Bawa and Lindenberg, 1977) and a broad set of assets including traditional assets like stocks bonds and real estate as well as alternatives like private equity and com- modities?
What are the downside diversification benefits of infrastructure compared to other assets when a distinction is made between different market phases?
What performance characteristics does infrastructure delivers during different phases of the general equity market and what are the effects on specific portfolio allocations?
How does a situation of constrained asset weights affect the role of infrastructure in the portfolio?
How does the allocation to infrastructure change under the assumption of different investor specific target rates?
Infrastructure and real estate share some similar underlying characteristics, but is infra- structure able to replace real estate in the portfolio by delivering performance characteris- tics which are superior to those of real estate?
How much into Infrastructure? Evidence from Dynamic Asset Allocation
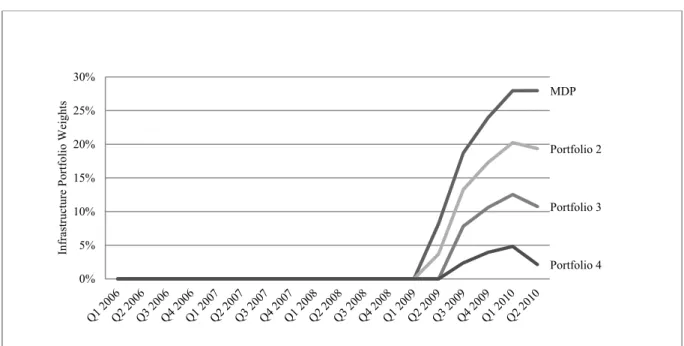
What are the time-varying asset weights of infrastructure, when using an extending as well as a rolling optimization approach, which accounts for semi-variance as well as downside- risk?
To what extent do these results differ from static optimization procedures?
What are the long-term asset characteristics and diversification benefits of infrastructure compared to other assets?
How does changing the investment horizon affect infrastructure allocations?
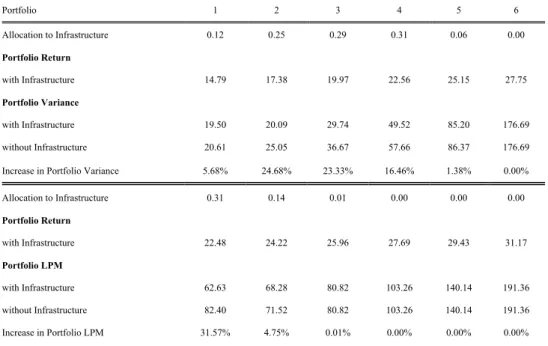
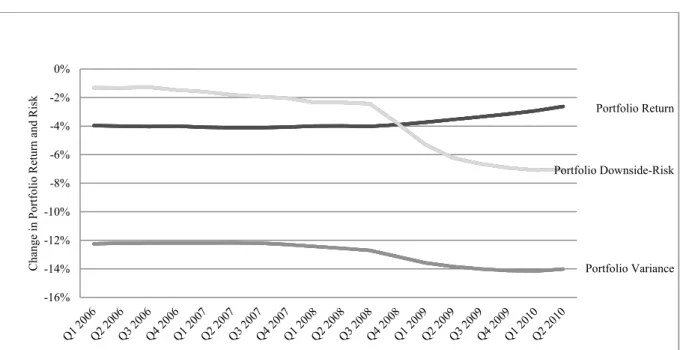
How does the inclusion of infrastructure affect the risk (mean-variance and mean- downside risk) and return characteristics of a multi-asset portfolio over time?
Is there a difference in portfolio weights if real as opposed to nominal asset returns are used for optimization?
Does changing the target returns affect the allocation to infrastructure over the observation horizon?
Does the inclusion of infrastructure specifically affect the allocation to real estate and is the allocation pattern of both assets similar over time?
Direct Infrastructure Investment and its Role in Drawdown-Efficient Portfolios
To what extent is infrastructure allocated to the portfolio when the data frequency is on a monthly basis and the applied measure of risk is Conditional Drawdown at Risk (CDaR) according to Checkolov et al. (2000, 2003, 2005)
What are the drawdown characteristics of infrastructure compared to other assets over time?
What is the allocation to infrastructure if a dynamic optimization process is applied in this context?
How does changing the confidence intervals affect allocations?
Is Infrastructure a hedge against pension liabilities?
How does the allocation towards infrastructure change if different investor specific target rates of return are applied?
Can infrastructure hedge against downside systematic risk?
1.3 Course of Analysis
The following overview presents the chronology of the five articles, with regard to the authors (alphabetical), the publication history as well as the current publication status.
The Interactions Between Direct and Securitized Infrastructure and its Relationship to Real Estate
Authors: Konrad Finkenzeller, Benedikt Fleischmann
Submission to: Review of Quantitative Finance and Accounting First Submission: 16/09/2011
Current Status: Under review
Infrastructure – A New Dimension of Real Estate? An Asset Allocation Analysis Authors: Tobias Dechant, Konrad Finkenzeller, Wolfgang Schaefers
Submission to: Journal of Property Investment and Finance First Submission: 16/12/2009
Acceptance for Publication: 30/03/2010
Current Status: Published Volume 28, Number 4, 2010
Real Estate: A Victim of Infrastructure? Evidence from Conditional Asset Allocation Authors: Tobias Dechant, Konrad Finkenzeller, Wolfgang Schaefers
Submission to: Journal of Real Estate Portfolio Management First Submission: 21/09/2011
Current Status: Under review
How much into Infrastructure? Evidence from Dynamic Asset Allocation Authors: Tobias Dechant, Konrad Finkenzeller
Submission to: Journal of Property Research First Submission: 02/08/2011
Revised Submission: 18/10/2011 Revised Submission: 09/01/2012 Current Status: Under review
Direct Infrastructure Investment and its Role in Drawdown-Efficient Portfolios Authors: Tobias Dechant, Konrad Finkenzeller
Submission to: Journal of Banking and Finance First Submission: 16/12/2011
Current Status: Under Review/with editor
2. The Interactions Between Direct and Securitized Infrastructure and its Relationship to Real Estate
Konrad Finkenzeller Benedikt Fleischmann
Abstract
The importance of infrastructure as an alternative asset has emerged significantly in recent years. Based on a novel dataset, this paper investigates the long-run relationships and short- run dynamics between direct and securitized infrastructure returns and the relationsship to the relevant real estate indices. Based on a cointegration analysis, we are able to detect the exist- ence of a long-run relationship between direct and securitized infrastructure driven by a com- mon underlying infrastructure business factor. This result implies that investors are not able to realize long-term portfolio diversification benefits by allocating funds to both direct and secu- ritized infrastructure, since they are substitutable over the long run. However, in the short run indirect infrastructure is driven by the general stock market and follows the direct infrastruc- ture market - a status (similar in particular to the “pre-Reit era”), which might reflect the lack of segmentation and focus of listed infrastructure companies. Furthermore, we are unable to investigate the relationship between direct infrastructure and direct real estate returns, either in the short run or long run - a result which contradicts to the assumption of infrastructure as being a subset of or substitute for real estate.
2.1 Introduction
During recent years, infrastructure investments1 have become increasingly appealing for insti- tutional investors such as pension funds and insurance companies.2 Especially factors like infrastructures conservative nature, as a tangible and real asset, along with distinctive risk return characteristics (compared to conventional assets) account for it being classified as a viable alternative investment opportunity. However, despite the diversity in the infrastructure asset universe, investors have been attracted by the asset class for three main reasons. Firstly, institutional investors are seeking new sources of diversification to supplement core assets like stocks, bonds and real estate in order to avoid substantial losses as experienced during market downturns. Earlier studies measuring the diversification benefits of infrastructure, such as Newell and Peng (2009), Finkenzeller et al. (2010), Dechant et al. (2010) have pro- vided evidence of such benefits. Secondly, the inelastic demand for and consequently stable and predictable cash flows of infrastructure investments match investors’ future liabilities (Inderst 2010). Thirdly, infrastructure investments are considered as providing an (at least partial) hedge against inflation. However, this depends on the specific design of the asset, as well as the degree of regulation and pricing power (Bitsch et al. 2010).
Private investment opportunities in this sector are driven predominantly by a major imbalance between demand and supply. By 2030, global infrastructure requirements are estimated at being around US$ 3 trillion per annum, while financially constrained governments will only be able to provide about US$ 1 trillion (OECD 2006). The economic impact of this imbalance will be significant and further promote private involvement, along with private investment opportunities. The link between infrastructure investment, economic productivity and growth is well established in the macroeconomic literature (Röller and Waverman, 2001; Esfahani and Ramirez, 2003) and is generally accepted. The World Economic Forum recently high- lighted underinvestment in infrastructure as one of three main global risks in the future (WEF 2010).
Private investment in infrastructure can be made either directly (unsecuritized) by acquiring the physical asset /the specific user rights3 or via several forms of indirect (securitized) infra- structure, such as closed-ended funds (for example private equity funds, Axelson et al. 2007)
1 Infrastructure assets can be divided into two main categories: economic and social infrastructure. Economic infrastructure includes long lasting, large-scale physical structures like transportation and communication infrastructure, as well as energy and utility facilities. Social infrastructure, on the other hand, includes education, healthcare, waste disposal as well as judicial facilities (Wagenvoort et al.2010)
2 The US pension fund CalPERS, for example, intends to increase its infrastructure allocation from 0.5% to 1.5% within the next two years.
Some Australian and Canadian pension funds already have an infrastructure share of over 10% (Inderst, 2009).
3 Specific infrastructure sectors/projects are subject to specific pre-defined user rights with the government i.e. the private investors are not able to gain freehold interests on the assets. User rights entail private investors’ duties and rights for a specific contract period, after which
and listed infrastructure companies. Intuition suggests that the same fundamental market fac- tors influence both securitized and unsecuritized infrastructure assets, although some major differences remain. Unsecuritized infrastructure assets face lot-size and illiquidity issues, im- mature market structures and lack effective secondary asset markets. Additionally, direct in- frastructure markets are characterized by low information efficiency along with intransparent structures which in turn yields in (comparatively) high information and due-diligence costs, which significantly affect direct investment returns. Especially listed infrastructure can miti- gate the specific disadvantages of direct infrastructure assets and has thus experienced a sig- nificant rise during the last few decades. Listed infrastructure shares/assets offer a high level of liquidity and transparency, also reducing the minimum required investment i.e. the market entrance barriers for potential investors. However, infrastructure share prices are only reflect the underlying fundamental (the infrastructure business) value, but also depended on factors like the state of the overall capital market, stock market sentiment as well as liquidity.
Both direct and securitized infrastructure assets are influenced by and represent the same un- derlying business, namely infrastructure. The relationship between the two is of considerable importance for asset allocation decisions and subsequently, the first focus of the paper is on providing an understanding of dynamic interactions and linkages between direct and listed infrastructure assets. The question of whether listed infrastructure actually provides exposure to direct infrastructure or merely represents additional exposure to common stocks, is funda- mental to the analysis, with respect to both the short and long-run dynamics. Although the contemporaneous correlation between indirect and direct infrastructure returns is estimated as low (Dechant et al. 2010) and suggests potential gains from diversification, the existence of a long-run relationship between both assets may limit such diversification benefits, especially for long investment horizons. If listed and direct infrastructure are cointegrated with each oth- er, both assets would be substitutable within a portfolio i.e. the long run diversification bene- fits of adding infrastructure to the portfolio would be similar for both indirect and direct infra- structure assets. This information is crucial for long-term buy and hold investors such as pen- sion funds and contributes significantly to their long-term asset allocation decisions with re- gard to infrastructure. Furthermore, we also consider the effect of cointegration on the short- run dynamics between indirect and direct infrastructure and analyze whether one asset has predictive power for the other.
The second focus of the paper is on the relationship between infrastructure and the related real estate sector. Due to their apparently underlying similarities with similar investment vehicles, investors indentify with infrastructure mainly as assets that are related to/ or are a subset of
commercial real estate and therefore often replace real estate with infrastructure assets in their portfolios. This study analyzes the rationality of such behavior and investigates the short-run dynamics and long-term interrelations between real estate and infrastructure assets. Indeed, despite the diversity of infrastructure assets, the similarities in underlying infrastructure asset characteristics and real estate assets are obvious. Among others, both asset classes share a physical and real-asset character, large investment lot sizes4 which create high entry barriers, long-term investment horizons, stable and predictable cash-flow patterns during operating phases, income and capital-return components, a dependency of asset pricing on valuations, expected inflation-hedging characteristics and diversification potential with respect to tradi- tional assets.5
Due to the underlying asset similarities, along with the existence of direct and securitized in- vestment opportunities for both assets -infrastructure and real estate- the literature related to our research questions is sourced from the real estate sector. The interrelation and dynamics between direct and securitized real estate is a core question in real estate research and has been discussed in various academic studies. Research shows that the long–term linkages be- tween indirect and direct real estate assets are indeed substantially stronger than assumed by the simple correlation figures (Oikarinen et al. 2011, Kluger 1998, Giliberto 1990). Indirect returns are estimated to lead direct real estate returns (Geltner and Kluger 1998, Pagliari et al.
2005), a result which is evident from the early 1990s6 onwards. During this period, an infor- mationally maturing REITs market began to reflect the true underlying real estate value more accurately, so that the differences between indirect and direct real estate returns began to di- minish over time (Clayton MacKinnon 2001, Pagliari et al 2005). However, in the short run REITs are influenced by general stock market behavior and sentiment (Hoesli and Serrano 2007). These questions are similar to those associated with listed and direct infrastructure assets. Therefore, we adopt objects of study from the field of real estate research and apply them to infrastructure.
4 Private infrastructure project finance (Esty, 2004, Gatti et al. 2007) is usually operated through a special purpose vehicle (SPV). Dependent on the maturity stage and/or the type and size of the infrastructure project, various different equity investors and debt lenders are involved.
Although individual projects can be extremely large, the involvement of a variety of equity investors, along with high gearing ratios, could reduce the lot-size problem from an equity investor perspective. The median project deal size (debt plus equity) is estimated at about $200- 300 million (Araujo 2010).
5 However, despite the obvious similarities, the differences between both assets are striking. Whereas property markets can be described as relatively competitive, infrastructure markets often reveal oligopolistic or even monopolistic structures. A further issue is the limited poten- tial to acquire ownership of direct infrastructure assets, due to regulatory constraints, which often only allow user rights. Moreover, real estate, in general, may lend itself to appropriate alternative uses, whereas infrastructure assets are limited to very specific and restricted uses.
Furthermore, there is a greater degree of transparency in the real estate market, than in the infrastructure market.
6 The so called “new REIT era“ in the early 1990’s is regarded as a point of segmentation and maturitisation of REITs and goes along with the tax reform act in 1993. An increasing number of institutional participants was able to facilitate information demand and flows in public
We are able to detect a long-run relationship between direct and securitized infrastructure driven by an unquantifiable underlying infrastructure factor which stems from a common business model of both indices. Additionally, we find that in the short run, the direct infra- structure market leads the indirect market, a situation which is comparable with the pre-REIT era in the US (Meyer and Webb, 1994) and may reflect the immature and inefficient state of the infrastructure market. With regard to the related real estate sector, we are not able to de- tect short-run dynamics or long-term interactions between both asset classes.
The reminder of the paper is structured as follows. Section 2 describes the data and the meth- odology which is based on Johannsen and Engle Granger cointegration tests. The results are presented in Section 3. The final section draws conclusions and suggests areas for further re- search.
2.2 Data
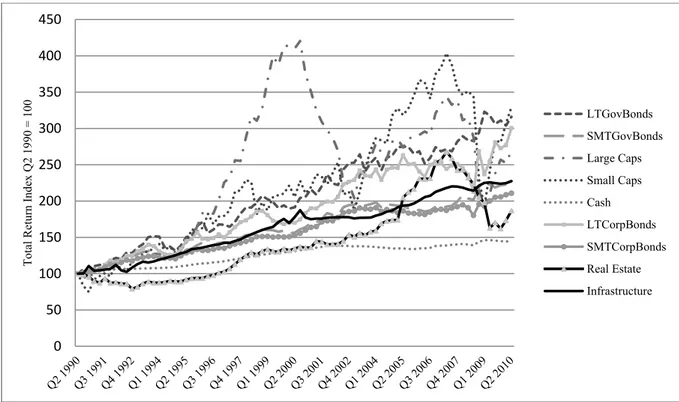
The investigation employs US total return index data covering the period from Q2 1990 to Q2 2010. In particular, we consider direct and listed infrastructure, direct and listed real estate, stocks and bonds. Infrastructure and real estate data are selected in accordance with our re- search questions, whereas stocks and bonds represent the main assets classes.
The general stock market is represented by the S&P 500 Composite series. The bond market is represented by the Barclays US Treasury Bond 104 Index. Listed infrastructure is repre- sented by the UBS US Infrastructure and utilities index, which is sourced from Bloomberg. At Q2 2010, the index consists of 88 infrastructure and utility companies listed in the US and has a total market capitalization of US$ 574 billion.
The direct infrastructure performance index is provided by the Center of Private Equity Re- search (CEPRES) and is a sub-index of a more general CEPRES dataset of private equity in- vestments and which has been used by former studies including Franzoni et al. (2011), Krohmer et al. (2009), Füss and Schweizer (2011). The infrastructure index covers a 930 in- dividual operating infrastructure project in the US and is based on a broad reporting sample of 135 global infrastructure equity investors. The index methodology is in accordance with Peng (2001) and is based on the Method of Moment Repeat Sales Regression (MM-RSR). In Peng’s original approach to determining a venture capital index, his dataset is based on fi- nancing rounds of various venture capital firms7. The initial financing round at time is em- ployed to determine the actual price of the investment project. With the next financing round at , the new value of the investment is established. This process continues through
each financing round. An issue with the CEPRES data is that the base data does not consist of financing rounds, but is derived from cash flows, and the matching financing rounds are un- known. Therefore, prices are estimated by using the cash flows (net) themselves. With these estimated prices, one can proceed with the methodology proposed by Peng (2001). In order to estimate the prices of investments using cash-flows, the IRR from each cash flow is deter- mined. The initial cash flow in constitutes . By using the IRR of the cash flow series, is compounded until the next cash flow. This results in an estimation of the value , which corresponds to the interest gained at time . Adding the costs (or subtracting the gains) for the interests acquired (or sold) at time .to the actual value acquired at , yields in the total worth of the interests held. 8 For a more formal illustration of this process, refer to Schmidt and Ott (2006).
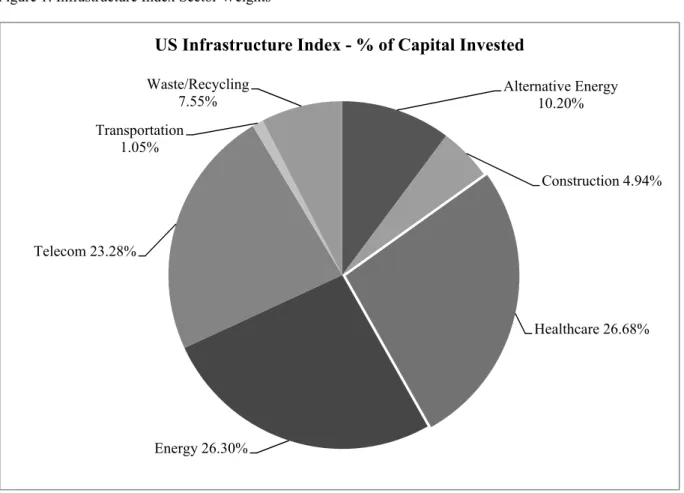
To aid comparison with unlevered real estate data and to demonstrate unbiased direct infra- structure performance, the index is corrected for gearing. The capitalization of the index adds up to around $27.2 billion of invested equity and only includes sectors in accordance with the definition of infrastructure from Kaserer et al. (2009). The relatively high weights of health care, energy and telecom assets are in accordance with the investment objectives of various types of investors and reflect the weights of institutional infrastructure investments. Together with a sufficient number of transactions and a high market capitalization, the index constitutes an appropriate tool for benchmarking direct infrastructure performance in the US. Exhibit 1 shows the average sector weights, which are calculated according to capital invested over the entire sample period. The average index shares are 34% for social (health care, waste/recycling) and 66% for economic (transportation, telecom, energy, alternative energy, construction) infrastructure.
Exhibit 1: US Infrastructure Index Sector Weights
The TBI Index, which is published by the MIT center for Real Estate, is applied to reflect direct real estate performance. The index is based on the NCREIF index portfolio and reflects transaction-based performance i.e. it is not subject to lagging and smoothing effects (Geltner 1993). All remaining assets are derived from Thomson Datastream. We use the FTSE NAREIT Equity Index to mirror the American real estate stock market.
The main differences between both pairs (infrastructure and real estate) of listed and direct indices are twofold. Whereas both listed indices are subject to leverage, which affects the mean and amplitude of asset returns, both direct return series are in an unlevered status.
Moreover, the sector mix in both index pairs differs from one another, an issue which has been discussed in the real estate literature (Pagliari and Webb 1995, Pagliari et al 2005).
However, these issues could effect the short-run link, but not the long-run relationship be- tween asset returns i.e. the presence of a common underlying “real estate” or “infrastructure”
factor, which drives both indirect as well as direct asset returns. The underlying factor is not quantifiable, but represents the underlying common business activity of both related return series.
Contrary to trading most financial assets, buying and selling direct real estate and direct infra- structure evokes high transaction costs, which reduce returns. Round trip costs of 6%9 are employed for US real estate transactions. Infrastructure transactions costs are, to a large ex- tent, independent of the size of the project, since they all require general services such as technical, legal and financial advisory, as well as a sound estimation of demand risk. As a
Alternative Energy 10.20%
Construction 4.94%
Healthcare 26.68%
Energy 26.30%
Telecom 23.28%
Transportation 1.05%
Waste/Recycling 7.55%
US Infrastructure Index - % of Capital Invested
result, the cost can amount to a maximum of 10% of total project cost. Average infrastructure projects evoke round trip costs of about 7.5%10 (for road projects, see for example Dudkin and Välilä, 2005, Salino and de Santos, 2008). However, actual transaction costs depend on the holding period of assets. Based on the findings of Fisher and Young (2000) and Geltner and Pollakowski (2007), the average institutional holding period of direct real estate is rough- ly ten years. According to Kaserer et al. (2009), the average duration of infrastructure invest- ments is four years, which seems very short. However, there is a huge difference between the average concession period which is agreed between the government and the SPV, and the holding period of an individual equity investor. While concession periods agreed between the regulator and the SPV are around 30 years across all sectors, on average, an individual inves- tor might have shorter holding periods, depending on strategic issues, such as the stage of the infrastructure project (OECD, 2010). Due to the growing maturity of the market and the in- creasing involvement of long-term investors, the average holding is likely to rise over the next few years. We use this information from Geltner and Pollakowski (2007) and from Kaserer (2009) to adjust direct real estate and direct infrastructure returns.
2.2.1 Correlations
Exhibit 2: Inter-Asset Correlations Based on Annual Returns
Inter Govt.
Bonds
S&P 500 Stocks
Direct Infrastructure
Indirect Infrastructure
Direct Real Estate
Indirect Real Estate
Inter Govt. Bonds 1
S&P 500 Stocks -0.23 1
Direct Infrastructure 0.02 -0.02 1
Indirect Infrastructure 0.08 0.52 -0.01 1
Direct Real Estate -0.10 0.17 0.08 0.18 1
Indirect Real Estate -0.08 0.61 -0.03 0.48 0.28 1
Inter-asset correlations are presented in Exhibit 2. The results demonstrate the good diversifi- cation benefits of direct infrastructure by providing negative correlations with indirect real estate (-0.03), indirect infrastructure (-0.01) and stocks (-0.02). The correlations for the re- maining assets, like direct real estate (0.08) and government bonds (0.02) are only moderately positive. With figures of 0.52 for stocks and 0.48 for indirect real estate, indirect infrastruc- ture yields high correlations with its listed counterparts. However, the correlations also mirror the good diversification benefits of direct real estate, with negative figures of -0.10 for gov- ernment bonds and moderately positive correlations for all other assets, ranging between 0.08 for direct infrastructure and 0.28 for indirect real estate. Similar to indirect infrastructure, in-
direct real estate is correlated with stocks (0.61) and indirect infrastructure (0.28), but exhib- its, in contrast to indirect infrastructure, a positive correlation with its underlying direct real estate performance (0.28).
2.3 Methodology
In order to determine the role and relationship of infrastructure investments, we test for long- run co-movements, as well as short-run dynamics with respect to other time series, because simple correlations on quarterly frequency can lead to misleading interpretations of portfolio diversification effects. Although the time series of returns can be zero (highly) correlated in the short run, they can exhibit strong (weak) long-term relationship(s) and this in turn, should lead to diminishing (increasing) diversification effect between assets (Pengpis and Swanson 2010).
Our first step is to perform a battery of unit roots tests to reach the prerequisite of cointegra- tion, i.e. the time series contain a unit root and are integrated of the same order. We perform the three different unit root tests with various benefits. The Dickey-Fuller Generalized Least Squares (DF-GLS) test (Elliot et al. 1996), the Zivot-Andrews (ZA) test (Zivot and Andrews 1992) and the Kwaitkowski, Phillips, Schmidt and Shin (KPSS) test (Kwaitkowski et al.
1992). The DF-GLS test dominates the ordinary Dickey-Fuller, in terms of small-sample size and power (Maddala and Kim 1998). The ZA test allows for a structural break at an unknown time. While DF-GLS and ZA test have the null hypothesis of non-stationary the KPSS test controls for the converse. Thus, the latter test is for robustness, since it investigates whether the time series is fractionally integrated (that is neither I(0)nor I(1)). All unit root tests are performed including a constant and thus allowing for a break in the intercept for the ZA test.
Exhibit 3 shows that the null hypothesis of a unit root is not rejected for levels, and clearly rejected for the first differences at a 1 percent significance level for the DF-GLS and ZA tests. The KPSS test rejects the stationarity of the levels and indicates the stationarity of the first differences (except the direct real estate returns at a 10 percent level). Hence, all exam- ined time series should be I(1).
Exhibit 3. Unit Root Test
Log Levels Log First Differences
ADF DF-GLS ZA KPSS ADF DF-GLS ZA KPSS
Direct Infrastructure -2.077 0.58 -3.174 1.553*** -8.062*** -2.214** -10.904*** 0.028
Indirect Infrastructure -1.499 0.124 -3.344 0.444*** -5.058*** -2.628*** -7.897*** 0.049
Direct Real Estate -0.395 0.471 -3.664 0.444*** -4.202*** -2.606*** -9.27*** 0.201*
Indirect Real Estate -1.189 0.226 -4.214 0.309*** -5.991*** -2.886*** -8.251*** 0.054
S&P 500 Stocks -1.817 -0.046 -2.701 1.449*** -5.119*** -3.089*** -8.623*** 0.078
In the second step, we test the pair-wise co-movement of two time series by using the Engle and Granger (1987) procedure and the Johansen (1988) / Johansen and Juselius (1990) meth- odology, and test for the null hypothesis of no co-integration. According to Engle and Granger, two non-stationary time series are regressed on each other by simple OLS:
t t j t
i X
X , , (1)
and the residuals t are tested for stationarity by ADF and by using the MacKinnon (1991) critical values. The two time series are co-integrated, if they are both I(1), which we tested above and their residuals from (1) are stationary. The results are summarized in Exhibit 3.
The procedure of Johansen and Juselius links vector auto regression (VAR) with cointegration.
A VAR(k), which is defined as:
t k t k t
t
t A X A X A X
X 1 1 2 2 Ai (2)
where k is the lag length, Ai are the coefficient matrices, Xt is the n-dimensional vector of price levels or the levels of the state variables respectively at time t, and is a vector of constants. If two or more time series are cointegrated (share a long-run relationship), the VAR (k) can be written as a vector error correction model (VECM):
t k
i
i t i t
t X X
X
1
1 (3)
where Xt is the vector of first differences respectively the asset returns as above. The matri- ces irepresent short-term dynamics, whereas represents long-run relationships. If has a full rank n, no cointegration relationship is present. If has a rank 0rn then r coin- tegration relations do exist. Here, can be decomposed into:
β α
where α is the matrix with the adjustment speeds towards the long-run equilibrium and β
describes the rcointegrating relationships. To determine the number rof cointegration rela- tionships, we rely on the maximum-eigenvalue and the trace test with the test statistics:
k
r i
i
trace r T
1
) 1 ln(
)
(
) 1
max eigen Tln( i
where i are the estimated eigenvalues of matrix . The test starts at r0and investigates the number of eigenvalues significantly different from zero i.e. the number of cointegration relationships which could not be rejected.
In order to measure the short run dynamics, Granger Causality tests (1969a see lütkepohl) are applied. The test is based on the described VAR system. The approach tests whether the in- formation of a lagged variable Xt1 has no information content to describe another variable
Yt. The causality is tested with a simple F-test and can provide some information with re- spect to lead-lag structures among the assets.
2.4 Results
2.4.1 Long-Run Dynamics
The diversification potential of assets generally entails two aspects, short-term correlation structures and long term co-movement. Correlation analysis is based a on specific frequency of observations (for example quarterly or annually) and may lead to miss-specified long term investment allocations. For this reason, we use cointegration technique to analyze long-term asset co-movements.
The findings of the Engel and Granger and Johansen cointegration tests for long run relation- ships are presented in Exhibits 4 and 5.
Exhibit 4: Engle-Granger Test
Indices
Unit Root Test in Residuals
Endogenous Exogenous
Variable Variable ADF lag length
Direct Infrastructure Indirect Infrastructure -2.907** 1
Indirect Infrastructure Direct Infrastructure -2.609* 1
Direct Real Estate Indirect Real Estate -3.126** 1
Indirect Real Estate Direct Real Estate -2.884* 1
Direct Infrastructure Direct Real Estate -2.292 1
Direct Real Estate Direct Infrastructure -2.423 1
Indirect Infrastructure Indirect Real Estate -2.042 1
Indirect Real Estate Indirect Infrastructure -2.175 1
Indirect Infrastructure S&P 500 Stocks -1.961 1
S&P 500 Stocks Indirect Infrastructure -1.916 1
Indirect Real Estate S&P 500 Stocks -1.461 1
S&P 500 Stocks Indirect Real Estate -1.183 1
Note. The ADF test is employed with the MacKinnon (1991) ciritical values, lag length is selected with the AIC. ***,** and * indicate the rejection of the null hypothesis at a 1%, 5% and 10% significance level.
Exhibit 5: Johansen and Juselius Test for Cointegration Rank
Trace Test
Statistic Maximum Eigenvalue Test Statistic
Eigen- value
Tested Pairs H0
Direct Infrastructure r=0 0.185 17.836** 17.602**
Indirect Infrastructure r>=1 0.003 0.234 0.234
Direct Real Estate r=0 0.204 18.947** 18.207**
Indirect Real Estate r>=1 0.009 0.740 0.740
Direct Infrastructure r=0 0.098 9.692 8.259
Direct Real Estate r>=1 0.018 1.433 1.433
Indirect Infrastructure r=0 0.099 10.839 8.347
Indirect Real Estate r>=1 0.031 2.493 2.493
Indirect Infrastructure r=0 0.067 8.618 5.607
S&P 500 Stocks r>=1 0.036 3.011 3.011
Indirect Real Estate r=0 0.044 5.278 3.601
S&P 500 Stocks r>=1 0.021 1.677 1.677
Note. ***,** and * indicate the rejection of the null hypothesis at 1%, 5% and 10% significance levels. The critical values are reported in Table 9.
Exhibit 6: Normalized Cointegration Vectors
Direct Infrastructure Constant Indirect Infrastructure
1 0.365 -1.261***
(-0.135)
Direct Real Estate Constant Indirect Real Estate
1 0.219 -0.847***
(-0.049)
Note. ***,** and * indicate the rejection of the null hypothesis at 1%, 5% and 10% significance levels.
We provide new findings about infrastructure assets and are furthermore able to support and confirm some previous findings in the literature. Infrastructure and real estate exhibit similar behavior in terms of long-term relationships between their listed performance and their direct counterpart. Both pairs (real estate and infrastructure) reveal a significant link over the long- run at a 5 percent level for the Engel Granger test. The Johansen test rejects the hypothesis r=0 for both assets at a five percent level, so that the hypothesis r>=1 cannot be rejected. The used critical values can be found in Exhibit 9 in the appendix. The Johannsen procedure sup- ports the results from the Engle Granger tests i.e. proves a cointegration relation between di- rect and indirect assets in each case. However, it is important to note that REITs are forced by law to remain within the core real estate business11, but the listed infrastructure index is only a specialized sector-specific stock index with no binding investment rules and limitations, and is limited only with respect to the definition of infrastructure or to the index classification.
Nevertheless, infrastructure characteristics seem to be present in the listed infrastructure index for the long run i.e. a common underlying, but not quantifiable infrastructure factor seems to influence both indices. This underlying factor can be explained theoretically by a common business activity of both infrastructure series (indices) and therefore, an exposure to similar cash-flow and risk patterns. The argument holds, despite the fact that the infrastructure mix of the UBS index differs from that of the CEPRES Index. This result corresponds with the find- ings from the real estate literature, namely the existence of a common long-term “real estate”
factor in both indices (listed and direct), which is independent of the sector-specific break- down of the index (see Oikarinen et al.2010, Pagliari et al. 2005).
The real estate findings are in accordance with the literature, whereas direct real estate per- formance is mostly represented by the NCREIF index, instead of the transaction-based TBI.
However, the difference between the lagged appraisal-based NCREIF and the TBI should not matter for long-run cointegration relations (see Oikarinen et al. 2011).12 Both results under- pin the theory that indirect assets are driven by sentiment and noise in the short run, but in the long run, the prices of indirect assets float around their fundamental values. These fundamen- tal values are based on current and future cash flows of the underlying business models i.e.
infrastructure and real estate.
A relationship between real estate and infrastructure may be indicative of the fact that both assets share similar underlying characteristics (see Dechant et al. 2010). However, both coin- tegration tests reject this theoretical hypothesis, by yielding insignificant values for the listed
11 US Internal Revenue Code:Sec. 856.
12 For reasons of robustness, we also performed the analysis by using the NCREIF direct real estate index. The results obtained are similar to
assets as well as for their direct counterparts. Since, in consequence, an interrelationship be- tween both assets cannot be confirmed in the long run, it is rational to include both assets in a portfolio aiming at long-term investment horizons.
As indicated in Exhibit 1, all listed assets exhibit high positive correlations with the main stock market (0.49 for infrastructure and 0.65 for real estate) and are caused by short-term stock market sentiment. However, our cointegration tests do not support a significant long-run interrelationship between our listed real assets and the main stock market.
For more insight into the two significant cointegration relations, see equastions (5) and (6).
The cointegration equations are normalized on the direct assets. The results indicate that di- rect and indirect infrastructure move in the same direction, whereas direct infrastructure is estimated to move with a factor of 1.261 with indirect infrastructure. In the same way, direct and indirect real estate moves with a factor weight of 0.847.
Direct Infrastructure = -0.365 + 1.261 Indirect Infrastructure (5) Direct Real Estate = -0.219 + 0.847 Indirect Real Estate (6)
Exhibit 7: Adjustment Speed Coefficients
Direct Infrastructure Indirect Infrastructure
-0.003 0.132***
(-0.011) (-0.046)
Direct Real Estate Indirect Real Estate
-0.075*** 0.146**
(-0.026) (-0.071)
Note. ***,** and * indicate the rejection of the null hypothesis at a 1%, 5%
and 10% significance level.
Exhibit 7 represents the adjustment speed coefficients between the assets and the long-run equilibrium. The results indicate a strong and significant adjustment of indirect infrastructure towards the equilibrium. By contrast, this effect is not present for direct infrastructure returns.
The real estate analysis shows that direct, as well as indirect returns, adjust significantly to- wards the equilibrium, whereas the adjustment speed for REITs is double that of direct real estate, represented by a factor of 0.146 respectively 0.075. This might indicate that direct in- frastructure leads the indirect infrastructure market. On the other hand, real estate markets yield a more converse interaction between listed and direct assets.
2.4.2 Short-Run Dynamics
After investigating the existence of long-run relationships, the short run asset dynamics are investigated by Granger causality tests. The results are presented in Exhibit 8.
Exhibit 8: Granger Causality Test
Indicies
Endogenous Variable
Exogenous
Variable F-Test VAR lag length
Direct Infrastructure Indirect Infrastructure 0.207 2
Indirect Infrastructure Direct Infrastructure 4.247** 2
Direct Real Estate Indirect Real Estate 12.263*** 2
Indirect Real Estate Direct Real Estate 1.818 2
Direct Infrastructure Direct Real Estate 1.489 1
Direct Real Estate Direct Infrastructure 2.065 1
Indirect Infrastructure Indirect Real Estate 2.596 1
Indirect Real Estate Indirect Infrastructure 0.098 1
Indirect Infrastructure S&P 500 Stocks 5.462** 1
S&P 500 Stocks Indirect Infrastructure 1.572 1
Indirect Real Estate S&P 500 Stocks 0.575 1
S&P 500 Stocks Indirect Real Estate 0.06 1
Note. ***,** and * indicate the rejection of the null hypothesis at 1%, 5% and 10% significance levels.
As shown over the long run, underlying fundamentals seem to be predominant in direct and listed assets. However, the short-run analysis sheds a different light on the relationship be- tween listed infrastructure and its direct performance counterpart. We find a short-term influ- ence of direct infrastructure, which is significant at a 5 percent level. Therefore, in the short run, direct market returns might be a better indicator of the infrastructure market factor. The dynamics for the real estate markets seem to be different. REITs lead future direct real estate returns significant at a 1 percent level, which is in accordance with recent findings on the
“new REIT era” after 199313. However, prior to this era, REIT markets had been regarded as immature and linked more to general stock markets and additionally, the direct market had predictive power for the listed market (Oikarinen 2010). We found a very similar situation for both aspects in infrastructure markets, because additionally to the perverse lead lag relation, we also found a significant influence of the general stock market on listed infrastructure re- turns in the short term. This might be caused by the fact that infrastructure markets are imma- ture and listed companies are not forced by law to their specific business model even regard- ing the extent. However, we did not find a significant influence of general stock markets on indirect real estate (see for example Hoesli and Serrano, 2007). This observation might be
13 The so called “new REIT era“ in the early 1990’s is regarded as a point of segmentation and maturitisation of REITs and is associated with the tax reform act of 1993. An increasing number of institutional participants was able to facilitate information demand and flows in public
caused by the quarterly data frequency, which ignores the more rapid inter-quarterly effects between stocks and REITs. High correlations between both assets (0.61) support this argu- ment. Furthermore, we are not able to support significant influences between direct real estate and direct infrastructure, which indicates the independency of both assets even in the short run.
2.5 Summary and Conclusions
Instigated by the attractive investment characteristics associated with infrastructure assets, institutional investor interest in and demand for private infrastructure investments has risen significantly during recent years. However, due to a lack of (direct) infrastructure perfor- mance data, academic research lags behind this development. Using a unique infrastructure dataset, we extend the existing literature on infrastructures portfolio benefits, by examining the short-run and long-run dynamic relationships and interactions between securitized and direct infrastructure returns, as well as their relation to the associated real estate sector. Our results contribute to the general understanding of direct and listed infrastructure asset returns and their relation to each other and in consequence, yield some important insights for actual asset allocation decisions.
Our results support a long run cointegration relationship between direct and indirect infra- structure return indices. Consequently, we detect similar behavior for infrastructure assets to that between direct and indirect real estate assets. This contradicts the intuition based on the short term inter-asset correlation between direct and indirect infrastructure returns which indi- cates no link between both assets. Thus, indirect infrastructure seems to reflect direct infra- structure performance in the long run i.e. a common unobservable underlying “infrastructure factor” seems to drive both indices. More precisely, indirect and direct infrastructure assets would be substitutes in an asset allocation context, if an investor’s investment horizon is long.
Therefore, asset allocation models which are based on correlations and extended to long hori- zons, could imply diversification benefits which are not present. Driven by similar underlying asset characteristics, practically-oriented investors often do not distinguish meaningfully be- tween infrastructure and real estate investments in their portfolio. However, we are not able to support long-term relationships between infrastructure and real estate assets, whereas the indi- rect assets do reveal a high correlation. As a result, the two asset classes are not substitutable, have diversification benefits to each other in the long run and could, therefore, theoretically coexist in the same portfolio.
Our results for short run dynamics reveal an influence of direct on indirect infrastructure re- turns, a result which is not intuitive from an efficient market perspective. However, this result
might be caused by the still immature infrastructure market structures, a situation which was also observable in the earlier US real estate market (pre “new REIT era”). We further find a significant short-term influence of general stock markets on listed infrastructure. This might be caused by an unregulated operational focus of infrastructure companies. In contrast to REIT’s, they are not forced to invest in infrastructure to a specified extent.
Further research could focus on long term asset allocation scenarios, which take into account infrastructure as an additional asset. Moreover, especially the inflation hedging characteristics associated with infrastructure assets are important to long term investors.
2.6 Appendix
Exhibit 9: Critical Values for the Johansen and Juselius test
Critical Values
10% 5% 1%
Trace Test r=0 13.429 15.495 19.937
r>=1 2.706 3.841 6.635
Maximum Eigen- r=0 12.297 14.265 18.520
value Test r>=1 2.706 3.841 6.635
2.5 Literature
Araujo, S.; Sutherland, D. (2010): Public-Private Partnerships and Investment in Infrastruc- ture. OECD Economics Department; Working Papers, No. 803.
Axelson, U.; Stromberg, P.; Weisbach, M. (2007): Why are buyouts levered: The financial structure of private equity funds. National Bureau of Economic Research, NBER Working papers, No.12826.
Bitsch, F.; Buchner, A.; Kaserer, C. (2010): Risk, return and cash flow characteristics of infrastructure fund investments, Euroepan Investment Bank (EIB); EIB-Papers, Vol. 15, p.106–136.
Bradrinath, S.; Kale, J.; Noe, T. (1995): Of shepherds, sheep, and the cross-autocorrelations in equity returns, Review of Financial Studies, Vol.8, p. 401-430.
Chiang, K. (2010): On the Comovement of REIT Prices, Journal of Real Estate Research, Vol. 32 No. 2, p. 187-200.
Clayton, J.; MacKinnon, G. (2001): The Time-Varying Nature of the Link Between REIT, Real Estate and Financial Asset Returns, Journal of Real Estate Portfolio Management, Vol.
7, p. 43-54.
Dechant, T.; Finkenzeller, K.; Schäfers, W. (2010): Real Estate: A Victim of Infrastruc- ture? Evidence from Conditional Asset Allocation, IREBS Infrastructure Working Paper Se- ries, Vol. 2.
Dudkin, G.; Välilä, T. (2006): Transaction costs in Public-Private Partnership: A first look at the evidence. Competition and regulation in network industries, Mortsel, Intersentia, Vol. 1, p.307-330.
Elliott, G.; Rothenberg, T.; Stock, J. (1996): Efficient tests for an autoregressive unit root, Econometrica, Vol. 64, p. 813–36.
Engle, R.; Granger, C. (1987): Co-integration and error correction: Representation, estima- tion and testing. Econometrica, Vol. 55, p. 251–276.
Esfahani, H.; Ramirez, M. (2003): Institutions, infrastructure and economic growth. Journal of Development Economics, Vol. 70, p.443-477.
Esty, B. (2004): Why Study Large Projects? An Introduction to Research on Project Finance, European Financial Management, Vol. 10, p.213-224.
Franzoni F.; Nowak E.; Phalippou L. (2011): Private equity performance and liquidity risk, Journal of Finance, (Forthcoming).
Finkenzeller, K.; Dechant, T.; Schaefers, W. (2010): Infrastructure: a new dimension of real estate? An asset allocation analysis, Journal of Property Investment and Finance, Vol.
28, No. 4, p. 263-274.
Fuess, R.; Schweizer, D. (2011): Dynamic Interactions between Venture Capital Returns and the Macroeconomy: Theoretical and Empirical Evidence from the United States, Review of Quantitative Finance and Accounting, (Forthcoming).
Gatti, S.; Rigamonti, A.; Saita, F.; Senati, M. (2007): Measuring value-at-risk in project finance transactions, European Financial Management, Vol. 13, No. 1, p. 135-158.
Giliberto, S. (1990): Equity Real Estate Investment Trusts and Real Estate Returns. Journal of Real Estate Research, Vol. 5, p. 259-263.
Glascock, J.; Lu, C.; So, R. (2010): Further evidence on the integration of REIT, bond, and stock returns, Journal of Real Estate Finance and Economics, Vol. 20, p.177–194.
Geltner, D.; Kluger B. (1998): REIT-Based Pure-Play Portfolios: The Case of Property Types, Real Estate Economics, Vol. 26, p.581-612.
Geltner, D.; Pollakowski H. (2007): A Set of Indexes for Trading Commercial Real Estate Based on the Real Capital Analytics Transaction Prices Database, MIT Center for Real Estate Commercial Real Estate Data Laboratory – CREDL.
Hoesli, M.; Serrano, C. (2007): Securitized Real Estate and Its Link with Financial Assets and Real Estate: An International Analysis, Journal of Real Estate Literature, Vol.15, p. 59- 84.
Inderst, G. (2010): Infrastructure as an Asset Class, European Investment Bank (EIB); EIB Research Papers, Vol.15.
Johansen, S. (1988): Statistical Analysis of Cointegration Vectors, Journal of Economic Dy- namics and Control, Vol. 12, p. 231-254.
Johansen, S.; and Juselius, K. (1990): Maximum Likelihood Estimation and Inference on Cointegration – with Applications to the Demand for Money, Oxford Bulletin of Economics and Statistics, Vol. 52, p. 169-210.
Kaserer, C.; Buchner, A.; Schmidt, D.; Krohmer, P. (2010): Infrastructure Private Equity, Center of Private Equity Research.
Krohmer, P.; Lauterbach, R.; Calanog, V. (2009): The bright and dark side of staging: In- vestment performance and the varying motivations of private equity, Journal of Banking and Finance, Vol. 33, p.1597-1609.
Kwiatkowski, D.; Phillips, B.; Schmidt, P.; Shin, Y. (1992): Testing the null hypothesis of stationarity against the alternative of a unit root, Journal of Econometrics, Vol. 54, p. 91–115.
Maddala G.; Kim I. (1998): Unit roots, cointegration, and structural change, Cambridge University Press, Cambridge.