Article
An Assessment of Forest Cover Change and Its Driving Forces in the Syrian Coastal Region during a Period of Conflict, 2010 to 2020
Mohamed Ali Mohamed
Citation: Mohamed, M.A. An Assessment of Forest Cover Change and Its Driving Forces in the Syrian Coastal Region during a Period of Conflict, 2010 to 2020.Land2021,10, 191. https://doi.org/10.3390/
land10020191
Academic Editor:
Svetlana Turubanova Received: 26 December 2020 Accepted: 10 February 2021 Published: 13 February 2021
Publisher’s Note:MDPI stays neutral with regard to jurisdictional claims in published maps and institutional affil- iations.
Copyright: © 2021 by the author.
Licensee MDPI, Basel, Switzerland.
This article is an open access article distributed under the terms and conditions of the Creative Commons Attribution (CC BY) license (https://
creativecommons.org/licenses/by/
4.0/).
Department of Geography, Humboldt University of Berlin, 10099 Berlin, Germany;
mohamed.ali.mohamed@geo.hu-berlin.de
Abstract:In Syria, 76% of the forests are located in the Syrian coast region. This region is witnessing a rapid depletion of forest cover during the conflict that broke out in mid-2011. To date, there have been no studies providing accurate, reliable, and comprehensive data on the qualitative and quantitative aspects of forest change dynamics and the underlying drivers behind this change. In this study, changes in the dynamics of forest cover and its density between 2010 and 2020 were detected and analyzed using multi-temporal Landsat images. This study also analyzed the relationship between changes in forest cover and selected physical and socio-demographic variables associated with the drivers of change. The results revealed that the study area witnessed a significant decrease in the total forest area (31,116.0 ha, 24.3%) accompanied by a considerable decrease in density, as the area of dense forests decreased by 11,778.0 ha (9.2%) between 2010 and 2020. The change in forest cover was driven by a variety of different factors related to the conflict. The main drivers were changes in economic and social activities, extensive exploitation of forest resources, frequent forest fires, and weakness of state institutions in managing natural resources and environmental development. Forest loss was also linked to the expansion of cultivated area, increase in population and urban area. Fluctuating climatic conditions are not a major driver of forest cover dynamics in the study area. This decrease in forest area and density reflects sharp shifts in the natural environment during the study period.
In the foreseeable future, it is not possible to determine whether the changes in forest cover and its density will be permanent or temporary. Monitoring changes in forest cover and understanding the driving forces behind this change provides quantitative and qualitative information to improve planning and decision-making. The results of this study may draw the attention of decision-makers to take immediate actions and identify areas of initial intervention to protect current the forests of the Syrian coast region from loss and degradation, as well as develop policies for the sustainable management of forest resources in the long term.
Keywords:land use/land cover detection; forest cover; Landsat; supervised classification; Syria
1. Introduction
Forests represent a main natural resource and provide many ecological, economic, and societal benefits, including conservation of biological and genetic diversity, contribu- tions to nutrient cycling, soil erosion mitigation, air filtration, climate regulation, and the provisioning of food, fiber, and fuel [1–6]. Deforestation in the world due to influence of human activity goes back many centuries, but the severe and rapid depletion of forests and their degradation in recent decades and the resulting significant environmental, social and economic consequences have led to an increase in global interest in monitoring and es- timating areas covered by forests in different parts of the world [4,7–9]. It is estimated that between 1990 and 2015, global forest cover decreased by 3.1% (129 million hectares) [3,10].
This significant loss of forest cover, estimated at 10 million hectares per year, continues to occur at an alarming rate [11]. Therefore, international conventions have been devel- oped to monitor forests over time and evaluate strategies for sustainable management of forest resources [3].
Land2021,10, 191. https://doi.org/10.3390/land10020191 https://www.mdpi.com/journal/land
In recent decades, there has been a decline in forest cover in arid and semi-arid regions at a faster rate than in tropical forests [3,12]. This can be attributed to increased human pressures on forests such as overexploitation, urbanization, agricultural expansion, overgrazing, as well as variability in climate and escalating social unrest [3,9,13]. Thus, deforestation in arid and semi-arid regions poses a serious threat to the ecosystem and biodiversity [3,8,14]. Moreover, this has various consequences such as changes in the local and regional climate and negative impacts on the livelihood of the population in these areas inhabited by more than one billion people [8,15].
On this basis, the information that can be obtained from the analysis of forest cover dynamics in different landscapes at the local and regional levels will facilitate a better understanding of the drivers that cause changes in forest patterns and their spatial extent over time [8]. This, in turn, will help in developing and evaluating strategies for managing forest resources at the national level, as well as implementing relevant directives stipulated in international agreements such as those concerned with combating desertification (United Nations Convention to Combat Desertification of 1994 (UNCCD)), deforestation (Intergov- ernmental Panel for Forests, 1996 Intergovernmental Forum for Forests, 2000 (IPF IFF)) and protection of rare and endangered plant and animal species and their habitats (Convention on International Trade in Endangered Species of Wild Fauna and Flora, 1975 (CITES)) [3].
At present, accurate and continuously updated information covering changes in the spatial extent of forest cover is of great importance for the sustainable management of forest ecosystems [9,16]. These data can be obtained from field studies, however, they document changes in forests at the local level, in addition to being very expensive and time consuming [1,3]. A remote sensing approach has been widely shown to be the appropriate method for documenting changes in forest cover and directly detecting biodiversity due to the ability to quickly and efficiently monitor forest dynamics at regional and global scales and at regular time intervals [1,15]. Consequently, the detection, identification and mapping of temporal and spatial changes of forests based on the processing and analysis of remote sensing data is one of the most important applications of remote sensing technology [15,17].
Since the launch of the first Earth resource technology satellite (ERTS-1 or Land- use Satellite (Landsat 1)) in 1972, dense time-series of remote sensing data have be- come available for frequent monitoring of spatio-temporal dynamics of land use/land cover in different parts of the world [1,9,18] such as data provided by Landsat, Thermal Emission and Reflection Radiometer (ASTER), Moderate Resolution Imaging Spectro- radiometer (MODIS), and Sentinel-2 [1,3,9,18]. The use of these data with a selectable temporal resolution enables near real-time monitoring of changes in forest cover, and provides crucial information for forest resource management at the local and regional levels [18,19]. In recent years, many studies have been conducted using multitemporal satellite images to monitor and map changes in forest cover around the world. These studies used developed methodologies for this purpose, such as pixel-based classifica- tion analyses [1,3,8,13,15,20–27], vegetation indices analysis [6,20,28,29], and object-based or object-oriented classification analyses [7,9,18,20,21,30–34]. Meanwhile, many studies based on remotely sensed data and GIS techniques have been conducted to study forest degradation in different regions around the world, such as those studies that used Landsat images and different vegetation indices to estimate the impact of selective logging, forest fires and the intense production of coal on the loss of forest cover as well as to map de- graded forests [35–41]. Other studies have used time-series MODIS images to monitor near real-time land/forest cover changes and forest degradation [42–44].
Forests are among the most seriously threatened natural land uses in Syria due to human-induced deforestation activities, particularly those associated with the ongoing conflict since mid-2011. These activities are often represented by frequent forest fires occur- ring on a large scale as well as the illegal production of wood and firewood, which have transformed from individual encroachments by the population into collective encroach- ments that have destroyed thousands of hectares of forests [45]. Thus, it is expected that forests in the Syrian coast region, which represent more than 75% of the total area of Syria’s
Land2021,10, 191 3 of 26
forests, have undergone remarkable changes during the conflict, and it is also expected that these forests have suffered from continuous depletion. To date, due to the ongoing conflict and the political situation in Syria, there are no studies that provide accurate, reliable, and comprehensive data on the temporal and spatial dynamics of forest change in this region and analyze the driving forces behind this change. Therefore, this study aims (1) to monitor LULC changes in the Syrian coast region using multi-temporal Landsat images during the period between 2010 and 2020, (2) to analyze the spatial and temporal dynamics of forest cover in order to determine the patterns of change in this cover, (3) to evaluate the density and distribution of forest cover, and (4) to identify the potential proximate drivers behind the dynamics of change in forest cover with a focus on direct and indirect drivers associated with the conflict situation in the country. By understanding the effects of the driving forces on changes in forest cover in the study area, this study can help in identifying the areas of initial intervention to protect the forests in the Syrian coast region from loss and degradation. In addition, this study can contribute to effective strategic planning for sustainable development of forest resources in Syria.
2. Study Area
The study area covers the Syrian coast basin or Syrian coast region, which is located in the western part of Syria (Figure1). The coast region extends from Kel Da ˘gı mountain (arabic, ˇGabal al-Aqra
Land 2021, 10, x FOR PEER REVIEW 3 of 25
conflict since mid-2011. These activities are often represented by frequent forest fires oc- curring on a large scale as well as the illegal production of wood and firewood, which have transformed from individual encroachments by the population into collective en- croachments that have destroyed thousands of hectares of forests [45]. Thus, it is expected that forests in the Syrian coast region, which represent more than 75% of the total area of Syria’s forests, have undergone remarkable changes during the conflict, and it is also ex- pected that these forests have suffered from continuous depletion. To date, due to the ongoing conflict and the political situation in Syria, there are no studies that provide ac- curate, reliable, and comprehensive data on the temporal and spatial dynamics of forest change in this region and analyze the driving forces behind this change. Therefore, this study aims (1) to monitor LULC changes in the Syrian coast region using multi-temporal Landsat images during the period between 2010 and 2020, (2) to analyze the spatial and temporal dynamics of forest cover in order to determine the patterns of change in this cover, (3) to evaluate the density and distribution of forest cover, and (4) to identify the potential proximate drivers behind the dynamics of change in forest cover with a focus on direct and indirect drivers associated with the conflict situation in the country. By under- standing the effects of the driving forces on changes in forest cover in the study area, this study can help in identifying the areas of initial intervention to protect the forests in the Syrian coast region from loss and degradation. In addition, this study can contribute to effective strategic planning for sustainable development of forest resources in Syria.
2. Study Area
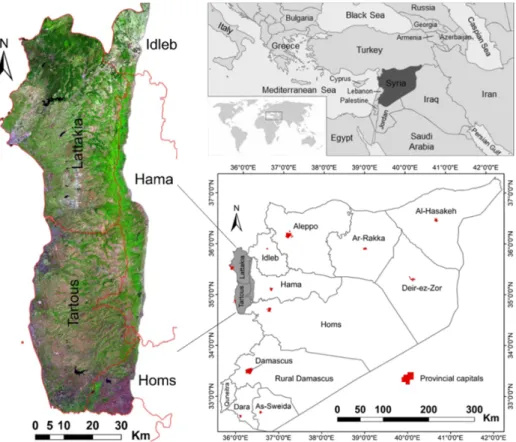
The study area covers the Syrian coast basin or Syrian coast region, which is located in the western part of Syria (Figure 1). The coast region extends from Kel Dağı mountain (arabic, Ǧabal al-Aqraʿ) in the north to the depression of the Akkar Plain and the Baqi’a in the south, and from the drainage divide (water divide) between the Orontes River Basin and the coast Basin in the east and to the coastal strip in the west. The region is bounded by 34°31′ N to 35° 37′ N latitude and 35° 43′ E to 36° 26′ E longitude covering a geograph- ical area of about 5388 km2.
Figure 1. Location of the study area, the 14-governorates administrative divisions (right), and false colors composite of Landsat 5 Thematic mapper (TM) image of 2010 (band 6-5-4 as red, green, and blue (RGB) color) (left).
) in the north to the depression of the Akkar Plain and the Baqi’a in the south, and from the drainage divide (water divide) between the Orontes River Basin and the coast Basin in the east and to the coastal strip in the west. The region is bounded by 34◦310N to 35◦370N latitude and 35◦430E to 36◦260E longitude covering a geographical area of about 5388 km2.
conflict since mid-2011. These activities are often represented by frequent forest fires oc- curring on a large scale as well as the illegal production of wood and firewood, which have transformed from individual encroachments by the population into collective en- croachments that have destroyed thousands of hectares of forests [45]. Thus, it is expected that forests in the Syrian coast region, which represent more than 75% of the total area of Syria’s forests, have undergone remarkable changes during the conflict, and it is also ex- pected that these forests have suffered from continuous depletion. To date, due to the ongoing conflict and the political situation in Syria, there are no studies that provide ac- curate, reliable, and comprehensive data on the temporal and spatial dynamics of forest change in this region and analyze the driving forces behind this change. Therefore, this study aims (1) to monitor LULC changes in the Syrian coast region using multi-temporal Landsat images during the period between 2010 and 2020, (2) to analyze the spatial and temporal dynamics of forest cover in order to determine the patterns of change in this cover, (3) to evaluate the density and distribution of forest cover, and (4) to identify the potential proximate drivers behind the dynamics of change in forest cover with a focus on direct and indirect drivers associated with the conflict situation in the country. By under- standing the effects of the driving forces on changes in forest cover in the study area, this study can help in identifying the areas of initial intervention to protect the forests in the Syrian coast region from loss and degradation. In addition, this study can contribute to effective strategic planning for sustainable development of forest resources in Syria.
2. Study Area
The study area covers the Syrian coast basin or Syrian coast region, which is located in the western part of Syria (Figure 1). The coast region extends from Kel Dağı mountain (arabic, Ǧabal al-Aqraʿ) in the north to the depression of the Akkar Plain and the Baqi’a in the south, and from the drainage divide (water divide) between the Orontes River Basin and the coast Basin in the east and to the coastal strip in the west. The region is bounded by 34°31′ N to 35° 37′ N latitude and 35° 43′ E to 36° 26′ E longitude covering a geograph- ical area of about 5388 km
2.
Figure 1. Location of the study area, the 14-governorates administrative divisions (right), and false
colors composite of Landsat 5 Thematic mapper (TM) image of 2010 (band 6-5-4 as red, green, and blue (RGB) color) (left).
Figure 1.Location of the study area, the 14-governorates administrative divisions (right), and false colors composite of Landsat 5 Thematic mapper (TM) image of 2010 (band 6-5-4 as red, green, and blue (RGB) color) (left).
The surface elevation varies between 0 to 1550 m above sea level, with an average of 775 m (Figure2). Depending on the values of the elevation and the slope (Figure2),
Land2021,10, 191 4 of 26
the region can be divided into three basic geomorphological units, namely, the coastal strip or the coastal area that is characterized by its narrow plains (elevation, 0–121 m, slope, 0-2%), plateaus (elevation, 121–589 m, slope, 2.1–10%), and mountains (elevation, 590–1550 m, slope, 10.1–29%) [46–48]. The disturbances caused by the tectonic movements that extended from the early Pleistocene to the Upper Holocene, which were represented by the rise and fall of the sea level notably during the Tyrrhenian period, in addition, many geomorphological processes which were mainly controlled by climatic factors, had a clear impact on the formation and development of the bedrock in the region [48,49]. The bedrock is mostly composed of clayey lime-stone, sandstone, and composition of the limestone and marl deposits on which different types of soils have developed [48,49]. The main types of these soils are Entisols, Incepti-sols, Mollisols, and Vertisols [48,50].
The Mediterranean climate is the prevailing climate in the region [51,52]. This cli- mate is characterized by hot and dry summers, while winters are wet and relatively cold [48,51]. Rainfall is concentrated mainly in the winter season (between November and March) [48]. The quantity of precipitation gradually increases with the above sea level altitude from the sea towards the inland regions, with an annual average ranging from 900 mm in the coastal strip to 1500 mm in the coastal mountains (Figure2) [48,53,54]. The average annual temperature is about 20◦C in the coastal strip and about 15◦C in the coastal mountains [48,54].
The surface elevation varies between 0 to 1550 m above sea level, with an average of 775 m (Figure 2). Depending on the values of the elevation and the slope (Figure 2), the region can be divided into three basic geomorphological units, namely, the coastal strip or the coastal area that is characterized by its narrow plains (elevation, 0–121 m, slope, 0- 2%), plateaus (elevation, 121–589 m, slope, 2.1–10%), and mountains (elevation, 590–1550 m, slope, 10.1–29%) [46–48]. The disturbances caused by the tectonic movements that ex- tended from the early Pleistocene to the Upper Holocene, which were represented by the rise and fall of the sea level notably during the Tyrrhenian period, in addition, many geo- morphological processes which were mainly controlled by climatic factors, had a clear impact on the formation and development of the bedrock in the region [48,49]. The bed- rock is mostly composed of clayey lime-stone, sandstone, and composition of the lime- stone and marl deposits on which different types of soils have developed [48,49]. The main types of these soils are Entisols, Incepti-sols, Mollisols, and Vertisols [48,50].
The Mediterranean climate is the prevailing climate in the region [51,52]. This climate is characterized by hot and dry summers, while winters are wet and relatively cold [48,51].
Rainfall is concentrated mainly in the winter season (between November and March) [48].
The quantity of precipitation gradually increases with the above sea level altitude from the sea towards the inland regions, with an annual average ranging from 900 mm in the coastal strip to 1500 mm in the coastal mountains (Figure 2) [48,53,54]. The average annual temperature is about 20 °C in the coastal strip and about 15 °C in the coastal mountains [48,54].
Figure 2. Slope (in %) derived from Advanced Spaceborne Thermal Emission and Reflection Radiometer (ASTER)-digital elevation model (DEM) [46] (a), topographical elevation above sea level in meter [46] (b),spatial pattern of average yearly rainfall adapted from [53,54] (c), and average annual rainfall between 2008 and 2020 adapted from [53] (d).
The population of the study area reached about 2 million in 2009, with a population density of 405 inhabitants/km² in Lattakia governorate and 370 inhabitants/km² in Tartous governorate [52]. The population of the region is currently around 3 million [48,55]. The region economy is mainly based on traditional agriculture, where fertile plains are culti- vated with citrus fruits, olives, and field crops such as wheat. Vegetable cultivation and greenhouse cultivation are also widespread in the southern region (Akkar plain) [47,48,52]. The coast region witnessed a remarkable increase in population between 2011 and 2020 as a result of the large-scale displacement of civilian population from the internal areas to the Lattakia and Tartous governorates, which remained relatively untouched by the fighting during the conflict (Figure 3) [56]. This rapid increase in population combined with rural-to-urban migration has resulted in extensive urbanization and strong economic pressures on the region [48,52]. Statistics indicate that the population density in the nar- row coastal strip was nearly 20 times the national average and 6 times the average popu- lation density in other areas of the study area [51,52,55].
Figure 2.Slope (in %) derived from Advanced Spaceborne Thermal Emission and Reflection Radiometer (ASTER)-digital elevation model (DEM) [46] (a), topographical elevation above sea level in meter [46] (b), spatial pattern of average yearly rainfall adapted from [53,54] (c), and average annual rainfall between 2008 and 2020 adapted from [53] (d).
The population of the study area reached about 2 million in 2009, with a population density of 405 inhabitants/km2in Lattakia governorate and 370 inhabitants/km2in Tartous governorate [52]. The population of the region is currently around 3 million [48,55].
The region economy is mainly based on traditional agriculture, where fertile plains are cultivated with citrus fruits, olives, and field crops such as wheat. Vegetable cultivation and greenhouse cultivation are also widespread in the southern region (Akkar plain) [47,48,52].
The coast region witnessed a remarkable increase in population between 2011 and 2020 as a result of the large-scale displacement of civilian population from the internal areas to the Lattakia and Tartous governorates, which remained relatively untouched by the fighting during the conflict (Figure3) [56]. This rapid increase in population combined with rural-to-urban migration has resulted in extensive urbanization and strong economic pressures on the region [48,52]. Statistics indicate that the population density in the narrow coastal strip was nearly 20 times the national average and 6 times the average population density in other areas of the study area [51,52,55].
Figure 3. Distribution of zones of influence in the Syrian coast region between the warring parties at the end of 2010 (a), 2015 (b), and 2020 (c) adapted from [56].
Forests in the Syrian coast region are Mediterranean forests, and their spread is often linked to climate and landforms [57,58]. These forests contain trees of various ages and sizes, the most important of which are broad-leaf trees such as oaks (Quercus) of all kinds, conifers such as Aleppo pine (Pinus halepensis), and turpentine trees (Pistacia palaestina), which cover 57%, 29% and 9% of the forest area, respectively, in addition to the juniper (Juniperus excelsa), cilician fir (Abies cilicica), and cedar (Cedrus libani) trees that form high- altitude forests in the region [57,58]. Figure 4 shows the approximate distribution of main natural forests in the study area for the year 2010, which include evergreen forests (conif- erous Forests) and moist deciduous forests (broad-leaved Forests). The natural non-forest vegetation consists of scrubs that include small areas of sparse vegetation and low shrubs [57–60]. Table 1 also shows the area of these forests in the study area.
Figure 4. Natural vegetation cover in the Syrian coast region for 2010 adapted from [57–60].
Figure 3.Distribution of zones of influence in the Syrian coast region between the warring parties at the end of 2010 (a), 2015 (b), and 2020 (c) adapted from [56].
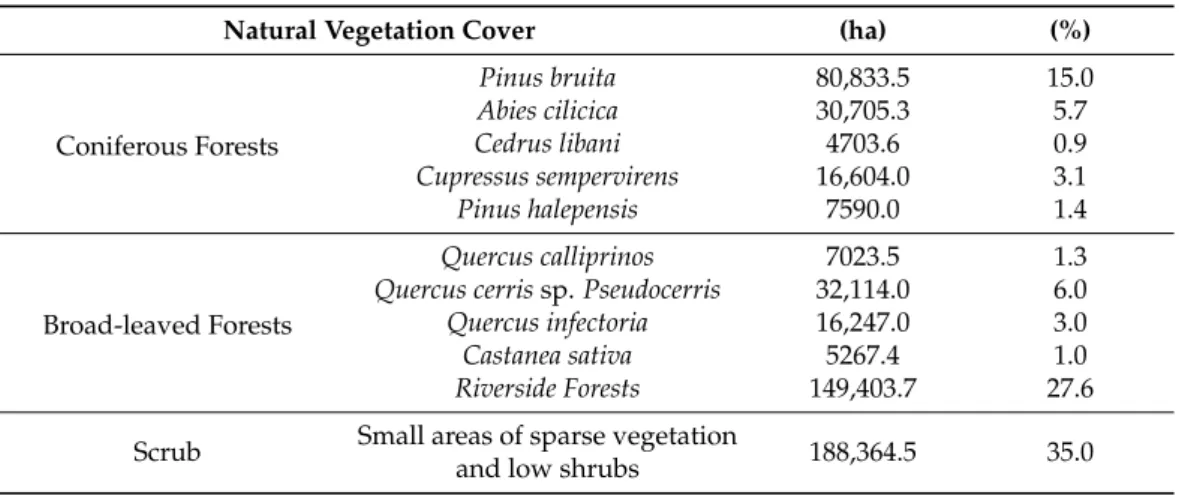
Forests in the Syrian coast region are Mediterranean forests, and their spread is often linked to climate and landforms [57,58]. These forests contain trees of various ages and sizes, the most important of which are broad-leaf trees such as oaks (Quercus) of all kinds, conifers such as Aleppo pine (Pinus halepensis), and turpentine trees (Pistacia palaestina), which cover 57%, 29% and 9% of the forest area, respectively, in addition to the juniper (Juniperus excelsa), cilician fir (Abies cilicica), and cedar (Cedrus libani) trees that form high- altitude forests in the region [57,58]. Figure4 shows the approximate distribution of main natural forests in the study area for the year 2010, which include evergreen forests (coniferous Forests) and moist deciduous forests (broad-leaved Forests). The natural non- forest vegetation consists of scrubs that include small areas of sparse vegetation and low shrubs [57–60]. Table1also shows the area of these forests in the study area.
Land 2021, 10, x FOR PEER REVIEW 5 of 26
Figure 3. Distribution of zones of influence in the Syrian coast region between the warring parties at the end of 2010 (a), 2015 (b), and 2020 (c) adapted from [56].
Forests in the Syrian coast region are Mediterranean forests, and their spread is often linked to climate and landforms [57,58]. These forests contain trees of various ages and sizes, the most important of which are broad-leaf trees such as oaks (Quercus) of all kinds, conifers such as Aleppo pine (Pinus halepensis), and turpentine trees (Pistacia palaestina), which cover 57%, 29% and 9% of the forest area, respectively, in addition to the juniper (Juniperus excelsa), cilician fir (Abies cilicica), and cedar (Cedrus libani) trees that form high- altitude forests in the region [57,58]. Figure 4 shows the approximate distribution of main natural forests in the study area for the year 2010, which include evergreen forests (conif- erous Forests) and moist deciduous forests (broad-leaved Forests). The natural non-forest vegetation consists of scrubs that include small areas of sparse vegetation and low shrubs [57–60]. Table 1 also shows the area of these forests in the study area.
Figure 4. Natural vegetation cover in the Syrian coast region for 2010 adapted from [57–60].
Figure 4.Natural vegetation cover in the Syrian coast region for 2010 adapted from [57–60].
Table 1.Area of main natural forests in hectares (ha) and percentage share (%) in 2010.
Natural Vegetation Cover (ha) (%)
Coniferous Forests
Pinus bruita 80,833.5 15.0
Abies cilicica 30,705.3 5.7
Cedrus libani 4703.6 0.9
Cupressus sempervirens 16,604.0 3.1
Pinus halepensis 7590.0 1.4
Broad-leaved Forests
Quercus calliprinos 7023.5 1.3
Quercus cerrissp.Pseudocerris 32,114.0 6.0
Quercus infectoria 16,247.0 3.0
Castanea sativa 5267.4 1.0
Riverside Forests 149,403.7 27.6
Scrub Small areas of sparse vegetation
and low shrubs 188,364.5 35.0
3. Materials and Methods 3.1. Data Source
Landsat satellite images were used to detect temporal and spatial changes of forest cover as well as to map the distribution and density of this cover in the study area be- tween 2010 and 2020. For this purpose, Landsat-5 thematic mapper (TM) and Landsat-8 Operational Land Imager (OLI) images for the three target years 2010, 2015, and 2020 were obtained from the official website of the US Geological Survey (USGS) [61]. Landsat images, which have a spatial resolution of 30 m, have spectral properties suitable for detecting changes in LULC [22,27,47,62,63]. Details of the Landsat images used in this study are shown in Table2. To improve detection of changes in forest cover during the classification, Landsat images captured in the dry season were chosen because the increase in vegeta- tive surface cover in the growing season may lead to spectral confusion, which creates a complication in distinguishing among the various land use categories on the classified images [7,15], especially since the study area contains several tree crops (olives and fruit tree plantations) that are planted on the terraced hillsides [51]. The selected Landsat images were also completely free of clouds to reduce the effect of atmospheric attenuation and water vapor content on land use classification [7,51]. The selection of Landsat images during this period of the year also took into account the forest fires that broke out at the beginning of the dry season in the forests of the Syrian coast, especially the frequent fires that occurred on a large scale in the late summer of 2020 [64]. ASTER DEM from NASA Earth data [46], which closely matches Landsat images in terms of georeferencing and spatial resolution, was used to derive both parameters (elevation and slope) in the study area. Elevation (in meters above sea level) was obtained directly from the ASTER-DEM.
Slope (percent rise) was calculated from all eight neighbor of pixels of the ASTER-DEM using the custom functions in ArcGIS. Population data for all districts within the five governorates of the study area were obtained from official statistical records as well as from demographic and health surveys conducted by international organizations [55,65–67].
These demographic and topographic data were used to produce variables for the spatial regression model to analyze the factors associated with the spatial extent dynamics of the forest cover in the study area. Due to the ongoing conflict in Syria, it was not possible to conduct field observations in the study area to collect ground truth data relevant to ascertain the accuracy of the classification and the accuracy of the forest cover maps that were created for the study area. Therefore, the supplementary data was used as external inputs in the post-classification phase, which was sufficient to determine the characteristics of the natural environment and land use in the study area [51]. These data included high resolution Google-Earth archive data and topographic maps in scales ranging from 1:25,000 to 1:1,50,000. In order to identify the types of forests and their distribution in the study area, data of previous studies on vegetation cover in the Syrian coast region were used [57–60].
These studies dealt with the distribution of the main tree species of the studied forests at different levels according to the elevation within the different landscapes.
Table 2.Details of the Landsat images and bands used in the classification and analysis [61].
Landsat Sensor Scene Path-Row Date of Acquisition
(yyyy/mm/dd) Spatial Resolution
Standard False Color Composite
Bands
Bands for Visual
Interpretation Spectral Bands (µm)
TM 2010 174/35
174/36
2010/08/29
2010/08/29 30×30 m 5-4-3 4-5-3
Band 3 = Red (0.63–0.69), Band 4 = NIR (0.76–0.9),
Band 5 = SWIR (1.55–1.75)
OLI 2015 174/35
174/36
2015/09/12
2015/09/12 30×30 m 6-5-4 5-6-4 Band 4 = Red
(0.630–0.680), Band 5 = NIR (0.845–0.885), Band 6 = SWIR 1 (1.560–1.660)
OLI 2020 174/35
174/36
2020/09/09
2020/09/09 30×30 m 6-5-4 5-6-4
3.2. Image Processing, Classification, and Change Detection
Although Landsat images are geometrically and radiometrically corrected by USGS [61], changes in the spectral characteristics of surface features due to different atmospheric conditions in a humid climate can cause difficulties in applying the pixel- based classification [15,51,68,69]. Therefore, pre-processing of the Landsat images was performed, which included geometric correction, atmospheric correction and radiomet- ric processing [70,71]. Landsat images were pre-processed individually using ENVI 5.3 software, where these correction procedures have corresponding operation modules in the toolbox. The study area was then clipped from Landsat images for each study year using ArcGIS 10.5 The color combinations of Landsat imagery bands were also chosen, which take into account the contrast and distinction between different land uses, especially vegetation formations (band 5-4-3 as RGB for Landsat 5 TM and band 6-5-4 as RGB for Landsat 8 OLI) [3].
A supervised classification method using the maximum likelihood classifier (MLC) algorithm was applied using ArcGIS 10.5 for Landsat images classification purpose in the study area. This classification method is known for its strong theoretical basis and its ability to accommodate changing spectral signatures of different land uses [27]. This classification algorithm also achieved the best results for the purposes of classifying land uses in sub- humid and humid areas as comparable environments using similar data [3,13,15,20,47,72].
Training samples for the classifier were obtained using visual interpretation from high resolution Google Earth data and Normalized Difference Vegetation Index (NDVI) images to compare with the color combination chosen for the Landsat image bands. These samples were selected independently for each image in accordance with the size and location of the land use classes within the study area [47,68]. This ensures, as far as possible, to obtain different spectral signatures that represent all categories of land use. These categories and their description are given in Table3. After classification, the Majority Filter (3×3 pixels) tool was applied in ArcGIS to smooth and remove noise in the classification categories known as the “salt and pepper” effect [15,73]. Then, based on the number of pixels, the area of each LULC class was extracted.
Accuracy assessment is an important step during the classification because it reflects the real difference between the results of the Landsat image classification and the reference data (ground truth points) [3,13,27,73]. Accordingly, a confusion matrix was applied to the classified images to calculate and compare the user’s accuracy (UA), producer’s accuracy (PA) and the overall accuracy [27,74,75]. For this purpose, a stratified random sampling approach was taken by allocating sample points in each category of LULC [9,51]. Therefore, for each classified image, 500 random validation points outside the training areas were selected based on the minimum sample size for each stratum, which is 20 points [9,51,76].
Thus, the number of points identified in each category matches the relative size of the corresponding land use category. The exception was the number of water body samples due to the unique and identifiable spectral signature. The ground truth status of these
validation points was examined and evaluated by comparing the land use classification results with high-resolution Google Earth images, which correspond to the date (±10 days) of the Landsat image, the accuracy was then calculated for each category of LULC. LULC classification results can contain uncertainties that can mainly result from classification errors, homogeneity, and autocorrelations within the classifier training samples and classi- fication accuracy assessment samples chosen during the manual preparation induced by the interpreter [77–79]. Therefore, in order to improve the interpretation of classification results and the error matrix, error-adjusted area estimates and confidence intervals at the 95% level as well as adjusted accuracy values were calculated according to the statistical approach recommended by Olofsson et al. (2013, 2014) [79,80]. Based on the adjusted area estimates, the change in LULC categories was detected by comparing the classification results for the three target years.
Table 3.Detailed description of land use/cover types in the Syrian coast region [51].
LULC Type Description
Urban and peri-urban areas
Built-up areas and settlements (cities, villages), non-built-up areas (open structures related to human activities, such as quarries and permanent and temporary military zones)
Cultivated areas
Areas cultivated with crops: horticultural crops (fruit-tree plantations, field and vegetable crops grown on small plots receiving intensive inputs), tree crops (olive grove areas),
non-irrigated crops (mostly rainfed winter/spring field crops).
Forest and other wooded areas
Undifferentiated coniferous and broadleaf, deciduous and evergreen, forest areas, scrubland, and degraded forest, often interspersed with tree crops
Bare areas with or without sparse grasslands Unvegetated land, exposed rocks and burnt out areas
Water bodies Freshwater lakes and reservoirs, rivers
To map the forest cover in the study area, the categories of land use were reclassified using ArcGIS on all classified Landsat images, where the category of forest cover was assigned to values of “1”, and all other land use categories were integrated into one category “non-forest”, which was assigned to “0” values [3,15]. The Normalized Difference Vegetation Index (NDVI) is the most widely used for vegetation detection, particularly to distinguish vegetation from non-vegetation areas [81–83]. This index is also used to determine the density of forest/vegetation cover in relation to the reflectance values of the visible (RED) and near infrared bands (NIR) [20,33,81]. Landsat images of the study area for the years 2010, 2015 and 2020 were reclassified based on measured NDVI threshold values to extract three categories of forest cover density: NDVI < 0.1: dispersed forest and shrubs, 0.2 < NDVI < 0.4: open forest, 0.4 < NDVI < 0.74: dense forest. This NDVI-based classification corresponds to the supervised classification of forest cover based on Landsat imagery. The visual interpretation based on high resolution Google Earth images and the available data on the forest cover of the study area was used to determine the main forest cover types that correspond to the density classes [57–60].
3.3. Variables Acquisition Related to Drivers of Change in Forest Cover
In order to implement proximate drivers of forest cover change in the study area and to determine their relationship to the observed changes obtained from classified Landsat images, the physical and socio-spatial model was used as proposed by Wilson et al. (2013) [84]. In this model, the spatial regression was applied using the ordinary least squares (OLS) in ArcGIS for the preparation of non-stationary variables at the level of small administrative units (districts) within the five governorates of the study area as a first step.
The second step was to apply geographically weighted regression (GWR), a local form of linear regression. This model allows for a spatial analysis of the independent/explanatory variables (physical and socio-demographic variables) and the identification of spatially varying local relationships between these variables and the spatial extent of forest cover.
The following equation shows the construction of the GWR technique used in linear form, which allows the inclusion of specific explanatory variables as parameters related to specific coordinates of their dispersion in spatial extents of land uses [84]. This technique is fully described by Krivoruchko (2001) [85].
Y(g,r) =β0(g,r) +β1(g,r)X1+β2(g,r)X2+ . . . +βn(g,r)Xn+ε (1) where Y(g,r) is the dependent variable (class of forest cover) at specific coordinates g and r (location of districts within each governorate). This variable describes the linear relationship between forest cover extent and explanatory variables.β0,β1,β2andβnare the parameters to be derived at coordinates (g,r) for every location. X1, X2, and Xnrepresent the explanatory covariates andεis the random error term.
A total of eight socio-demographic variables influenced by the availability of relevant data for the study area under the conflict were analyzed as drivers of change in forest cover (Table4). Information on socio-demographic variables can provide indicators of changes in forest cover resulting from specific human activities such as shifting cultivation (slope cultivation), logging and burning of native forests, and urban expansion [22,84], especially since Syria is witnessing an intense conflict, as the risks of forest exploitation increase due to weak state management and protection of forest resources. Topographic parameters such as elevation and slope can provide indicators of people’s access to forests or conversion of forest lands into other uses as farming (plantations) and acquisition for construction [22]. Slope is also a controlling factor in land surface processes because it affects soil properties and water content in addition to the potential for erosion of forest lands located on steep slopes or high altitudes [22,86].
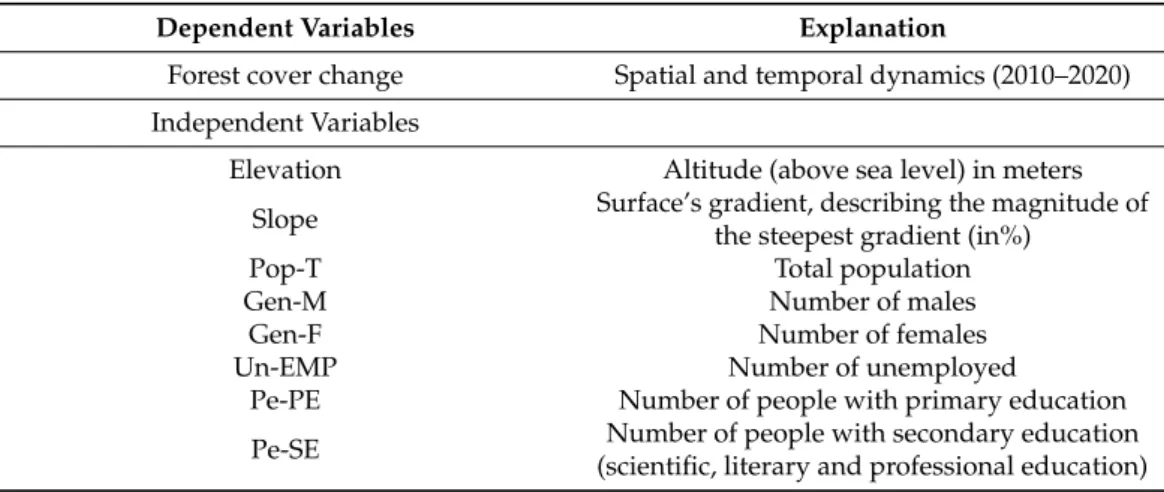
Table 4.A summary of the physical and socio-demographic variables as explanatory variables used in geographically weighted regression for changes tracking in forest cover in the Syrian coast region.
Dependent Variables Explanation
Forest cover change Spatial and temporal dynamics (2010–2020) Independent Variables
Elevation Altitude (above sea level) in meters
Slope Surface’s gradient, describing the magnitude of the steepest gradient (in%)
Pop-T Total population
Gen-M Number of males
Gen-F Number of females
Un-EMP Number of unemployed
Pe-PE Number of people with primary education
Pe-SE Number of people with secondary education
(scientific, literary and professional education)
The dataset on these independent variables were examined statistically to reveal whether the data is skewed and if there are unusual observations (outliers) that cause unstable estimates and inaccurate variations in the linear relationship between these variables [22,86]. No outliers were found, thus these variables can be analyzed spatially within the applied spatial model.
Given the state of conflict and the fluctuating politico-military situation in Syria, it was not possible to obtain statistical data on the number of combatants to the parties to the conflict. As a result, the data of these actors were not statistically included in forest cover changes in the applied model. However, by tracking the course of the field situation of the conflict and the changes in the areas of control between the warring parties and estimating the numbers and movements of these fighters, it was possible to gain an understanding of their impact on forest cover in the study area.
Another important variable that has a major influence on the change of forest cover in the study area is forest fires. The rate of forest cover loss appeared to have risen sharply after 2011 due to an increase in the number of forest fires [64]. To monitor and map the burned areas during the study period, the spectral signature of burned forest areas was determined on Landsat images. Using the re-classify tool available in ArcGIS 10.5, the burned areas were assigned to the values of “1”, while the pixels of all other LULC categories were merged into one category and assigned to the values of “0” [3,15,27]. Manual interpretation with the help of high-resolution Google Earth imagery and the NDVI values was used to improve the accuracy of the resulting maps.
4. Results
4.1. Classification Accuracy Assessment
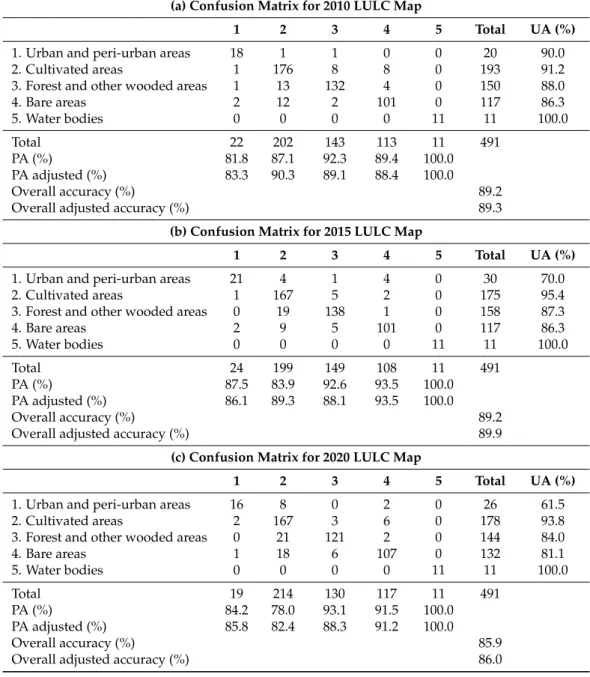
Accuracy assessment was systematically performed for each classified Landsat image (Table 5). The adjusted overall accuracy was in the final classification maps of LULC about 89% in 2010, 90% in 2015, and 86% in 2020. A standard overall accuracy for LULC classification is known to be between 75% [3,87] and 90% [88]. Nevertheless, the results of the classification accuracy assessment indicate that it is impossible to separate all types of LULC in the study area. This could be caused by confusion represented by an increase in errors of omission and commissions in cultivated lands, especially those planted with tree crops (fruit tree plantations), which in some cases have been confused with the forest class of lower elevations (dispersed forest and shrubs). In addition, low spectral separation of bare areas can lead to mixed-pixel problems on Landsat images and thus to errors in the classification results. This is reflected in the PA of bare areas classification.
The water bodies category obtained the highest PA results (100%) for all target years due to its distinctive spectral signature on Landsat images. In general, urban areas showed the lowest PA (85%) on average for the study years. PA for forest category was above 88% in all years of study. Due to the somewhat limited resolution of Landsat imagery, open structures for human activities, such as quarries and military sites, were mostly misclassified as bare areas.
Table 5.Confusion matrices containing the accuracy assessment of the classified LULC categories using a stratified sample for the years 2010, 2015, and 2020. Here, producer’s accuracy is PA and user’s accuracy is UA.
(a) Confusion Matrix for 2010 LULC Map
1 2 3 4 5 Total UA (%)
1. Urban and peri-urban areas 18 1 1 0 0 20 90.0
2. Cultivated areas 1 176 8 8 0 193 91.2
3. Forest and other wooded areas 1 13 132 4 0 150 88.0
4. Bare areas 2 12 2 101 0 117 86.3
5. Water bodies 0 0 0 0 11 11 100.0
Total 22 202 143 113 11 491
PA (%) 81.8 87.1 92.3 89.4 100.0
PA adjusted (%) 83.3 90.3 89.1 88.4 100.0
Overall accuracy (%) 89.2
Overall adjusted accuracy (%) 89.3
(b) Confusion Matrix for 2015 LULC Map
1 2 3 4 5 Total UA (%)
1. Urban and peri-urban areas 21 4 1 4 0 30 70.0
2. Cultivated areas 1 167 5 2 0 175 95.4
3. Forest and other wooded areas 0 19 138 1 0 158 87.3
4. Bare areas 2 9 5 101 0 117 86.3
5. Water bodies 0 0 0 0 11 11 100.0
Total 24 199 149 108 11 491
PA (%) 87.5 83.9 92.6 93.5 100.0
PA adjusted (%) 86.1 89.3 88.1 93.5 100.0
Overall accuracy (%) 89.2
Overall adjusted accuracy (%) 89.9
(c) Confusion Matrix for 2020 LULC Map
1 2 3 4 5 Total UA (%)
1. Urban and peri-urban areas 16 8 0 2 0 26 61.5
2. Cultivated areas 2 167 3 6 0 178 93.8
3. Forest and other wooded areas 0 21 121 2 0 144 84.0
4. Bare areas 1 18 6 107 0 132 81.1
5. Water bodies 0 0 0 0 11 11 100.0
Total 19 214 130 117 11 491
PA (%) 84.2 78.0 93.1 91.5 100.0
PA adjusted (%) 85.8 82.4 88.3 91.2 100.0
Overall accuracy (%) 85.9
Overall adjusted accuracy (%) 86.0
4.2. Change in LULC between 2010 and 2020
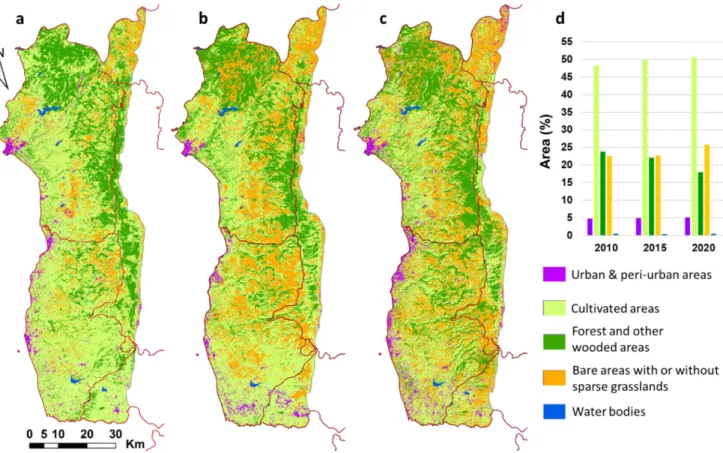
The LULC classification results for the study area are represented in Figure5as well as the corresponding LULC data in Table6. Table7also shows the amount of conversion of LULC classes from one class to another. The analysis of land use changes in the study area between 2010 and 2020 is based on the results of the adjusted area estimates calculated for the spatial extent of the LULC categories, also taking into account the 95% confidence intervals. Analysis of LULC change shows great variation in the size and direction of land use over the study period. The most notable changes were the continuous increase in cultivated areas, bare areas, and urban areas, while there was a continuous decrease in the forest cover. Statistical analysis indicates that the cultivated area was the dominant form of land use in 2010, which represented 48.3% of the study area (260,370.1±10,624 ha), followed by forest cover (128,303.7 ± 7648.0 ha, 23.8% of the study area), bare areas (121,833.8±7284 ha, 22.6% of the study area), and urban areas (25,920.4 ± 4163.0 ha, 4.8% of the study area). By the year 2015, the spatial extent of cultivated lands, bare
Land2021,10, 191 12 of 26
areas and urban areas increased to 268,627.0± 12,772.0 ha (49.9% of the study area), 122,495.0±10,164.0 ha (22.7% of the study area), and 26,653.0±9741.5 ha (4.9% of the study area), respectively, while forest cover decreased to 119,167.0±10,644.0 ha (22.1% of the study area). Water bodies did not change considerably in comparison to other LULC types. In 2010, the water bodies amounted to 2427.6±365.0 ha (0.5% of the study area).
The area covered by rivers, ponds, and lakes decreased to 1914.0±376.0 ha by 2015, but subsequently increased to 2431.2±353 ha by 2020.
in cultivated areas, bare areas, and urban areas, while there was a continuous decrease in the forest cover. Statistical analysis indicates that the cultivated area was the dominant form of land use in 2010, which represented 48.3% of the study area (260370.1 ± 10624 ha), followed by forest cover (128303.7 ± 7648.0 ha, 23.8% of the study area), bare areas (121833.8 ± 7284 ha, 22.6% of the study area), and urban areas (25920.4 ± 4163.0 ha, 4.8%
of the study area). By the year 2015, the spatial extent of cultivated lands, bare areas and urban areas increased to 268627.0 ± 12772.0 ha (49.9% of the study area), 122495.0 ± 10164.0 ha (22.7% of the study area), and 26653.0 ± 9741.5 ha (4.9% of the study area), respectively, while forest cover decreased to 119167.0 ± 10644.0 ha (22.1% of the study area). Water bodies did not change considerably in comparison to other LULC types. In 2010, the water bodies amounted to 2427.6 ± 365.0 ha (0.5% of the study area). The area covered by rivers, ponds, and lakes decreased to 1914.0 ± 376.0 ha by 2015, but subsequently increased to 2431.2 ± 353 ha by 2020.
Figure 5. LULC in the Syrian coast region for 2010 (a), 2015 (b), and 2020 (c). The area (in %) of LULC categories after computing adjusted area estimates is given in (d).
Table 6. Area estimates in hectares (ha) and percentage share (%) of each LULC category between
2010 and 2020 (after computing adjusted area estimate).
(a) Area Estimate for 2010 LULC Category Area Calculated
Based on Pixels
Adjusted Area Estimate
Adjusted Area of Total Area
Confidence Interval (±) 1. Urban and peri-urban ar-
eas 23984.8 25920.4 4.8% 4163.0
2. Cultivated areas 257832.1 260370.1 48.3% 10624.0
3. Forest and other wooded
areas 129869.0 128303.7 23.8% 7648.0
4. Bare areas 124742.0 121833.8 22.6% 7284.0
5. Water bodies 2427.6 2427.6 0.5% 365.0
(b) Area Estimate for 2015
Figure 5.LULC in the Syrian coast region for 2010 (a), 2015 (b), and 2020 (c). The area (in %) of LULC categories after computing adjusted area estimates is given in (d).
Table 6. Area estimates in hectares (ha) and percentage share (%) of each LULC category between 2010 and 2020 (after computing adjusted area estimate).
(a) Area Estimate for 2010 LULC Category Area Calculated Based
on Pixels
Adjusted Area Estimate
Adjusted Area of Total Area
Confidence Interval (±) 1. Urban and
peri-urban areas 23,984.8 25,920.4 4.8% 4163.0
2. Cultivated areas 257,832.1 260,370.1 48.3% 10,624.0
3. Forest and other
wooded areas 129,869.0 128,303.7 23.8% 7648.0
4. Bare areas 124,742.0 121,833.8 22.6% 7284.0
5. Water bodies 2427.6 2427.6 0.5% 365.0
(b) Area Estimate for 2015 LULC Category Classified Map Area Adjusted Area
Estimate
Adjusted Area of Total Area
Confidence Interval (±) 1. Urban and
peri-urban areas 32,773.1 26,653.0 4.9% 9741.5
2. Cultivated areas 252,772.2 268,627.0 49.9% 12,772.0
3. Forest and other
wooded areas 118,775.5 119,167.0 22.1% 10,644.0
4. Bare areas 132,620.5 122,495.0 22.7% 10,164.0
5. Water bodies 1914.2 1914.0 0.4% 376.0
(c) Area Estimate for 2020 LULC category Classified Map Area Adjusted Area
Estimate
Adjusted Area of Total Area
Confidence Interval (±) 1. Urban and
peri-urban areas 38,138.5 27,359.4 5.1% 8500.0
2. Cultivated areas 239,787.4 272,907.5 50.6% 15,488.0
3. Forest and other
wooded areas 100,714.5 97,188.6 18.0% 9781.0
4. Bare areas 157,783.9 138,968.8 25.8% 12,875.0
5. Water bodies 2431.2 2431.2 0.5% 353.0
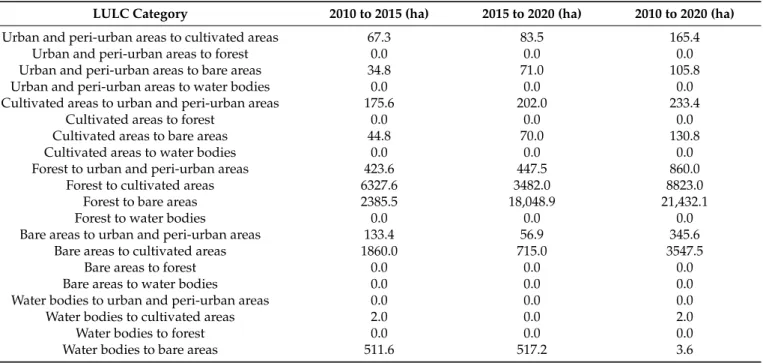
Table 7.Net LULC transitions (in ha) between 2010 and 2020.
LULC Category 2010 to 2015 (ha) 2015 to 2020 (ha) 2010 to 2020 (ha)
Urban and peri-urban areas to cultivated areas 67.3 83.5 165.4
Urban and peri-urban areas to forest 0.0 0.0 0.0
Urban and peri-urban areas to bare areas 34.8 71.0 105.8
Urban and peri-urban areas to water bodies 0.0 0.0 0.0
Cultivated areas to urban and peri-urban areas 175.6 202.0 233.4
Cultivated areas to forest 0.0 0.0 0.0
Cultivated areas to bare areas 44.8 70.0 130.8
Cultivated areas to water bodies 0.0 0.0 0.0
Forest to urban and peri-urban areas 423.6 447.5 860.0
Forest to cultivated areas 6327.6 3482.0 8823.0
Forest to bare areas 2385.5 18,048.9 21,432.1
Forest to water bodies 0.0 0.0 0.0
Bare areas to urban and peri-urban areas 133.4 56.9 345.6
Bare areas to cultivated areas 1860.0 715.0 3547.5
Bare areas to forest 0.0 0.0 0.0
Bare areas to water bodies 0.0 0.0 0.0
Water bodies to urban and peri-urban areas 0.0 0.0 0.0
Water bodies to cultivated areas 2.0 0.0 2.0
Water bodies to forest 0.0 0.0 0.0
Water bodies to bare areas 511.6 517.2 3.6
4.3. Spatial Patterns of Forest Cover Change (2010–2020)
The results of the analysis of forest cover changes indicate that forest cover decreased by 1830.0 ha per year between 2010 and 2015, and its spatial extent continued to decrease by 4400.0 ha per year between 2015 and 2020 (Figure6and Table4). In general, over the past ten years, the forest cover in the study area showed a declining trend by 3112.0 ha/year.
This decrease in forest cover was at the expense of the expansion of agricultural land and the increase of bare areas (Table7).
Table8, Table9, and Figure7show the spatial and temporal dynamics of forest cover density for 2010, 2015, and 2020. The spatial distribution map of forest cover density for 2010 indicates that dense forest areas (30,117.8 ha) are mainly located in the north and east of the study area in the Lattakia Governorate, where coniferous forests and mixed deciduous forests predominate, while open forests (32,600.3 ha) are located in the east of the study area in the governorates of Latakia and Hama (Figure7, Figure4). The dispersed forests and shrubs (65,585.6 ha) are distributed in the center, central east and southeast of the study area in the governorates of Hama and Tartous, which consist of riverside forests, Pinus bruitaforests, andAbies cilicicaforests.
Analysis of change in forest cover density revealed that between 2010 and 2020, a total of 11778.3 ha (9.2% of the forest cover) of dense forests degraded into open forests at a rate of 1177.8 ha/year (Tables8and9). These dense forests can only be found in remote areas such as isolated mountain peaks or on infertile soil substrates in the mountains between Hama and Lattakia governorates. The results of the detection of changes also indicate that there was an increase in open forests during the study period. Open forests increased by about 1463.0 ha/year between 2010 and 2020. This increase in open forests, which reached 14,633.4 hectares (11.4%) by 2020, was at the expense of degradation of dense forests. The results of the forest cover density classification also showed that dispersed forests recorded a significant decrease between 2010 and 2015, reaching 43,707.7 ha in 2015 (36.7% of the forest cover). The decline of dispersed forests continued between 2015 and 2020, covering about 31,615.5 ha (32.5% of the forest cover) in 2020 (Tables8and9). Although there was an increase in the total open forests due to thinning of dense forests in the study area, at the same time an area of about 2855.0 hectares (2.2%) of scattered forests and shrubs that were changed into open forests was found during the study period. The degradation of dispersed forests increased with the increase in bare areas and cultivated lands.
Land2021,10, 191 15 of 26
past ten years, the forest cover in the study area showed a declining trend by 3112.0 ha/year. This decrease in forest cover was at the expense of the expansion of agricultural land and the increase of bare areas (Table 7).
Table 8, Table 9, and Figure 7 show the spatial and temporal dynamics of forest cover density for 2010, 2015, and 2020. The spatial distribution map of forest cover density for 2010 indicates that dense forest areas (30,117.8 ha) are mainly located in the north and east of the study area in the Lattakia Governorate, where coniferous forests and mixed decid- uous forests predominate, while open forests (32,600.3 ha) are located in the east of the study area in the governorates of Latakia and Hama (Figure 7, Figure 4). The dispersed forests and shrubs (65,585.6 ha) are distributed in the center, central east and southeast of the study area in the governorates of Hama and Tartous, which consist of riverside forests, Pinus bruita forests, and Abies cilicica forests.
Analysis of change in forest cover density revealed that between 2010 and 2020, a total of 11778.3 ha (9.2% of the forest cover) of dense forests degraded into open forests at a rate of 1,177.8 ha/year (Tables 8 and 9). These dense forests can only be found in remote areas such as isolated mountain peaks or on infertile soil substrates in the mountains be- tween Hama and Lattakia governorates. The results of the detection of changes also indi- cate that there was an increase in open forests during the study period. Open forests in- creased by about 1,463.0 ha/year between 2010 and 2020. This increase in open forests, which reached 14,633.4 hectares (11.4%) by 2020, was at the expense of degradation of dense forests. The results of the forest cover density classification also showed that dis- persed forests recorded a significant decrease between 2010 and 2015, reaching 43,707.7 ha in 2015 (36.7% of the forest cover). The decline of dispersed forests continued between 2015 and 2020, covering about 31,615.5 ha (32.5% of the forest cover) in 2020 (Tables 8 and 9). Although there was an increase in the total open forests due to thinning of dense forests in the study area, at the same time an area of about 2855.0 hectares (2.2%) of scattered forests and shrubs that were changed into open forests was found during the study pe- riod. The degradation of dispersed forests increased with the increase in bare areas and cultivated lands.
Figure 6. Distribution of changes in forest cover in the Syrian coast region from 2010–2015 (a), 2015–2020 (b), and 2010–2020 (c).
Table 8.Area (ha) and proportion (%) of forest cover classified by density in the study area from 2010 to 2020 region (after computing adjusted area estimates).
Forest Class Stand 2010 Stand 2015 Stand 2020
Area (ha) % Area (ha) % Area (ha) %
Dense forest 30,117.8 23.5 27,180.4 22.8 18,339.5 18.9
Open forest 32,600.3 25.4 48,278.1 40.5 47,233.7 48.6
Dispersed forest and shrubs 65,585.6 51.1 43,707.7 36.7 31,615.5 32.5
Total 128,303.7 100.0 119,167.0 100.0 97,188.6 100.0
Table 9.Change trend of forest cover by density and the gain–loss rate in the Syrian coast region from 2010 to 2020 (after computing adjusted area estimate).
Forest Class 2010–2015 2015–2020 Total (2010–2020)
Area (ha) Area (%) Rate (ha2year1) Area (ha) Area (%) Rate (ha2year1) Area (ha) Area (%) Rate (ha2year1)
Dense forest −2937.4 −2.3 −587.5 −8840.9 −7.4 −1768.2 −11,778.3 −9.2 −1177.8
Open forest 15,677.8 12.2 3135.6 −1044.4 −0.9 −208.9 14,633.4 11.4 1463.3
Dispersed forest
and shrubs −21,877.9 −17.1 −4375.6 −12,092.2 −10.1 −2418.4 −33,970.1 −26.5 −3397.0
Total −9136.7 −7.2 −1827.3 −21,978.4 −18.4 −4395.7 −31,115.1 −24.3 −3111.5
Land2021,10, 191 16 of 26
Figure 6. Distribution of changes in forest cover in the Syrian coast region from 2010–2015 (a), 2015–
2020 (b), and 2010–2020 (c).
Table 8. Area (ha) and proportion (%) of forest cover classified by density in the study area from 2010 to 2020 region (after computing adjusted area estimates).
Forest Class Stand 2010 Stand 2015 Stand 2020
Area (ha) % Area (ha) % Area (ha) % Dense forest 30117.8 23.5 27180.4 22.8 18339.5 18.9
Open forest 32600.3 25.4 48278.1 40.5 47233.7 48.6 Dispersed forest and shrubs 65585.6 51.1 43707.7 36.7 31615.5 32.5 Total 128303.7 100.0 119167.0 100.0 97188.6 100.0
Table 9. Change trend of forest cover by density and the gain–loss rate in the Syrian coast region from 2010 to 2020 (after computing adjusted area estimate).
Forest Class
2010-2015 2015-2020 Total (2010-2020)
Area$(ha )
Area$
(%)
Rate$(ha2 year1)
Area$(ha )
Area$
(%)
Rate$(ha2 year1)
Area$(ha )
Area$
(%)
Rate$(ha2 year1) Dense forest −2937.4 −2.3 −587.5 −8840.9 −7.4 −1768.2 −11778.3 −9.2 −1177.8
Open forest 15677.8 12.2 3135.6 −1044.4 −0.9 −208.9 14633.4 11.4 1463.3 Dispersed forest
and shrubs −21877.9 −17.1 −4375.6 −12092.2 −10.1 −2418.4 −33970.1 −26.5 −3397.0 Total −9136.7 −7.2 −1827.3 −21978.4 −18.4 −4395.7 −31115.1 −24.3 −3111.5
Figure 7. Changes in forest cover density in the study area for 2010 (a), 2015 (b), and 2020 (c).
4.4. Variables Analysis Associated with Forest Cover Changes
Figure 7.Changes in forest cover density in the study area for 2010 (a), 2015 (b), and 2020 (c).
4.4. Variables Analysis Associated with Forest Cover Changes
Figure8shows the results of the spatial regression analysis between the extent of forest cover and the physical and socio-demographic variables during the study period.
The spatial regression model for 2010 show a moderate correlation between forest cover and all socio-demographic variables (R2= 0.67) as well as elevation (R2= 52), while the regression equation indicated a strong correlation with slope (R2= 76). Spatial regression analysis revealed a stronger determination coefficient between the spatial extent of forest cover and slope for the year 2020 (R2= 73) which is represented by a strong relationship compared to the year 2015 (R2= 69) which showed a moderate relationship, while the value of the coefficient of determination of the relationship between the spatial extent of forest cover and elevation for 2015 (R2= 55) is almost identical to the value recorded in the 2020 model that represents a moderate relationship (R2= 52). It is evident from this that both elevation and slope were significantly related to the possibility of a decrease in the forest cover in the study area.
Figure 8. The relationship between forest cover extent and physical variables (a) and socio-demo-
graphic variables (b) between 2010 and 2020 in the Syrian coast region. Where Pop-T is total popu- lation, Gen-M is males, Gen-F is females, Un-EMP is unemployed, Pe-PE is primary education, and Pe-SE is secondary education.
The results of the detection of burned forest areas indicate that the burned area ex- panded significantly from 12,177.0 ha (9.5% of the forest area) in 2015 to 26,161.0 ha (20.0%) in 2020, while the burned area did not exceed 500 ha in 2010. The burned areas are mainly concentrated in the forests located in the north of the study area, which since 2011 have been subject to mutual control between the opposition forces in Idleb Governorate and the Syrian regime forces that control Lattakia Governorate (Figure 9).
Figure 8.The relationship between forest cover extent and physical variables (a) and socio-demographic variables (b) be- tween 2010 and 2020 in the Syrian coast region. Where Pop-T is total population, Gen-M is males, Gen-F is females, Un-EMP is unemployed, Pe-PE is primary education, and Pe-SE is secondary education.
By comparing the results of this correlation with the dynamics of forest change for the study area (Figure5), it is evident that the forest cover was subject to decline in areas with elevations from 121–589 m and slopes less than 2.1%, which in turn are associated with the effect of local people who use forest resources and the conversion of forest lands to agricultural areas in these areas. It was also found that the decline in forest cover was negatively related to all socio-demographic variables during the study period. An exception is the group of unemployed for the base year 2010. This means that there are activities at the local and regional levels related to the population, their economic situation and their educational level that have led to disturbances in forest cover, especially after the
![Figure 2. Slope (in %) derived from Advanced Spaceborne Thermal Emission and Reflection Radiometer (ASTER)-digital elevation model (DEM) [46] (a), topographical elevation above sea level in meter [46] (b), spatial pattern of average yearly rainfall adapt](https://thumb-eu.123doks.com/thumbv2/1library_info/5591711.1690772/4.892.87.808.522.811/advanced-spaceborne-emission-reflection-radiometer-elevation-topographical-elevation.webp)
![Figure 3. Distribution of zones of influence in the Syrian coast region between the warring parties at the end of 2010 (a), 2015 (b), and 2020 (c) adapted from [56]](https://thumb-eu.123doks.com/thumbv2/1library_info/5591711.1690772/5.892.259.759.144.453/figure-distribution-influence-syrian-region-warring-parties-adapted.webp)
![Table 2. Details of the Landsat images and bands used in the classification and analysis [61].](https://thumb-eu.123doks.com/thumbv2/1library_info/5591711.1690772/7.892.62.841.228.388/table-details-landsat-images-bands-used-classification-analysis.webp)
![Table 3. Detailed description of land use/cover types in the Syrian coast region [51].](https://thumb-eu.123doks.com/thumbv2/1library_info/5591711.1690772/8.892.253.839.416.757/table-detailed-description-cover-types-syrian-coast-region.webp)