Direct Observation of Ultrafast Exciton Formation in a Monolayer of WSe
2Philipp Steinleitner, Philipp Merkl, Philipp Nagler, Joshua Mornhinweg, Christian Schüller, Tobias Korn, Alexey Chernikov,* and Rupert Huber*
Department of Physics, University of Regensburg, 93040 Regensburg, Germany
*S Supporting Information
ABSTRACT: Many of the fundamental optical and electronic properties of atomically thin transition metal dichalcogenides are dominated by strong Coulomb interactions between electrons and holes, forming tightly bound atom-like states called excitons. Here, we directly trace the ultrafast formation of excitons by monitoring the absolute densities of bound and unbound electron−hole pairs in single monolayers of WSe2on a diamond substrate following femtosecond nonresonant optical excitation. To this end, phase- locked mid-infrared probe pulses and field-sensitive electro-optic sampling are used to map out the full complex-valued optical conductivity of the nonequilibrium system and to discern the hallmark low-energy responses of bound and unbound pairs. While the spectral shape of the infrared response immediately after above-bandgap injection is
dominated by free charge carriers, up to 60% of the electron−hole pairs are bound into excitons already on a subpicosecond time scale, evidencing extremely fast and efficient exciton formation. During the subsequent recombination phase, we stillfind a large density of free carriers in addition to excitons, indicating a nonequilibrium state of the photoexcited electron−hole system.
KEYWORDS: Dichalcogenides, atomically thin 2D crystals, exciton formation, ultrafast dynamics
A
tomically thin transition metal dichalcogenides (TMDCs) have attracted tremendous attention due to their direct bandgaps in the visible spectral range,1,2 strong interband optical absorption,3,4 intriguing spin-valley physics,5−7 and applications as optoelectronic devices.8−11The physics of two- dimensional (2D) TMDCs are governed by strong Coulomb interactions owing to the strict quantum confinement in the out-of-plane direction and the weak dielectric screening of the environment.12,13 Electrons and holes in these materials can form excitons with unusually large binding energies of many hundreds of millielectronvolts,14−19making these quasiparticles stable even at elevated temperatures and high carrier densities.20,21The properties of excitons in 2D TMDCs are a topic of intense research, investigating, for example, rapid exciton−exciton scattering,22 interlayer excitons,23 charged excitons and excitonic molecules,24,25 ultrafast recombination dynamics,19,26−28 or efficient coupling to light and lattice vibrations.4,19,29,30In many experiments, excitons are created indirectly through nonresonant optical excitation or electronic injection, which may prepare unbound charge carriers with energies far above the exciton resonance.8,18Subsequently, the electrons and holes are expected to relax toward their respective band minima and form excitons in the vicinity of the fundamental energy gap. In principle, strong Coulomb attraction in 2D TMDCs should foster rapid exciton formation. Recent optical pump−probe studies relying on interband transitions have reported characteristic formation times on subpicosecond time-scales.31 The relaxation of large excess energies, however, requires many scattering processes, which can lead to nonequilibrium carrier
and phonon distributions and, potentially, to a mixture of excitons and unbound electron−hole pairs. Hence the question of how excitons and free charge carriers evolve after above- bandgap excitation is of central importance for the fundamental understanding of 2D TMDCs.
Quantifying the densities of bound and unbound carrier populations has remained challenging for optical interband spectroscopy, because both species tend to induce similar modifications in the interband response. Conversely, terahertz and mid-infrared (mid-IR) probes may sensitively discriminate between bound and unbound states via characteristic spectral fingerprints of their low-energy elementary excitations.19,32−37 As schematically illustrated in Figure 1a, excitons efficiently absorb radiation in the spectral range of the intraexcitonic resonances, corresponding to dipole-allowed transitions from the exciton ground state (1s) to higher excited states (2p, 3p, 4p...), labeled in analogy to the hydrogen series. This absorption occurs irrespective of the exciton center-of-mass momentum and interband optical selection rules.19,33−38 In contrast, free electrons and holes feature a more inductive Drude-like response.32,33By using ultrabroadband electro-optic detection of the waveform of a few-cycle mid-IR probe pulse before and after the excitation of the electron−hole system, the energy-resolved intraband response, characterized by the real and imaginary part of the complex conductivity, can be traced on the femtosecond scale without resorting to a Kramers−
Received: October 21, 2016 Revised: December 21, 2016 Published: February 9, 2017
pubs.acs.org/NanoLett
Kronig analysis.32 Drude and Lorentzian signatures from unbound carriers and excitons, respectively, have been previously identified in bulk Cu2O34,38,39and GaAs quantum wells,33−36 among other material systems. Recently, this technique has become sensitive enough to probe the intra- excitonic transitions even in single atomically thin layers of TMDCs following direct optical injection of the excitons.19,37 The exciton formation, however, as well as the dynamics of unbound photoexcited charge carriers in a 2D TMDC has not been studied by direct low-energy probing so far, to the best of our knowledge.
Here, we employfield-sensitive mid-IR femtosecond probing to directly monitor the dynamics of photoexcited electron− hole pairs in the prototypical single-layer 2D TMDC WSe2. After highly nonresonant (excess energy∼1.4 eV) femtosecond interband excitation, the complex-valued mid-IR conductivity indicates a rapid carrier relaxation toward the respective band minima during thefirst hundreds of femtoseconds. Remarkably, more than half of the carriers are bound into excitons already 0.4 ps after the excitation. The ratio between excitons and unbound electron−hole pairs increases slightly in the subsequent 0.4 ps and both populations decay on a time scale of a few picoseconds while a significant fraction of free carriers is still observed after 5 ps, strongly indicating highly nonequilibrium conditions of the electron−hole system.
Our samples were prepared by mechanical exfoliation of WSe2bulk crystals (commercially acquired from HQgraphene) on viscoelastic substrates and were subsequently transferred onto diamond.40Monolayerflakes with typical diameters of the order of 100 μm were identified by photoluminescence and reflectance contrast spectroscopy. An overview of the basic experimental concept is schematically illustrated in the inset of Figure 1b. The samples were optically excited with 100 fs laser pulses (repetition rate: 0.4 MHz) centered at a photon energy of either 1.67 eV, for resonant creation of the 1s A exciton of WSe2, or 3.04 eV, for excitation far above the fundamental bandgap (see Supporting Information Figure S1). The pump fluence was set to 19 or 38 μJ/cm2 as detailed below. As a probe, we used a phase-locked mid-IR pulse (duration: 50 fs, fwhm), generated by optical rectification of the fundamental laser output in a 50μm thick AgGaS2crystal (see Supporting Information Figure S2). The probe spectrum covers a frequency window between 30 and 53 THz, encompassing the energy of the 1s-2p intraexcitonic transition of WSe2 monolayers at ∼170 meV (corresponding to a frequency of 41 THz).19For a given delay timetPP between pumping and probing, the complete electricfield waveform Eref(tEOS) of the transmitted probe pulse in absence of excitation as well as its pump-induced change ΔE(tEOS,tPP) was recorded electro- optically as a function of the detection time tEOS (see Figure 1.(a) Schematic illustration of the low-energy response of excitons and unbound electron−hole pairs. The dispersion relations are shown in the two-particle picture, corresponding to exciton states with the principal quantum numbersn = 1, 2, 3, and so forth, and the electron−hole continuum (topmost band), presented as a function of the center-of-mass momentumK. The yellow-shaded area represents the region of the light cone, where the excitons can be directly excited by photons due to momentum conservation. Red arrows schematically indicate relevant intraband excitation processes: (1) dipole-allowed transition between 1s and 2p excitons;nXdenotes the 1s population; (2) off-resonant excitation of unbound electron−hole pairs of densitynFC. (b) Typical optical interband absorption spectrum (black solid line) of the WSe2monolayer, see ref41. The black arrow marks the photon energy of 1.67 eV for resonant carrier injection, whereas the blue arrow denotes the photon energy used for nonresonant excitation at 3.04 eV. Inset: Schematic of the femtosecond optical-pump/mid-IR-probe experiment of single-layer WSe2on a diamond substrate. The mid-IR probe pulse (red) is delayed with respect to the optical pump pulse (blue) by a variable time delay. The electricfield of the probe is subsequently detected as a function of the electro-optic sampling delay time. (c) Calculated band structure of the WSe2monolayer from ref42. The black arrow highlights the fundamental transition for resonant carrier injection. A few possible transitions in case of the nonresonant excitation are roughly sketched by blue arrows.
Nano Letters
Supporting Information Figure S3). All experiments were performed at room temperature and ambient conditions. We note that the illumination of the sample with a photon energy of 3.04 eV introduced additional broadening and a small redshift of the exciton resonance. The exposure time was thus carefully chosen such that the characteristic intraexcitonic fingerprint was still observed at resonant excitation conditions after illumination with 3.04 eV photons (see Supporting InformationFigure S5 and S6 together with discussion).
In thefirst set of experiments, we tuned the pump photon energy to the interband absorption maximum corresponding to the 1s state of the A exciton41(Figure 1b, black arrow). The corresponding single-particle transitions occur at the K and K′ points of the Brillouin zone42 (Figure 1c). Figure 2a (upper
panel) shows the waveform of the transmitted probe pulse Eref(tEOS) in absence of excitation (black curve) together with the pump-induced change ΔE(tEOS, tPP = 75 fs) (red curve).
The observed phase shift ofΔEwith respect toErefof exactlyπ is already a hallmark of a dominantly absorptive response, as expected in the case of purely excitonic population.19,43This assignment is corroborated by the extracted changes in the real parts of the mid-IR conductivity (Δσ1) and the dielectric function (Δε1), presented in Figure 2a (lower panel) roughly corresponding to absorptive and inductive components,
respectively. In particular, a broad peak inΔσ1, centered at a photon energy ofℏω= 170 meV, combined with a dispersive shape of Δε1, crossing the zero-axis at the same energy, are characteristic of the intraexcitonic 1s−2p resonance in WSe2, as discussed in detail in ref19.
A qualitatively different picture is obtained for nonresonant excitation. The pump photon energy of 3.04 eV (Figure 1b, blue arrow) allows for carrier injection into higher-lying states of the WSe2 monolayer with a variety of possible electronic transitions across the Brillouin zone, as schematically illustrated inFigure 1c. This broad energy region is often chosen for the excitation in optical experiments due to the high absorption of the TMDC materials41and the availability of commercial laser sources in this spectral range. The differences to the situation after resonant excitation are already apparent in the electric field trace of the probe pulse, presented in Figure 2b (upper panel). The relative phase of ΔE(tEOS, tPP = 400 fs) deviates strongly from π and is closer to π/2, indicating the predominantly inductive response of an electron−hole plasma.43 The shape of the corresponding spectral features (Figure 2b, lower panel) is in stark contrast to the observations for resonant injection. Instead of a peak,Δσ1is now spectrally flat, accompanied by a negative, monotonically increasing Δε1
across the experimentally accessible energy range. This shape is characteristic of the Drude-like behavior of free charge carriers.32,33,36,43
For a quantitative analysis of the measured spectra, we apply a phenomenological Drude−Lorentz model.36,43 Within this approach, pump-induced changes in the frequency-dependent dielectric function Δε(ω) = Δε1 + iΔσ1/(ε0ω) are described using two components
ε ω ε μ ω ω ε μ ω ω
Δ = ×
− − Δ
− ×
+ Γ
ℏ
n e d
f i
n e
d i
( ) 1
E X2
0
1s,2p 2
FC2
0 2
res2 2
(1) The first term, a Lorentzian resonance, accounts for the intraexcitonic 1s−2p absorption. It includes the 1s exciton density nX, the corresponding reduced mass μ= memh/(me + mh), obtained from the effective masses me and mh of the constituting electron and hole, the effective thicknessdof the monolayer (treated as a thin slab in this model), the oscillator strength f1s,2p of the intraexcitonic transition, the resonance energyEres, and the line widthΔ. Additional constants are the electron chargeeand the vacuum permeabilityε0. The second term represents the Drude response of the electron−hole plasma, which depends on the pair density of free carriersnFC and their scattering rateΓ. For the analysis of the data, we fix the reduced massμ= 0.17 m012and the oscillator strengthf1s,2p
= 0.32,19corresponding to electron−hole properties at the K and K′valleys in WSe2, and set the effective layer thicknessdto 0.7 nm. The remaining parameters of the Drude−Lorentz model (nX, nFC, Eres, Δ, Γ) are then extracted by fitting the experimental data. Note that the fact that both independently measured Δσ1 and Δε1 spectra need to be simultaneously reproduced poses strict limits to the possible values of the fitting parameters. The numerical adaptation (Figure 2a,b, black dashed curves) yields an overall goodfit quality, allowing for a meaningful extraction of the parameters. We further note that the extracted exciton and free carrier densities are obtained as absolute quantities for a given choice of material parameters, such as carrier effective masses and the oscillator strength, Figure 2. (a) Upper panel: time-resolved waveforms of the probe
pulseEreftransmitted through the WSe2monolayer in the absence of excitation (black curve) and the pump-induced changeΔE(red curve, scaled up by a factor of 500) after resonant excitation (tPP= 75 fs, pump fluence: 19 μJ/cm2) in ambient conditions. Lower panel:
corresponding pump-induced changes of the real parts of the optical conductivityΔσ1(top) and the dielectric functionΔε1(bottom) as a function of the photon energy. The experimental data is shown by red circles; the results from the Drude−Lorentz model are plotted as black-dashed lines with shaded areas. (b) Same as (a) for nonresonant excitation (tPP= 400 fs, pumpfluence: 19μJ/cm2). The lower panel includes afit by the Drude model (i.e., excluding excitons), indicated by the red-dashed line.
Nano Letters
without the requirement of any a priori assumptions of the density ratios.
For resonant excitation, we find an exciton density ofnX = 3.4×1012cm−2and, as expected, virtually no contribution from unbound electron−hole pairs. The 1s−2p resonance energy of 167 meV and the peak line width of 99 meV also compare well with previous observations.19 Conversely, the response after nonresonant excitation includes a significant fraction of unbound electron−hole pairs nFC of 0.8 × 1012 cm−2 (with nX= 1.5×1012cm−2,Eres= 180 meV,Δ= 182 meV, andΓ= 0.052 fs−1). Whereas the qualitative shape of the measured response functions inFigure 2b can be roughly accounted for by the Drude model alone (red dotted lines), the two- component model (see eq 1) reproduces the data more accurately. This observation already indicates that electron− hole correlations are important even for delay times as short as tPP< 1 ps.
The ultrafast evolution of the mid-IR of a nonresonantly generated electron-hole system response is systematically shown inFigure 3, which displays spectra ofΔσ1andΔε1for a series of delay timestPPtogether with thefit curves from the Drude−Lorentz model. The correspondingfield-resolved time- domain data are given inSupporting InformationFigure S7. At tPP= 0 fs, we recover a predominantly Drude-like response, as previously discussed. After 400 fs, the overall magnitude of the
signal increases and a broad resonance centered at about 160 meV develops. On the basis of the close correspondence to the 1s−2p absorption measured under resonant excitation conditions, this resonance is attributed to the rising exciton population. For tPP > 0.8 ps, all pump-induced changes decrease, indicating carrier recombination. More importantly, the measured response remains characteristic of a mixture of excitons and free carriers at all delay times. In particular, we observe a broad excitonic feature inΔσ1but also aflat negative response in Δε1 from the electron−hole plasma across all spectra.
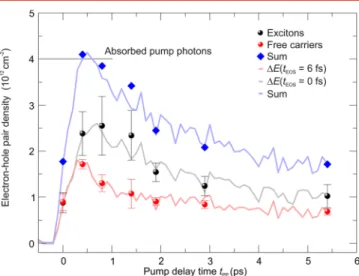
The densities of bound and unbound electron−hole pairs, extracted from the Drude−Lorentzfit, are presented inFigure 4
(spheres) as a function of tPP together with the total pair density, ntot = nX + nFC. Interestingly, the extracted densities reach their respective maxima atfinite delays oftPP= 0.4 ps for nFCandntotandtPP= 0.8 ps for nX. All densities subsequently decay on a few-picoseconds scale. For a consistency check, we also measured the transient changes of the electricfieldΔE(tPP) atfixed electro-optic delays oftEOS= 0 and 6 fs. Because these times correspond to phase-shifts ofπandπ/2 with respect to the peak of the waveformEref(Figure 2a,b), theΔEsignals at these delays should be mostly sensitive to exciton and plasma densities, respectively, as discussed above (see alsoSupporting InformationFigure S4 together with discussion). Indeed, these data (Figure 4, solid curves) almost perfectly trace the individual dynamics of excitons and plasma obtained from the full spectral analysis (Figure 4, spheres). The temporal evolution of the remaining fitting parameters (Δ, Eres, Γ) is given inSupporting InformationFigure S8.
Our experimental findings provide important insights into key aspects of the microscopic dynamics of the photogenerated Figure 3. Pump-induced changes of the real parts of the optical
conductivity Δσ1 (a) and the dielectric function Δε1 (b) of the photoexcited WSe2monolayer as a function of the photon energy for several pump delays tPP after nonresonant excitation. The pump fluence is set to 38μJ/cm2. Red spheres denote the experimental data and the black dashed curves represent the results by the Drude−
Lorentz modelfitting simultaneouslyΔσ1andΔε1.
Figure 4. Absolute electron−hole pair densities extracted from the data shown inFigure 3, using the Drude−Lorentz model, including 1s excitons nX (black spheres), unbound electron−hole pairs nFC (red spheres), and the total density of the two contributions (blue diamonds) as a function of the delay time tPP after nonresonant excitation. The error bars represent the 95% confidence intervals of the fitting parameters. In addition, pump-induced changesΔErecorded at fixed electro-optic sampling times oftEOS= 0 fs (gray solid line) and 6 fs (red solid line) as a function oftPPare presented. These changes are proportional to the exciton and plasma densities, respectively, as discussed in the main text. The horizontal solid line marks the number of absorbed pump photons as estimated from the applied pump fluence and the optical absorbance.
Nano Letters
electron−hole pairs. We start out by discussing the delayed rise of the carrier densities with respect to the pump pulse, which we attribute to ultrafast carrier relaxation. As indicated inFigure 1c, the carriers are injected into comparativelyflat sections of the electronic band structure, defining states with large effective masses. As we model the mid-IR response using the reduced mass from the band edge K (and K′) states, the extracted carrier density underestimates the actual number of carriers at these early delay times. This argument is quantitatively consistent with an estimate of the injected carrier density by taking into account an effective optical absorption of the diamond-supported WSe2monolayer of about 5% at a photon energy of 3.04 eV. As shown in Figure 4, the number of absorbed photons (4 × 1012 cm−2) closely matches the maximum measured density ntot = nX + nFC of bound and unbound electron−hole pairs extracted from the experiment.
Thus, attPP = 0.4 ps, we can quantitatively account for every absorbed photon resulting in an electron−hole pair residing close to the band edges of WSe2.
Second, fortPP= 0.4 ps, roughly 60% of the injected carriers are found to be already bound into excitons. UntiltPP= 0.8 ps, additional excitons are formed from free charge carriers and the exciton fraction reaches its maximum of about 70% while the plasma density decreases. The exciton formation in monolayer WSe2 is thus significantly faster, by about 2 orders of magnitude, than the corresponding process in GaAs quantum wells.33,43It is also more rapid than the recently reported trion formation in monolayer TMDCs, which evolves on the time scale of several picoseconds.44Subsequently, both excitons and unbound carriers decay through radiative and nonradiative recombination. Remarkably, the fraction of bound and unbound carriers remains roughly constant during the carrier lifetime up to the maximum studied time delay of 5.4 ps. By assuming a thermal population and using the Saha equation,43 the corresponding effective carrier temperature is estimated to be of the order of 1500 K. Consequently, the exciton and plasma populations are far from equilibrium considering the lattice temperature of 295 K. This scenario appears reasonable considering the high initial excess energy and the short carrier lifetime of a few picoseconds. At these conditions, fast initial carrier relaxation could result in nonequilibrium phonon populations subsequently keeping the effective carrier temper- ature high through reabsorption, the so-called hot-phonon effect.45An alternative explanation of reaching a bottleneck in electron−phonon scattering by phase-space restrictions appears less likely, because the estimated temperature of 1500 K is well above typical optical and acoustic zone-edge phonon energies in WSe246 and should thus not impede further relaxation through phonon emission.
Finally, we note that excitons can be present both as optically bright, spin-allowed K−K excitons (labeled by the location of the corresponding interband transitions in the Brillouin zone) and as spin- and momentum-forbidden dark states. In addition, relaxation of the exciton population toward intervalley K−K′47 and K-Q/Σ states30 is possible. However, due to the similar binding energies of the different states and the broadening of the measured 1s−2p resonance, the excitons in our experiment should be generally considered as a mixture of these configurations. Because of the relatively small variation of effective exciton masses, however, ranging from 0.16 m0(bright K−K excitons) to 0.23 m0(x−yaveraged K−Q excitons),42the extracted total density should deviate by less than roughly one-
third from the actual pair density in the mixture of different states.
Overall, our findings are consistent with the recent experimental31 and theoretical48 studies on the exciton formation in TMDC monolayers. In particular, the interband pump−probe data of ref31have been explained by formation times on the order of 0.3 ps across several material systems and for a broad range of excitation energies, up to 2.38 eV for WSe2, corresponding well to ourfindings. With respect to the theory, high above-bandgap excitation in our experiment enables absorption channels across the Brillouin zone and is expected to lead to rich, nontrivial dynamics on ultrashort time scales in contrast to carrier injection close to the free particle band edge at the K and K′points considered in ref48.
In summary, we have studied the ultrafast intraband response of optically resonantly and nonresonantly pumped WSe2 monolayers. Field-resolved detection of the spectrally broad mid-IR probe pulse allowed us to directly monitor the individual population dynamics of the electron−hole plasma and the tightly bound excitons. Remarkably, we alreadyfind an exciton fraction as high as 60% after the initial relaxation of the photoexcited carriers toward the band edge states within the first few hundreds of femtoseconds. During the subsequent decay of the population on a time scale of several picoseconds, about 70% of the carriers are bound into excitons and the rest of the photoexcited electrons and holes is still present as a free plasma, indicating long-lived nonequilibrium conditions of the carrier system. Thefindings are of major importance both for our understanding of the fundamental physics of photoexcited 2D TMDCs and for their potential future applications. On the fundamental side, the clear evidence of a rapid exciton formation implies highly efficient exciton injection even under strongly nonresonant excitation conditions. With respect to applications, the presence of a significant fraction of free charge carriers at comparatively long time scales has major implications for the use of TMDC monolayers in future optoelectronic devices, such as sensors, detectors, and photo- voltaics.
■
ASSOCIATED CONTENT*S Supporting Information
The Supporting Information is available free of charge on the ACS Publications website at DOI: 10.1021/acs.nano- lett.6b04422.
Optical pump and mid-infrared probe pulses; field- resolved optical pump/mid-infrared probe spectroscopy;
degradation of the WSe2monolayer; temporal evolution of the field-resolved time-domain data; temporal evolution of thefitting parameters (PDF)
■
AUTHOR INFORMATION Corresponding Authors*E-mail: alexey.chernikov@ur.de.
*E-mail: rupert.huber@ur.de.
ORCID
Philipp Steinleitner: 0000-0001-6808-5547 Notes
The authors declare no competingfinancial interest.
Nano Letters
■
ACKNOWLEDGMENTSThe authors thank Andor Kormanyos, Christoph Pó ̈llmann, and Michael Porer for helpful discussions and Martin Furthmeier for technical assistance. Special thanks go to the authors of ref 42 for providing the band structure data for WSe2. This work was supported by the European Research Council through ERC Grant 305003 (QUANTUMsub- CYCLE) and by the Deutsche Forschungsgemeinschaft (DFG) through Research Training Group GK1570 and Project Grant KO3612/1-1. A.C. gratefully acknowledges funding from the Deutsche Forschungsgemeinschaft through the Emmy Noether Programme (CH1672/1-1).
■
(1) Splendiani, A.; Sun, L.; Zhang, Y.; Li, T.; Kim, J.; Chim, C.-Y.;REFERENCES Galli, G.; Wang, F.Nano Lett.2010,10, 1271−1275.(2) Mak, K. F.; Lee, C.; Hone, J.; Shan, J.; Heinz, T. F.Phys. Rev. Lett.
2010,105, 136805.
(3) Tonndorf, P.; Schmidt, R.; Böttger, P.; Zhang, X.; Börner, J.;
Liebig, A.; Albrecht, M.; Kloc, C.; Gordan, O.; Zahn, D. R. T.; et al.
Opt. Express2013,21, 4908−4916.
(4) Moody, G.; Dass, C. K.; Hao, K.; Chen, C.-H.; Li, L.-J.; Singh, A.;
Tran, K.; Clark, G.; Xu, X.; Berghäuser, G.; et al.Nat. Commun.2015, 6, 8315.
(5) Xu, X.; Yao, W.; Xiao, D.; Heinz, T. F.Nat. Phys.2014,10, 343− 350.
(6) Wang, G.; Glazov, M. M.; Robert, C.; Amand, T.; Marie, X.;
Urbaszek, B.Phys. Rev. Lett.2015,115, 117401.
(7) Plechinger, G.; Nagler, P.; Arora, A.; Schmidt, R.; Chernikov, A.;
del Águila, A. G.; Christianen, P. C.M.; Bratschitsch, R.; Schüller, C.;
Korn, T.Nat. Commun.2016,7, 12715.
(8) Wang, Q. H.; Kalantar-Zadeh, K.; Kis, A.; Coleman, J. N.; Strano, M. S.Nat. Nanotechnol.2012,7, 699−712.
(9) Britnell, L.; Ribeiro, R. M.; Eckmann, A.; Jalil, R.; Belle, B. D.;
Mishchenko, A.; Kim, Y.-J.; Gorbachev, R. V.; Georgiou, T.; Morozov, S. V.; et al.Science2013,340, 1311−1314.
(10) Jariwala, D.; Sangwan, V. K.; Lauhon, L. J.; Marks, T. J.; Hersam, M. C.ACS Nano2014,8, 1102−1120.
(11) Koppens, F. H. L.; Mueller, T.; Avouris, Ph.; Ferrari, A. C.;
Vitiello, M. S.; Polini, M.Nat. Nanotechnol.2014,9, 780−793.
(12) Berkelbach, T. C.; Hybertsen, M. S.; Reichman, D. R.Phys. Rev.
B: Condens. Matter Mater. Phys.2013,88, 045318.
(13) Qiu, D. Y.; da Jornada, F. H.; Louie, S. G.Phys. Rev. Lett.2013, 111, 216805.
(14) Zhang, C.; Johnson, A.; Hsu, C.; Li, L.; Shih, C. Nano Lett.
2014,14, 2443−2447.
(15) Ye, Z.; Cao, T.; O’Brien, K.; Zhu, H.; Yin, X.; Wang, Y.; Louie, S. G.; Zhang, X.Nature2014,513, 214−218.
(16) He, K.; Kumar, N.; Zhao, L.; Wang, Z.; Mak, K. F.; Zhao, H.;
Shan, J.Phys. Rev. Lett.2014,113, 026803.
(17) Chernikov, A.; Berkelbach, T. C.; Hill, H. M.; Rigosi, A.; Li, Y.;
Aslan, O. B.; Reichman, D. R.; Hybertsen, M. S.; Heinz, T. F.Phys.
Rev. Lett.2014,113, 076802.
(18) Ugeda, M. M.; Bradley, A. J.; Shi, S.-F.; da Jornada, F. H.;
Zhang, Y.; Qiu, D. Y.; Ruan, W.; Mo, S.-K.; Hussain, Z.; Shen, Z.-X.;
et al.Nat. Mater.2014,13, 1091−1095.
(19) Poellmann, C.; Steinleitner, P.; Leierseder, U.; Nagler, P.;
Plechinger, G.; Porer, M.; Bratschitsch, R.; Schüller, C.; Korn, T.;
Huber, R.Nat. Mater.2015,14, 889−893.
(20) Zhu, C. R.; Zhang, K.; Glazov, M.; Urbaszek, B.; Amand, T.; Ji, Z. W.; Liu, B. L.; Marie, X.Phys. Rev. B: Condens. Matter Mater. Phys.
2014,90, 161302.
(21) Chernikov, A.; Ruppert, C.; Hill, H. M.; Rigosi, A. F.; Heinz, T.
F.Nat. Photonics2015,9, 466−470.
(22) Kumar, N.; Cui, Q.; Ceballos, F.; He, D.; Wang, Y.; Zhao, H.
Phys. Rev. B: Condens. Matter Mater. Phys.2014,89, 125427.
(23) Chen, H.; Wen, X.; Zhang, J.; Wu, T.; Gong, Y.; Zhang, X.;
Yuan, J.; Yi, C.; Lou, J.; Ajayan, P. M.; et al.Nat. Commun.2016,7, 12512.
(24) Mak, K. F.; He, K.; Lee, C.; Lee, G. H.; Hone, J.; Heinz, T. F.;
Shan, J.Nat. Mater.2012,12, 207−211.
(25) You, Y.; Zhang, X.-X.; Berkelbach, T. C.; Hybertsen, M. S.;
Reichman, D. R.; Heinz, T. F.Nat. Phys.2015,11, 477−481.
(26) Lagarde, D.; Bouet, L.; Marie, X.; Zhu, C. R.; Liu, B. L.; Amand, T.; Tan, P. H.; Urbaszek, B.Phys. Rev. Lett.2014,112, 047401.
(27) Wang, H.; Zhang, C.; Chan, W.; Manolatou, C.; Tiwari, S.;
Rana, F.Phys. Rev. B: Condens. Matter Mater. Phys.2016,93, 045407.
(28) Zimmermann, J. E.; Mette, G.; Höfer, U. 2016, arxiv 1608.03434v2.
(29) Robert, C.; Lagarde, D.; Cadiz, F.; Wang, G.; Lassagne, B.;
Amand, T.; Balocchi, A.; Renucci, P.; Tongay, S.; Urbaszek, B.; et al.
Phys. Rev. B: Condens. Matter Mater. Phys.2016,93, 205423.
(30) Selig, M.; Berghäuser, G.; Raja, A.; Nagler, P.; Schüller, C.;
Heinz, T. F.; Korn, T.; Chernikov, A.; Malic, E.; Knorr, A. Nat.
Commun.2016,7, 13279.
(31) Ceballos, F.; Cui, Q.; Bellus, M. Z.; Zhao, H.Nanoscale2016,8, 11681−11688.
(32) Huber, R.; Tauser, F.; Brodschelm, A.; Bichler, M.; Abstreiter, G.; Leitenstorfer, A.Nature2001,414, 286−289.
(33) Kaindl, R. A.; Carnahan, M. A.; Hägele, D.; Lövenich, R.;
Chemla, D. S.Nature2003,423, 734−738.
(34) Leinß, S.; Kampfrath, T.; v. Volkmann, K.; Wolf, M.; Steiner, J.
T.; Kira, M.; Koch, S. W.; Leitensdorfer, A.; Huber, R.Phys. Rev. Lett.
2008,101, 246401.
(35) Porer, M.; Leierseder, U.; Ménard, J.-M.; Dachraoui, H.;
Mouchliadis, L.; Perakis, I. E.; Heinzmann, U.; Demsar, J.; Rossnagel, K.; Huber, R.Nat. Mater.2014,13, 857−861.
(36) Ménard, J.-M.; Poellmann, C.; Porer, M.; Leierseder, U.;
Galopin, E.; Lemaitre, A.; Amo, A.; Bloch, J.; Huber, R.Nat. Commun.
2014,5, 4648.
(37) Cha, S.; Sung, J. H.; Sim, S.; Park, J.; Heo, H.; Jo, M.-H.; Choi, H.Nat. Commun.2016,7, 10768.
(38) Kubouchi, M.; Yoshioka, K.; Shimano, R.; Mysyrowicz, A.;
Kuwata-Gonokami, M.Phys. Rev. Lett.2005,94, 016403.
(39) Huber, R.; Schmid, B. A.; Shen, Y. R.; Chemla, D. S.; Kaindl, R.
A.Phys. Rev. Lett.2006,96, 017402.
(40) Castellanos-Gomez, A.; Buscema, M.; Molenaar, R.; Singh, V.;
Janssen, L.; van der Zant, H. S. J.; Steele, G. A.2D Mater.2014,1, 011002.
(41) Li, Y.; Chernikov, A.; Zhang, X.; Rigosi, A.; Hill, H. M.; van der Zande, A. M.; Chenet, D. A.; Shih, E.-M.; Hone, J.; Heinz, T. F.Phys.
Rev. B: Condens. Matter Mater. Phys.2014,90, 205422.
(42) Kormányos, A.; Burkard, G.; Gmitra, M.; Fabian, J.; Zólyomi, V.;
Drummond, N. D.; Fal’ko, V.2D Mater.2015,2, 022001.
(43) Kaindl, R. A.; Hängele, D.; Carnahan, M. A.; Chemla, D. S.Phys.
Rev. B: Condens. Matter Mater. Phys.2009,79, 045320.
(44) Singh, A.; Moody, G.; Tran, K.; Scott, M. E.; Overbeck, V.;
Berghauser, G.; Schaibley, J.; Seifert, E. J.; Pleskot, D. N.; Gabor, M.;̈ et al.Phys. Rev. B: Condens. Matter Mater. Phys.2016,93, 041401.
(45) Pötz, W.; Kocevar, P.Phys. Rev. B: Condens. Matter Mater. Phys.
1983,28, 7040.
(46) Terrones, H.; Del Corro, E.; Feng, S.; Poumirol, J. M.; Rhodes, D.; Smirnov, D.; Pradhan, N. R.; Lin, Z.; Nguyen, M. A. T.; Elías, A.
L.; et al.Sci. Rep.2014,4, 4215.
(47) Zhang, X.-X.; You, Q.; Yang, S.; Zhao, F.; Heinz, T. F.Phys. Rev.
Lett.2015,115, 257403.
(48) Thilagam, A.J. Appl. Phys.2016,120, 124306.
Nano Letters