ATL-PHYS-PUB-2009-064 10May2009
ATLAS NOTE
Data-Driven Determinations of W , Z and Top Backgrounds to Supersymmetry
The ATLAS Collaboration
1)This note is part of CERN-OPEN-2008-020. This version of the note should not be cited: all citations should be to CERN-OPEN-2008-020.
Abstract
The Standard Model processes ofW boson,Z boson and top quark production each in association with jets constitute major backgrounds to searches for Supersymmetry at the LHC. In this note, we estimate the contribution of these backgrounds for a basic SUSY selection, and discuss methods to derive them from the initial 1 fb−1 of integrated luminosity at ATLAS.
1)This note prepared by G. Akimoto, S. Asai, Y. Azuma, R. Bruneliere, P. Casado, C. Clement, P. de Jong, L. Fiorini, P.
Hansson, N. Kanaya, Y. Kataoka, F. Koetsveld, A. Koutsman, H. Kroha, F. Legger, B.R. Mellado Garcia, L-M. Mir, H. Okawa, C. Osuna, Y. Pan, G. Redlinger, T. Sarangi, J. Sjolin, T. Suzuki, Y. Tomishima, D. Tovey, W. Verkerke, S.L. Wu, T. Yamazaki, Z. Yang, X-A. Zhuang and V. Zhuravlov.
1 Introduction
1.1 Motivation
The Large Hadron Collider (LHC) will provide excellent opportunities to search for new physics beyond the Standard Model, and the ATLAS detector [1] is a general purpose experiment to explore such new physics. Supersymmetry (SUSY) is a theoretically attractive model for new physics beyond the Standard Model, and searching for Supersymmetry is one of the main objectives of ATLAS. The actual search strategy is described elsewhere in this volume [2].
It is clear, however, that any discovery of new physics can only be claimed when the Standard Model backgrounds are understood and are under control. It is expected that at the LHC, Monte Carlo pre- dictions will not be sufficient to achieve this: the backgrounds will have to be derived from the data themselves, possibly helped by Monte Carlo. The development and description of such data-driven background estimation is the topic of this note. We note that for a complete understanding of the back- grounds, multiple, independent methods are desired. Each of these may be sensitive to a specific back- ground source, and affected by specific systematic effects. Only their consistency in combination allows for sufficient confidence in the control of the background to claim a discovery when a signal appears to be present.
1.2 Data-driven methods: scope of this note
The general aim of data-driven methods is to estimate from the data the Standard Model backgrounds and their uncertainties in a “signal” region, in which new physics may be present. Such a signal region is typically obtained after applying selection cuts, or multivariate methods, and the new physics is searched for as an excess in the number of selected events over background, or as an excess in certain regions of certain distributions.
The background estimation is performed by selection of “control samples”, from which predictions in the signal region are derived. Good control samples should be as close as possible to the signal region, yet free of SUSY signal, give an unbiased estimate of background in the signal region, have sufficient statistics, and small theoretical uncertainties. This note intends to describe a number of ideas on selection of such control samples for SUSY searches. Good control of the composition of control samples is important for a correct extrapolation into the signal region.
The methods described in this note should not be regarded as the final word on these procedures, but rather present a number of ideas. Each of these ideas will have to be pursued further, and the effect of other systematic uncertainties will need to be studied. Furthermore, SUSY selection cuts will evolve, and so the methods will need to evolve too. We do believe, however, that a first indication of the uncertainties that can be expected can be given.
This note deals with top, W and Z backgrounds to SUSY searches with primary squark or gluino production, and assuming R-parity conservation. The initial priority is to simulate results for 1 fb
−1of integrated luminosity, and for the understanding of the detector expected. The other important QCD background of quark (other than top) and gluon jet production is treated elsewhere in this volume [3].
Backgrounds to alternative production models are also described elsewhere: direct gaugino produc- tion [4], and photonic and long-lived particle (such as R hadron) signatures [5].
1.3 SUSY contamination
If SUSY is discoverable, it is likely that SUSY events will creep into the control samples, thereby affect-
ing the background estimates. In general, SUSY events, mistakenly regarded as Standard Model physics,
will lead to an overestimation of the background, and thus to a reduced SUSY event excess. The extent to which this happens will be analysis- and SUSY model-dependent.
Since we do not know whether SUSY exists, we quote the SUSY contamination effects separately from the other systematics. We will do so by running each data-driven estimation method not only over background samples, but also on a number of SUSY signal samples [6]. The samples represent various regions of mSUGRA parameter space, and together give an impression of the effects. The SU1 sample is a point in the stau coannihilation region, the SU2 sample in the focus point region, and the SU3 sample in the bulk region. The SU4 point is a low-mass point, just above the Tevatron limits. It has a very large cross-section, and kinematic distributions that are typically only slightly harder than the Standard Model background. As will be shown, this model has the largest SUSY contamination effect on the background estimates.
There are a number of ways that the data-driven methods can take the presence of SUSY into account:
1. Iteration. The Standard Model background is evaluated under the assumption that there is no SUSY. This will overestimate the background if there is SUSY, and reduce any excess. Neverthe- less, if an excess is seen, the underlying assumption in the background estimation has been proven wrong, and a correction can be applied. This correction can be derived from the properties of the observed excess, and will lead to a new background estimate. An example of such a procedure is the “new MT method” described in section 3.3.3. However, other implementations are possible, and perhaps necessary, as well.
2. A combined fit determining the composition of the control sample, allowing for a possible SUSY contribution.
Both methods are investigated in this note. Nevertheless it is clear that these are preliminary ideas that require further investigation. Most likely, some form of iteration on the background determinations will be necessary.
1.4 Layout of this note
A number of important prerequisites for the studies presented here are described in an introductory note [6]:
•
the physics processes that form the background to SUSY searches and how they are simulated, as well as a few SUSY event samples (SU1–SU8) that serve to estimate the effect of SUSY on our background estimates;
•
the definition of objects like electrons, muon, taus, jets and missing transverse energy, and common variables like the effective mass M
eff;
•
the origin and common treatment of various systematic uncertainties, both from the simulation and from the performance of the detector.
Furthermore, the trigger menu that was used is described elsewhere [7]. In this note we then discuss the W, Z, and top-quark backgrounds and their data-driven estimation for two different SUSY search modes:
1. the mode with one isolated electron or muon (section 2);
2. the no-lepton mode, with a veto against isolated leptons (section 3).
2 One-lepton search mode
2.1 Selection
The one-lepton search mode is expected to play a major role in the SUSY search, since the requirement of an isolated lepton will be effective in suppressing QCD background. In this search mode, we require one isolated electron or muon, with a p
Tof more than 20 GeV. We veto events with a second identified lepton with a p
Tof more than 10 GeV, so that we have no overlap with the di-lepton search mode.
We demand at least four jets with
|η| <2.5 and p
T >50 GeV, at least one of which must have p
T>100 GeV. The transverse sphericity S
Tshould be larger than 0.2, and the missing transverse energy E
Tmissshould be larger than 100 GeV and larger than 0.2M
eff, where M
effis the effective mass
2). The transverse mass M
Treconstructed from the lepton and E
Tmissshould be larger than 100 GeV.
2.2 Backgrounds in Monte Carlo
In many SUSY models after the selection cuts have been applied clear excesses will be observed in the high E
Tmissand high effective mass regions, as shown in Figure 1. The dominant background process for the one-lepton mode is t t ¯ (90%), with W
±+jets (10%) being the subdominant process. The neutrinoemitted from the W
±decays produces the E
Tmissin the both processes. Smaller contributions come from Z
+jets, diboson and single top events and from QCD processes. It is interesting to note that the major t t ¯ background does not come from the semileptonic (t t ¯
→b b ¯
`νq q ¯
0) top pair events which are reduced by the M
Tand E
Tmisscuts, but rather from the double leptonic (t t ¯
→b b`ν ¯
`ν) top decay where one lepton is not identified.
[GeV]
Missing ET
0 100 200 300 400 500 600 700 800 900 1000 / 50GeV−1Events / 1fb
10−1
1 10
102 SU3
SM BG ttW Zsingle top
ATLAS
Effective Mass [GeV]
500 1000 1500 2000 2500 3000 / 200GeV−1 Events / 1fb
10−1
1 10
102 SU3
SM BG ttW Zsingle top
ATLAS
Figure 1: The E
Tmissand effective mass distributions for the background processes and for an example SUSY benchmark point (SU3) in the one-lepton mode for an integrated luminosity of 1 fb
−1. The black circles show the SUSY signal. The hatched histogram show the sum of all Standard Model backgrounds;
also shown in different colours are the various components of the background.
2.3 Data-driven estimation strategies
We discuss a variety of different methods to estimate the background from data. These methods differ in their approach and therefore are influenced by different systematic uncertainties, and they focus on different aspects of the background:
2)The variablesST,Meff andMTare defined elsewhere in this volume [6].
1. estimation of W and t t ¯ background from a control sample formed by reversing one of the selection cuts (on M
T) (section 2.3.1);
2. estimation of the semileptonic t t ¯ background by explicit kinematic reconstruction and selection on top mass (“top box”) (section 2.3.2);
3. estimation of the double leptonic t t ¯ background, where one lepton is missed, by explicit kinematic reconstruction of a control sample of the same process with both leptons identified (section 2.3.3);
4. estimation of that same double leptonic t t ¯ background from a control sample derived by a cut on a new variable HT2 (section 2.3.4);
5. estimation of t t ¯ background by Monte Carlo redecay methods (section 2.3.5);
6. estimation of W and t t ¯ background using a combined fit to control samples (section 2.3.6).
2.3.1 Creating a control sample by reversing the M
Tcut
The transverse mass M
Tis constructed from the identified lepton and the missing transverse energy. In the narrow-width limit M
Tis constrained to be less than m
Wfor the semileptonic t t ¯ and the W
±processes.
Figure 2 shows that M
Tis only weakly dependent on E
Tmiss. This variable is therefore suitable for the estimation of the background distribution itself. Events with small M
T(< 100 GeV) are selected as the control sample, in which the t t ¯ (
∼84%) and W
±(
∼16%) processes are enhanced over the SUSY and the other background processes. The large M
T(> 100 GeV) region is referred to as the signal region.
Since, for the control sample, the other selection criteria are identical to those for events in the signal region, the same kinematic distributions including E
Tmisscan be obtained. The number of events for the various processes in signal region and control sample is summarized in the Table 1.
[GeV]
Missing ET
0 100 200 300 400 500 600 700 800 900 1000 / 50GeV−1Events / 1fb
1 10 102
103
Signal Region Control Region
ATLAS
[GeV]
Missing ET
0 100 200 300 400 500 600 700 800 900 1000 / 50GeV−1 Events / 1fb
10−1
1 10 102
Signal Region Control Region
ATLAS
Figure 2: The E
Tmissdistribution for t t ¯ (left) and SUSY (SU3, right) signal. In both figures, the solid and dashed histograms show the E
Tmissdistribution for M
T >100 GeV and
<100 GeV, respectively. The numbers are normalized to 1 fb
−1.
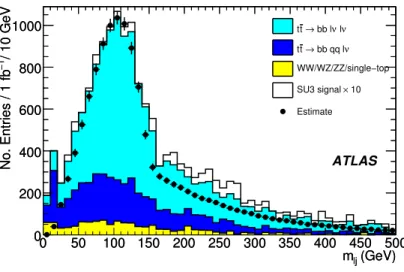
The normalization factor is obtained from the event numbers of the signal region and the control
sample (100
<E
Tmiss<200 GeV), in which the SUSY signal contribution is expected to be relatively
small. Figure 3 shows the E
Tmissand M
effdistributions which are obtained using this method to estimate
the size of these backgrounds, and, for comparison, the true background distributions. The numbers of
events with E
Tmiss >100 GeV and
>300 GeV are listed in Table 2. The prediction and the true values
agree within the uncertainties, although somewhat less well for high E
Tmiss.
Table 1: Number of background events and estimated numbers for t t ¯ , W
±and QCD processes without SUSY signal, normalized to 1 fb
−1.
Signal Region Control Sample tt(`¯ νqq)¯ 51 (25%) 1505 (77%) tt(`¯ ν`ν) 140 (70%) 132 (7%) W±(`ν) 10 (5%) 305 (16%)
SUSY(SU3) 450 317
The t t ¯ event composition of the control sample differs from that of the signal sample, since the M
Tcut removes a much larger proportion of the semileptonic t t ¯ events. The control sample is still able to predict the background in the signal sample within statistical uncertainties. Nevertheless, the resulting systematic shift needs to be investigated, and would be desirable to obtain independent estimates of the fully-leptonic and semileptonic t t ¯ backgrounds separately.
[GeV]
Missing ET
0 100 200 300 400 500 600 700 800 900 1000 / 50GeV−1Events / 1fb
10−1
1 10
102 estimated BG
SM BG ttW Zsingle top
ATLAS
Effective Mass [GeV]
500 1000 1500 2000 2500 3000 / 200GeV−1 Events / 1fb
10−1
1 10
102 estimated BG
SM BG ttW Zsingle top
ATLAS
Figure 3: The E
Tmissand effective mass distributions of the background processes for the one-lepton mode with an integrated luminosity of 1 fb
−1. The open circles show the estimated distributions with the M
Tmethod. The hatched histogram shows the true sum of all Standard Model backgrounds; different symbols show the various contributions to the background.
Table 2: Numbers of background events and estimated numbers for the sum of all background processes without SUSY signal, normalized to 1 fb
−1ETmiss >100 GeV ETmiss >300 GeV
True BG 203±6 12.4±1.6
Estimated BG 190±8 9.4±0.7 Ratio(Est./True) 0.93±0.05 0.76±0.11
SUSY signal contamination If supersymmetric particles are produced they are also likely to contribute
to the control samples. The estimated E
Tmissdistribution with the presence of a SUSY signal (SU3 point)
is shown in Figure 4 (left), and the numbers are listed in Table 3. The background is overestimated due
to the SUSY contamination, and the inferred E
Tmissdistribution is biased towards larger values. However, the amount of the over-estimation is smaller than the SUSY signal itself, and a clear excess can still be observed, as shown in the figure. The same exercise was repeated for other SUSY signal points, as also shown in Table 3.
[GeV]
Missing ET
0 100 200 300 400 500 600 700 800 900 1000 / 50GeV−1 Events / 1fb
10−1
1 10
102 truth BG
truth BG+SUSY truth SUSY est. BG (old MT)
ATLAS
Transverse Mass [GeV]
0 50 100 150 200 250 300 350 400 450 500 / 20GeV−1 Events / 1fb
1 10 102
103 SU1
SU2SU3 SM BG ttW ZDiboson
ATLAS
Figure 4: Left: the E
Tmissdistribution of the background processes for the one-lepton mode with an integrated luminosity of 1 fb
−1. The red dots show the estimated distributions with the M
Tmethod, with SUSY signal (SU3) present. The hatched histogram shows the sum of all Standard Model backgrounds, and the OPEN histogram shows the SUSY signal (SU3). Right: the transverse mass distributions of the various SUSY signals (SU1, SU2 and SU3) with an integrated luminosity of 1 fb
−1. Background processes are superimposed for comparison. The hatched histogram shows the sum of all Standard Model backgrounds.
Table 3: Number of background events and estimated numbers for all background processes with SUSY signal, normalized to 1 fb
−1. Also the total number of events (SUSY + background) is shown.
ETmiss >100 GeV ETmiss >300 GeV ETmiss >100 GeV ETmiss >300 GeV
True BG 203±6 12.4±1.6 203±6 12.4±1.6
SU1 SU4
Estimated BG 225±9 21.6±1.1 2366±102 165±12.7
True BG+SUSY 463±7 194±4 3177±79 415±29
SU2 SU6
Estimated BG 200±9 10.9±0.7 213±9 16.3±0.9
True BG+SUSY 249±7 34±2 365±9 129±5
SU3 SU8
Estimated BG 296±10 33.3±1.4 206±9 13.7±0.8
True BG+SUSY 653±8 245±4 354±8 115±5
Correcting for SUSY signal: “New MT method” If, even for overestimated backgrounds, the pres- ence of a concrete SUSY excess is observed in data, we can try to correct the background estimates.
One possible procedure is described here, referred to as the “new MT method”. More advanced
implementations of such a correction procedure are possible and should be studied.
The new MT method makes use of the observation that in the one-lepton search mode, the M
Tdistribution of backgrounds falls off steeply beyond
∼100 GeV, whereas for many SUSY signal models this distribution falls only slowly. This is illustrated in Figure 4 (right). By making a general ansatz for the shape of the SUSY M
Tdistribution, and neglecting to first order the Standard Model background at high M
T, the SUSY contamination can be subtracted from the control sample. Obviously, remaining Standard Model background in the high M
Tregion and variations in the M
Tshape for various SUSY signals are to be treated as systematic uncertainties on the method. Nevertheless, the data itself will tell what the M
Tshape is.
In the simplest ansatz used here, the ratio of SUSY signal between the control sample M
T <100 GeV and signal region M
T >100 GeV is assumed to be constant for all SUSY signal samples. The normalization factor is obtained from the number of events in the signal region and the corrected control sample in the interval 100 GeV
<E
Tmiss<150 GeV (instead of 100 – 200 GeV) to suppress the SUSY contribution in the normalization region. The statistical error becomes relatively larger when the narrow band is used for normalization, but the over-estimation of the normalization factor due to the SUSY signal can be suppressed. A lower E
Tmissregion, such as E
Tmiss=70
−100 GeV, could be used for the normalization in future studies.
Figure 5 shows the E
Tmissand the effective mass distributions of the estimated background processes.
The true distributions of the background processes are also superimposed. The numbers in regions of E
Tmiss >100 GeV and 300 GeV are listed in Table 4. A reasonable agreement between the prediction and the true values is observed. For high values of E
Tmiss, the method tends to subtract too much SUSY contamination and underestimates the background. More study is needed. The SU4 benchmark point is a special case because it has a particularly light SUSY particle spectrum.
[GeV]
Missing ET
0 100 200 300 400 500 600 700 800 900 1000 / 50GeV−1Events / 1fb
10−1
1 10
102 truth BG
truth BG+SUSY truth SUSY est. BG (new MT)
ATLAS
Effective Mass [GeV]
500 1000 1500 2000 2500 3000 / 200GeV−1 Events / 1fb
10−1
1 10
102 truth BG
truth BG+SUSY truth SUSY est. BG (new MT)
ATLAS
Figure 5: The E
Tmissand effective mass distributions of the background processes for one lepton mode with an integrated luminosity of 1 fb
−1. The red dots show the estimated distributions with the “new M
T” method. The hatched histogram show the sum of all Standard Model backgrounds. The open circles indicate the SUSY (SU3) signal.
The systematic uncertainties
3)for the MT method are summarized in Table 5. As well as variation of jet energy scale and lepton identification efficiency, the ALPGEN Monte Carlo was compared to MC@NLO, and parameters in ALPGEN (minimum p
Tof partons and minimum
∆Rbetween partons) were varied. This method is stable against these systematic uncertainties at the
∼15% level. More work is needed to estimate the SUSY contamination effects.
3)Throughout this note systematic uncertainties have been calculated according to the procedures outlined in the introduction to this chapter [6].
Table 4: Numbers of background events and estimated numbers for all background processes in the presence of various SUSY signals, using the new MT method. The numbers are normalized to 1 fb
−1.
ETmiss >100 GeV ETmiss >300 GeV ETmiss >100 GeV ETmiss >300 GeV
True BG 203±6 12.4±1.6 203±6 12.4±1.6
SU1 SU4
Estimated BG 186±11 8.9±0.8 1382±98 48.3±12.7
True BG+SUSY 463±7 194±4 3177±79 415±29
SU2 SU6
Estimated BG 183±11 8.8±0.8 185±11 8.1±0.9
True BG+SUSY 249±7 34±2 365±9 129±5
SU3 SU8
Estimated BG 212±11 12.3±1.0 180±11 6.6±0.8
True BG+SUSY 653±8 245±4 354±8 115±5
Table 5: Systematic uncertainties of the one-lepton background estimations with the MT method, ex- cluding those related to SUSY signal contamination. Numbers are normalized to 1 fb
−1Syst. error
Jet energy scale <5%
Lepton ID efficiency 7%
MC@NLO vs ALPGEN 8%
Monte Carlo parameter variation (ALPGEN) <5%
2.3.2 Topbox: a control sample for semileptonic top-pair background
Top mass reconstruction and “topbox” cuts This section describes a data-driven method, denoted the “topbox method”, for estimating the t t ¯ background where one top decays leptonically, and the other hadronically.
For semileptonic t t ¯ events, the invariant mass of the leptonically decaying W boson can usually be reconstructed by assuming that the neutrino from the W decay is responsible for all missing energy.
This is a fair assumption; after removal of fake E
Tmiss(noisy/dead calorimeter cells etc.) in the event- cleaning procedure, the resolution on E
Tmissis expected to be approximately equal to 0.55
√∑ET[1], which is much smaller in a typical t t ¯ event than the E
Tmissfrom the escaping neutrino. The fact that the mass of the leptonically decaying top can be reconstructed satisfactorily (see below) further justifies the assumption.
The core of the method is to construct both the semileptonic and the hadronic top decays in a t t ¯ event following the procedure below:
•
The leptonic W is assumed to decay into the observed lepton and a neutrino which is responsible
for all missing energy. The p
xand p
ycomponents of the neutrino momentum are hence taken to
be the x and y components of E
Tmiss. The p
zcomponent of the neutrino can be calculated using
a W mass (m
W) constraint. The four-vector of the leptonic W is the sum of the four-vectors of
the lepton and the reconstructed neutrino. For events with transverse mass M
Tless than m
W, two
solutions can be found. In the case of M
T >m
Wno real solution is possible and, in such cases,
the momentum of the leptonic W is taken from the transverse components of the lepton and E
Tmiss.
Leptonic Top Mass (GeV) 0 50 100 150 200 250 300 350 400 0
0.02 0.04 0.06 0.080.1 0.12 0.140.160.18 0.2 0.22
ttbar W+jets SU3
a.u. ATLAS
Hadronic W Mass (GeV)
0 50 100 150 200 250 300
0 0.05 0.1 0.15 0.2 0.25 0.3
ttbar W+jets SU3
a. u. ATLAS
Hadronic Top Mass (GeV) 0 100 200 300 400 500 600 700 800 900 1000 0
0.02 0.04 0.06 0.08 0.1 0.12 0.14
ttbar W+jets SU3
a.u. ATLAS
Figure 6: Normalized distributions for reconstructed m
top-lep, m
W-had, and m
top-hadfor t t ¯ , W + jets, and SU3 SUSY events, using the “topbox” method.
•
The leptonic top is then reconstructed by taking the solution with the best reconstructed top mass (m
top-lep) from combinations of a jet and one of the above leptonic W solutions. The jet is taken from the pool of the four highest-p
Tjets in the event. The best reconstructed top mass is defined to the one that is closest to the nominal top mass m
t.
•
The hadronic W is then taken to be formed from the best reconstructed W mass (m
W-had) among the two-jet combinations from the remaining three jets in the pool. The best reconstructed W mass is defined to be the invariant closest to m
W.
•
Finally, the hadronic top is taken to be the one with the best reconstructed top mass (m
top-had) among combinations of the hadronic W and one of the remaining jets.
The plots in Figure 6 show the distributions of the reconstructed masses m
top-lep, m
W-had, and m
top-hadafter the mass reconstruction procedure described above. The distributions are made for t t ¯ , SU3 and W
+jets event samples with standard one-lepton cuts, except for a modified M
Trequirement (see below in the control sample section). As expected, the topbox mass reconstruction procedure offers a very good separating power between t t ¯ and other processes.
The topbox cuts are then defined as follows:
|m
top-lep −m
t |<25 GeV,
|m
W-had −m
W|<15 GeV, and
|m
top-had −m
t |<25 GeV.
Topbox control sample To make the topbox control sample, events are selected with the standard SUSY search cuts in the one-lepton mode, with the exception that M
T >100 GeV is replaced by M
T <m
W. In addition, the above topbox cuts are applied.
Table 6 shows the number of events of various processes in the topbox control sample. The t t ¯
+jets process makes up more than 95% of the topbox control sample if no SUSY signal is present.
Table 6: Composition of the topbox control sample. Numbers shown correspond to an integrated lumi- nosity of 1 fb
−1. The last five columns show the numer of SUSY events which would enter into the topbox control sample.
Process tt¯+jets W+Jets SU1 SU2 SU3 SU4 SU6 Events 340.9 6.8 1.8 0.4 4.9 243.6 0.4
SUSY signal contamination Table 6 also shows the number of SUSY events, for various signal sam- ples, in the topbox control sample, for 1 fb
−1. In this method, SUSY contamination is in general small.
This fact makes the topbox method a good supplement to the other methods (e.g. the MT method). The exception is the SU4 benchmark point, which has a larger contribution because its light spectrum makes it rather similar to the t t ¯ background.
Estimation of the t t ¯ background in the signal region The t t ¯ contamination in the signal region is estimated by multiplying the number of events in the data topbox by a scaling factor R
tt. R
ttis defined as the ratio of the number of Monte Carlo t t ¯ events in the signal region (those that pass the one-lepton cuts) to that in the topbox control sample. The procedure is summarized by the following equations:
N
signal-
regiont¯t (data) =
N
t¯topboxt (data)·R
tt(1) R
tt ≡N
signal-
regiontt¯ (MC)/Nt¯topboxt (MC)
(2) With fully simulated Monte Carlo samples, R
ttis determined to be 0.386 . The model dependence (variation of Monte Carlo generator and generator parameters) of this number is treated as a systematic uncertainty.
Systematics The systematic uncertainties of the topbox method are summarized in Table 7. The largest source of uncertainty is from the jet energy scale uncertainty; this is expected since the method relies heavily on the reconstruction of top and W masses. The Monte Carlo model dependency of R
ttis estimated by comparing MC@NLO and ALPGEN, and by variation of the ALPGEN parameters, and amounts to 8%. Finally, it is expected that extra jets due to event pile-up may affect the mass recon- struction resolution. However, this is relevant only in high luminosity scenarios, beyond the scope of this note. The statistical uncertainty on the topbox control sample normalization is estimated to be 5% for 1 fb
−1given that the effective cross-section of t t ¯ in the topbox is about 400 fb.
Table 7: Systematic uncertainties of the topbox method for 1 fb
−1.
Source Contribution [%]
Jet energy scale 20
ETmiss scale 2
Monte Carlo Model dependence ofRtt 8
Total 22
2.3.3 Di-leptonic top with one lepton missed: kinematic reconstruction
Introduction Fully leptonic t t ¯ events may contribute to the one-lepton SUSY search sample if one of the two leptons originating from the W decay is not identified. Such events can be classified as: (1) events with one tau (51%); (2) events where one lepton is misidentified due to inefficiency of the lepton identification algorithms (20%); (3) events where one lepton is lost inside a jet (17%); (4) events where one lepton is not in the p
Tor
ηacceptance (9%); and (5) events with two tau leptons (3%).
The method discussed here is based on the selection of a sample enhanced in t t ¯
→b b` ¯
ν`νevents by requiring that the events satisfy a set of kinematic constraints particular to the t t ¯
→b b ¯
`ν`νprocess.
This sample, denoted as the control sample, with two isolated identified leptons, is used to estimate the contribution from the first two categories of events listed above. The contribution from category (1) is estimated by replacing one of the leptons in the control sample with a tau, and category (2) is estimated by removing one of the two leptons. The contribution from the categories (3)–(5) is not estimated from the control sample. Events were required to fire either the 4j50 multi-jet trigger or the j80 xE50 jet plus E
Tmisstrigger [7].
Selection of the control sample The following requirements are imposed to select events in the control sample: two isolated oppositely-charged leptons (electron or muon), with p
T>10 GeV and at least one with p
T>20 GeV; at least three jets with
|η|<2.5 and p
T>50 GeV at least one of which must have p
T>100 GeV. Note that in contrast to the SUSY one-lepton search selection given in Sec. 2.1 only three jets are required, since the misidentified lepton or tau can produce the fourth jet.
For t t ¯
→b b` ¯
ν`νevents the two leptons, two b jets and the x- and y-components of the E
Tmiss-vector satisfy the following kinematic constraints:
(
p
ν+p
`+)2=m
2W, (pν¯+p
`−)2=m
2W, (pν+p
`++p
b)2=m
2t, (pν¯+p
`−+p
b¯)2=m
2t,p
νx+p
ν¯x=E
T,xmiss,p
νy+p
ν¯y=E
T,ymiss,(3) where p
`±, p
ν/ν¯, p
b/b¯are the lepton, neutrino and b-quark momenta respectively and m
Wand m
tare the W boson and top quark masses. We assume that the only source of E
Tmissis a pair of neutrinos, which is a fair assumption as shown in the previous section.
The final state contains two unknown neutrino momenta and the above system of equations has a two- or four-fold ambiguity, as the solution is given by a quartic equation which can be solved with standard analytical techniques [8]. Since there are at least three jets in each event, all possible combinations of jet pairs made from the three highest p
Tjets are considered. Jet pairs for which the above system of equations has real solutions are denoted as b-jet pairs
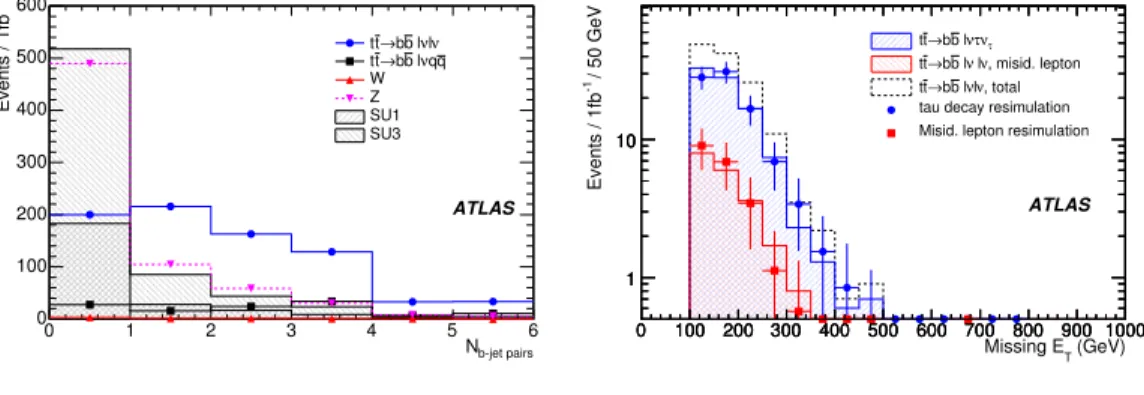
4). Figure 7 (left) shows the number of b-jet pairs for the various processes contributing to the control sample.
Replacement procedure Each event in the control sample is used as a seed for producing a series of resimulated events. One of the two identified leptons in the seed event is replaced by tau lepton and a set of 1000 tau decays are simulated using the TAUOLA package [9]. The same procedure is repeated for the
4)Note that within this section only kinematical conditions have used to identify these b-jet pairs – no secondary-vertex requirement is used.
b-jet pairs
0 1 2 3 4 5N 6
-1Events / 1fb
0 100 200 300 400 500 600
ATLAS lν lν b b tt→
q q lν b b tt→ WZ SU1SU3
(GeV) Missing ET
0 100 200 300 400 500 600 700 800 900 1000 / 50 GeV-1Events / 1fb
1 10
0 100 200 300 400 500 600 700 800 900 1000 1
10
0 100 200 300 400 500 600 700 800 900 1000 1
10
ντ τ lν b
→b tt
, misid. lepton ν l ν l b b
→ tt
, total ν l ν l b b
→ tt
tau decay resimulation Misid. lepton resimulation
ATLAS
Figure 7: Left: distribution of number of b-jet pairs for events passing the control sample requirements in the kinematic reconstruction method. The fraction of t t ¯
→b b`ν ¯
`νevents with no b-jet pairs is dominated by events with at least one b jet which is not among the three highest- p
Tjets. Right: distribution of E
Tmissfor t t ¯
→b b`ν ¯
`νevents with one tau lepton and events with a misidentified lepton compared to the estimation from resimulated events with an integrated luminosity of 1 fb
−1. The requirement on the number of b-jet pairs is not applied to the resimulated events. The distribution of all t t ¯
→b b` ¯
ν`νevents is also shown.
second lepton in the seed event, yielding a total of 2000 events for every seed event. Each resimulated event is weighted by a factor of 1/
ε, where
ε, the identification efficiency for the replaced lepton, isestimated from simulations.
The contribution of events where one lepton evades identification is estimated as follows. If the replaced lepton is an electron then a jet with the same momentum is substituted instead of it. If the lepton is a muon it is replaced by a so-called stand-alone muon (defined as a track in the muon spectrometer with no match to a track in the inner detector) justified by the fact that most muons not passing the muon definition are stand-alone muons. This procedure is applied to each of the two leptons in the seed events, resulting in two resimulated events for each seed event. The resimulated events are re-weighted with
1−ε ε
.
For both kinds of resimulated events, the SUSY one-lepton search selection are subsequently applied.
As a closure test of the replacement procedures described above, the E
Tmissdistribution for resim- ulated t t ¯
→b b`ν ¯
`νevents passing the control sample selection apart from the requirement of b-jet pairs, is compared to the Monte Carlo prediction. The result is shown in Fig. 7 (right) and shows good agreement.
Normalization The number of t t ¯
→b b`ν ¯
`νevents in the signal region is estimated by scaling of the sum of described above contributions with two scaling factors. The first factor takes into account the other categories of t t ¯
→b b`ν ¯
`νevents that are not estimated by this method. This first factor is estimated from Monte Carlo to be R
MC=1.4
±0.1. The second normalization factor, R
b-
jetpair, takes into account the efficiency of t t ¯
→b b` ¯
ν`νevents to pass the requirement on the number of b-jet pairs;
it is defined as the ratio of resimulated events before and after the b-jet pair selection in a normalization region, 80
≤E
Tmiss≤120 GeV, and found to have the value R
b-
jetpair =1.4
±0.1(stat)
±0.1(syst).
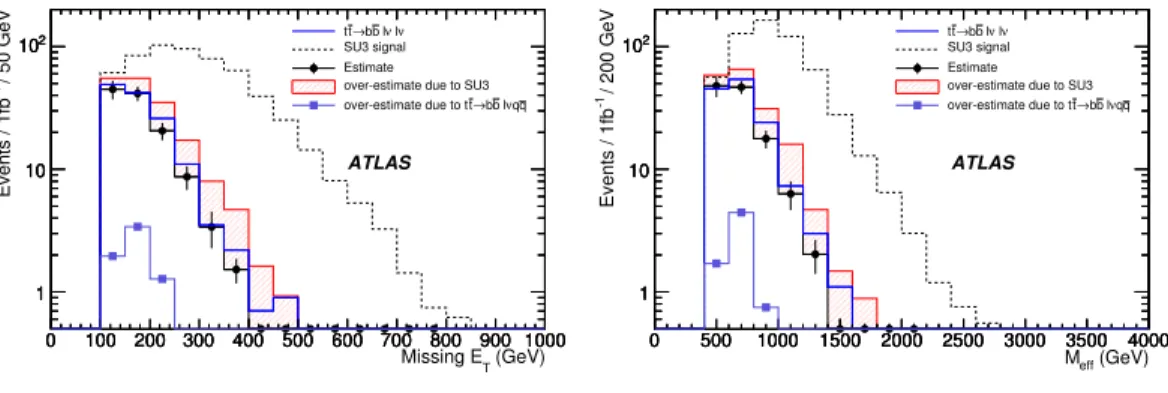
Presence of SUSY A possible SUSY signal could have an effect on the background estimation in two
ways: 1) by satisfying the kinematic constraints in Eq. 3 and therefore enter the control sample and 2) by
entering the normalization region giving a systematic contribution to the scale factor R
b-
jetpair. In Fig. 8
the estimated t t ¯
→b b` ¯
ν`νbackground is shown with and without the contamination of a SUSY signal
Table 8: Estimated background corresponding to an integrated luminosity of 1 fb
−1for different mSUGRA benchmark points. The second column shows the relative increase of the estimated back- ground with respect to the estimation without contamination from the SUSY signal. The third column shows the number of SUSY events. The Monte Carlo prediction of t t ¯
→b b`ν ¯
`νbackground in the one lepton search mode is 136 events. The errors in the first column are statistical only.
SUSY point Estimated Relative change True Signal
Background [%] Events
No signal 120±14
SU1 137±15 15 260
SU2 127±15 5.9 45
SU3 176±18 47 454
SU4 604±38 405 2960
SU6 129±16 7.8 162
SU8 124±14 3.8 100
(SU3) while Tab. 8 gives the estimated number of t t ¯
→b b` ¯
ν`νevents in the presence of different SUSY signals.
(GeV) Missing ET
0 100 200 300 400 500 600 700 800 900 1000 / 50 GeV-1Events / 1fb
1 10 102
0 100 200 300 400 500 600 700 800 900 1000 1
10 102
0 100 200 300 400 500 600 700 800 900 1000 1
10 102
ATLAS
lν lν b b tt→ SU3 signal Estimate over-estimate due to SU3
q q lν b b t→ over-estimate due to t
(GeV) Meff
0 500 1000 1500 2000 2500 3000 3500 4000 / 200 GeV-1Events / 1fb
1 10 102
0 500 1000 1500 2000 2500 3000 3500 4000 1
10 102
0 500 1000 1500 2000 2500 3000 3500 4000 1
10 102
ATLAS
lν lν b b tt→ SU3 signal Estimate over-estimate due to SU3
q q lν b b t→ over-estimate due to t
Figure 8: The E
Tmiss(left) and M
eff(right) distributions for the estimated and true t t ¯
→b b ¯
`ν`νcontri- bution for the one-lepton SUSY search. Black points (red area) represent the estimation without (with) the presence of a signal from SUSY (SU3).
Systematic Uncertainties The systematic uncertainties for this method are summarized in Tab. 9. The uncertainty from the replacement procedure is estimated by comparing number of resimulated events to the Monte Carlo prediction, see Fig. 7(right). The uncertainty of R
MCis estimated by comparing MC@NLO and ALPGEN. The statistical uncertainty of R
b-
jetpairis calculated using binomial errors.
The systematic uncertainty of this factor takes into account the difference in the shapes between E
Tmissdistribution of the resimulated samples with and without applying the kinematical constraints in Eq. 3.
The uncertainty due to background subtraction is dominated by the presence of t t ¯
→b bq ¯ q` ¯
νevents
in the control sample. The systematic effects resulting from uncertainties in the lepton identification
efficiency, the trigger efficiencies and the energy scale and resolution are expected to be much smaller.
Table 9: Breakdown of systematic uncertainties in the kinematic reconstruction method.
Source Contribution [%]
Replacement 10
RMC 10
Jet Energy Scale 9
Rb-jetpairstat. 9
Rb-jetpairsyst. 8
Background Subtraction 3 Jet Energy Resolution 1
ETmiss scale 1
Total 21
2.3.4 Dileptonic top with one lepton missed: HT2
Introduction In this section we describe a method, denoted the “HT2 method”, to estimate background from dileptonic t t ¯ production where one of the leptons is not identified. It relies on the (near) indepen- dence of E
Tmissand the variable HT2. This variable is defined as:
HT2
≡∑
4i=2
p
jetiT +p
leptonT .(4)
In the HT2 method, the shape of the E
Tmissdistribution is estimated from dileptonic t t ¯ events with low HT2. This distribution is then normalized to the number of events at large HT2, but with low missing E
T, and can then be used to estimate the remaining backgrounds in the signal region of large HT2 and large E
Tmiss.
For this method to work, the shape of the E
Tmissdistribution needs to be independent of HT2. Note that in Equation 4, the leading jet p
Twas excluded from the sum in order to reduce the correlation with E
Tmiss. The correlation between the hightest-p
Tjet and E
Tmissis likely to be due to simple kinematics, i.e.
to first approximation, the rest of the event recoils against this leading jet. This is illustrated in Figure 9 which shows the E
Tmissdistribution (at Monte Carlo “truth level”) in slices of leading and sub-leading jet p
T. The reduced dependence of the E
Tmissshape on the jet p
Tin the second-leading jet case is apparent, and will be further diminished by detector resolution effects.
Truth Missing E_T [GeV]
0 100 200 300 400 500 600 700 800 900 1000
Arbitrary units
10-4
10-3
10-2
10-1
pt1 = [0,100] GeV pt1 = [200,300] GeV pt1 = [400,500] GeV
ATLAS
Truth Missing E_T [GeV]
0 100 200 300 400 500 600 700 800 900 1000
Arbitrary units
10-4
10-3
10-2
10-1
pt2 = [0,100] GeV pt2 = [200,300] GeV pt2 = [400,500] GeV
ATLAS
Figure 9: Missing E
Tdistribution in “lepton+jet” t t ¯ events with M
T>100 GeV at Monte Carlo “truth”
level. Left: as a function of truth leading-jet p
T. Right: as a function of truth second-leading jet p
T.
To further reduce the correlation between HT2 and E
Tmiss, the E
Tmisssignificance was used. This is
to remove the correlation which arises from the fact that the E
Tmissresolution depends on
∑ET, where
∑
E
Tis clearly related to HT2. A simple form of E
Tmisssignificance was used here, defined as E
Tmisssignificance = E
Tmiss/[0.49
·√∑ET].
The results shown here are from a data sample consisting of the sum of t t ¯ (semi-leptonic and dilep- tonic decay modes) plus W(lν )+jets (where l
=e
,µ,τ). The trigger used in this analysis was the logicalOR of the 4j50 multi-jet, the e22i single electron and the mu20 single muon triggers [7].
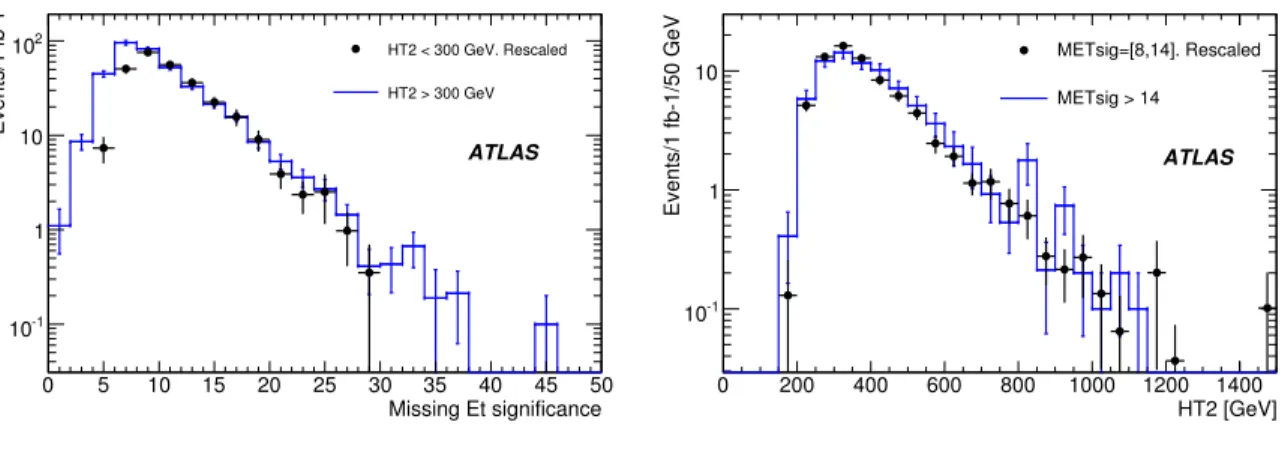
A control sample defined by HT2
<300 GeV was used to estimate the shape of the E
Tmisssignificance.
The assumption is that this shape is independent of HT2 so it can be used to predict the shape of the E
Tmisssignificance in the signal “band” defined by HT2
>300 GeV. The normalization of the prediction in the signal band was obtainined by the number of events with HT2
>300 GeV, but at low E
Tmiss, specifically 8
<ETmisssignificance
<14. A comparison of this predicted background with the correct background is shown in Figure 10 (left). The agreement between the predicted background and the actual background in Fig. 10 is reasonable, indicating that the correlation between HT2 and E
Tmisssignificance is small. A numerical comparison of predicted and actual background levels can be seen in Table 10. For each value of the E
Tmisssignificance cut, a rough equivalent in E
Tmissis listed as a guide, but it should be emphasized that the cut in E
Tmissis not sharp. The number of events is for HT2
>300 GeV, which corresponds approximately to a cut on the effective mass of M
eff >600 GeV.
Table 10: Predicted and actual background levels as a function of E
Tmisssignificance cut for an integrated luminosity of 1 fb
−1in the HT2 analysis. A rough equivalent E
Tmisscut is listed, but the E
Tmisscut is not sharp.
ETmiss sig. cut Rough equivalentETmiss cut [GeV] Predicted BG Actual BG
14 180 57.3±5.5 60.6±3.2
16 200 34.8±4.5 39.2±2.6
18 220 19.1±3.1 23.6±2.0
20 240 10.1±2.1 15.1±1.5
22 260 6.2±1.8 9.8±1.2
24 280 3.8±1.5 6.2±0.9
26 300 1.3±0.7 3.5±0.6
The ratio of observed to predicted backgrounds for a E
Tmisssignificance cut of 14 is 1.06
±0.12; while the ratio is consistent with unity, we take the uncertainty on the ratio (12%) as a systematic uncertainty due to possible correlations between HT2 and E
Tmisssignificance. Monte Carlo samples with larger numbers of events would provide one possible way to further study the potential for correlations.
The distribution of the “orthogonal” variable, namely HT2, was predicted in a similar way. The HT2 distribution was measured in a control region defined by 8
<E
Tmisssignificance
<14. This distribution was then normalized to the number of events at large E
Tmisssignificance and low HT2, specifically, E
Tmisssignificance
>14, and 150 GeV
<HT2
<300 GeV. The results are shown in Fig. 10 (right).
The near independence of HT2 and E
Tmisssignificance should provide an important tool in under- standing jet energy and E
Tmissperformance in the complex events that make up the background to SUSY searches. After all the SUSY selection cuts have been applied, the jet energy performance can be studied by looking at the HT2 distribution for low E
Tmissevents; conversely, the E
Tmissdistribution can be studied by selecting events with low HT2. Events in the tails of these distributions can be examined for signs of detector problems.
Systematic uncertainties due to detector miscalibrations The results of systematic uncertainties due
to detector performance are summarized in Table 11. The energy scale variations change the background
Missing Et significance
0 5 10 15 20 25 30 35 40 45 50
Events/1 fb-1
10-1
1 10
102 HT2 < 300 GeV. Rescaled
HT2 > 300 GeV
ATLAS
HT2 [GeV]
0 200 400 600 800 1000 1200 1400
Events/1 fb-1/50 GeV
10-1
1
10 METsig=[8,14]. Rescaled
METsig > 14
ATLAS
Figure 10: Left: Points: Predicted E
Tmisssignificance distribution in a t t ¯ plus W
+jets sample. His- togram: actual E
Tmisssignificance distribution. Right: Predicted HT2 distribution in the same sample.
Histogram: actual HT2 distribution.
Table 11: Predicted and actual background levels (for 1 fb
−1, HT2 method) for E
Tmisssignificance
>14 as a function of systematic effects applied to the reconstructed objects.
Modification Predicted BG Actual BG Actual/predicted Baseline 57.3±5.5 60.6±3.2 1.05±0.12 Energy scaled up 64.1±5.5 79.3±3.7 1.24±0.12 Energy scaled down 45.5±4.5 47.3±2.7 1.04±0.12 Jet resolution smearing 55.5±5.1 65.3±3.4 1.18±0.12
level by about 30% while the worsening jet energy resolution results in about a 10% increase in back- ground. However the predictions tend to change in the same direction as the actual backgrounds, and generally continue to provide reasonable determinations. We assign a 20% systematic uncertainty due to detector effects.
Systematic uncertainties due to event generation parameters The systematic uncertainties in the method due to changes in Monte Carlo event generation parameters were studied with ALPGEN. The parton p
Tcut in ALPGEN was changed from 40 to 15 GeV and the renormalization scale was reduced by a factor of 2. The results of the studies are summarized in Table 12. We assign a 20% systematic uncertainty due to event generation uncertainties.
Table 12: Predicted and actual background levels (for 1 fb
−1, HT2 method) for E
Tmisssignificance
>14 as a function of changes in the Monte Carlo generation parameters.
Modification
tt¯ W+jets Predicted BG Actual BG Actual/predicted PT40, scale 1.0 PT40, scale 0.5 73.3±5.8 63.9±3.2 0.87±0.11 PT40, scale 0.5 PT40, scale 0.5 133.8±7.2 109.2±3.6 0.82±0.05 PT15, scale 1.0 PT40, scale 0.5 91.1±12.6 72.5±6.0 0.80±0.13