Ultimate Resolution X-ray
Spectroscopy of Chemical-Effects in Manganese Compounds
Inaugural-Dissertation zur
Erlangung des Doktorgrades
der Mathematisch-Naturwissenschaftlichen Fakultät der Universität zu Köln
vorgelegt von
Malkhaz Jabua
aus Zugdidi, Georgien
Berichterstatter:
Prof. Dr. D. Gotta, Prof. Dr. A. Zilges
Tag der mündlichen Prüfung 06.07.2016
ii
A BSTRACT
High-resolution X-ray spectroscopy offers a powerful tool to study the complex inner-shell interactions of electrons. Corresponding effects are particularly pronounced in the case of
3dtransition metals. Spectroscopic studies of compounds are widely used in order to obtain structural information both from energy shifts and line shapes by measuring valence-to- core or outer core-to-core transitions,
i. e.investigating mainly Kβ transitions. Applying ultimate-resolution spectroscopy in a suitable measurement geometry may allow to extend such studies also to the inner core transition Kα, though effects are much smaller here. For cases where energy shift or line shape points to specific compound structures, Kα lines have the advantage being by far the most intense transitions of an element’s characteristic X- radiation.
A sensitivity to small effects is accompanied by the need for energy calibrations to about 10 meV accuracy at energies in the few keV range. Therefore, the exact knowledge of the line shape is essential in order to associate a particular wavelength of the measured spectrum to serve as an X-ray standard, which in turn requires the exact knowledge of the spectrometer response. Typically, the peak value is chosen, where the measure for the accuracy is determined by the knowledge of the experimental response.
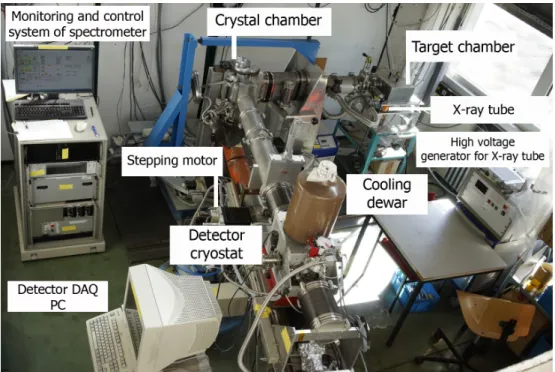
Measurements were done by using an ultimate-resolution Bragg spectrometer optimized for long-term high-statistics measurements. This type of spectrometer, equipped with spherically bent crystals, is set up at the Institut für Kernphysik at Forschungszentrum Jülich.
The measurements benefit from a suitable choice of target geometry, crystal mounting, and the use of charge-coupled devices as two-dimensional position-sensitive X-ray detectors set up within a vacuum system.
The case study has been performed for a variety of compounds of manganese, which is the transition metal with the half filled
3dshell generally being a particular stable configuration for ionic compounds. Kα and Kβ X-ray emission spectra have been measured under identical conditions providing consistency checks with the numerous Kβ data.
Peak energies of the Kα and Kβ lines were measured as envisaged to a precision of
10− 30meV and an almost model-free parametrization of the line pattern was achieved because
of the precise knowledge of the spectrometer response. Such a parametrisation may serve as
testing ground for detailed theoretical considerations.
Z USAMMENFASSUNG
Hochauflösende Röntgenspektrospie stellt ein wichtiges Werkzeug zum Studium der komplexen Vorgänge in den inneren Schalen der Atome dar. Die Effekte solcher Wech- selwirkungen sind besonders stark ausgeprägt im Bereich der
3d-Übergangselemente.Bei den Kβ-Übergängen sind spektroskopische Methoden weit verbreitet, um aus En- ergieverschiebungen und Linienbreiten Strukturinformationen für chemische Verbindungen abzuleiten. Für Kα Linien sollte dies mittels höchstauflösender Spektroskopie auch gelingen können, obwohl die Effekte hier wesentlich kleiner sind. Ein Vorteil ist jedoch, dass die charakteristische Kα-Strahlung am intensivsten ist.
Um auf kleinste Effekte sensitiv zu sein, müssen im einige keV-Bereich Energiebestimmungen mit einer Genauigkeit von ca. 10 meV erreicht werden. Für die Zuordnung einer Energie zu einer Linienstruktur bietet sich als ein ausgezeichneter Punkt das absolute Maximum an. Hierzu ist wiederum eine genaue Kenntnis der Auflösungsfunktion des Spektrometers erforderlich, um Ungenauigkeiten auf Grund der i. a. asymmetrischen Linienformen möglichst zu vermeiden.
Die Messungen wurden mit einem höchstauflösenden Bragg-Spektrometer durchgeführt, das für Langzeitmessungen optimiert ist. Das Spektrometer ist am Institut für Kernphysik des Forschungszentrum Jülich installiert und mit sphärisch gebogenen Kristallen ausgerüstet.
Für diese Messungen wurde eine speziell optimierte Geometrie der Fluoreszenztargets und der Kristallhalterung benutzt und zum Nachweis der Röntgenstrahlung ein "charge-coupled device" (CCD) eingesetzt. Alle Komponenten waren in einem Vakuumsystem integriert.
Die Fallstudie wurde am einigen chemischen Verbindungen von Mangan durchgeführt.
Mangan selbst ist das Übergangsmetall mit halb gefüllter
3d-Schale, die i. a. bei ionischenCharakter der Verbindung eine besonders stabile Konstellation darstellt. Kα- und Kβ- Übergänge wurden unter identische Bedingungen gemessen, wodurch eine Überprüfung der experimentellen Ergebnisse an Hand der Vielzahl von Kβ-Daten möglich wurde.
Bei der Energiebestimmung der Kα- und Kβ-Linien wurden die angestrebten
10−30meV erreicht. Eine nahezu modellfreie Parametrisierung der Linienstruktur wurde möglich wegen der genauen Kenntnis der Auflösungsfunktion, die zum Vergleich mit theoretischen Rechnungen herangezogen werden kann.
Die hier vorgestellte Arbeit beschreibt, dass die Auflösung kleiner, von der jeweiligen
chemischen Verbindung abhängiger Details der komplexen Innerschalenprozesse, auch beim
Kα-Dublett möglich ist, wenn höchstauflösende Röntgenspektroskopie eingesetzt wird.
A CKNOWLEDGEMENTS
The work presented in this thesis has been supported by the Forschungszentrum Jülich, Germany and the Shota Rustaveli National Science Foundation (SFNSF Georgia) joint Fellowship Grant #JS/4/4-120/12.
I would like to express my special appreciation and thanks to my supervisor Professor Dr.
Detlev Gotta, for being a tremendous mentor for me, for the continuous support of my PhD study and related research, for his patience, motivation, and immense knowledge. His guidance helped me in all the time of research and writing of this thesis. I would like to thank you for encouraging my research and for allowing me to grow as a research scientist.
Your advices and personal attitude during my research work have been valuable. I will never forget the first words of our very first dialogue: “don’t call me Professor Gotta, just call me by name, we are colleagues here”.
My sincere thanks also goes to Professor Dr. Dr. h.c. Hans Ströher, to the director of the Institute for Nuclear Physics at Forschungszentrum Jülich. For his effort to build strong scientific relationships between my home country, Georgia and Germany, for his permanent support that I was feeling through the whole time spent at research centre.
A special thank to Dr. Andro Kacharava, words cannot express how big his role is on my way starting as master student till now, at the end of my PhD study. He, as a kind of person was discovery for me. I could hardly imagine a person with so many positive and energetic characteristics. I can’t remeber time, I entered his office on bad mood, overloaded with some negative thoughts and left without positive impressions. Besides being an excellent scientist I found him as a person with unique skills of communicating with people and spreading the positive “charge” among them. Thanks Andro for always being my great friend and supporter.
I would like to gratefully acknowledge Dr. Hubert Gorke, Dr. Norbert Dolfus and Dr. Irakli Keshelashvili for their intensive and inestimable advices and instructive talks and practical guidance. Without them it would be hardly imaginable to successfully deal with crystal spectometer and detector electronics. Special thanks to Dr. Claire Besson for the preparation of the chemical compounds, for her continuous and comprehensive support during my experiments.
A warm thanks to Dr. Christian Weidemann, Prof. Dr. Khalid Rashid and Dr. David Mchedlishvili who always provided me with smart advices in a very detailed shape. I cannot forget the inspirational scientific and private talks with Thomas Krings and Dr. Illhan Engin.
Thank you for your amazingly supportive and friendly attitude. A special thank to Prof. Dr.
Andreas Zilges for his extremely interesting lectures on the physics of detectors.
I want to express my gratitude to all the members of the IKP of Forschungszentrum Jülich for their constant support and very familiar and positive atmosphere.
My warm gratitude to my family. I can’t express how grateful I am to my mother, father, my
brother, and my aunt for all of the sacrifices that they’ve made on my behalf. Your prayer for
me was what sustained me thus far. I would like to explicitly thank all of my friends who
heavily supported and encouraged me to strive towards my goal.
Special thanks to my German language teachers, for giving me the strong basis to communicate with my German friends on their own language and to feel the sole of this beautiful country.
viii
To my wonderful grandma, Vakona,
for her inspirational and motivational talks about the power of knowledge
C ONTENTS
. Abstract iii
. Zusammenfassung v
. Acknowledgements vii
1. Introduction 1
1.1. Motivation . . . . 1
1.2. Atomic structure . . . . 2
1.3. X-ray emission . . . . 3
1.4. Properties of manganese . . . . 6
1.5. Properties of manganese compounds . . . . 8
1.6. Level splitting . . . . 9
1.6.1. Spin-orbit coupling . . . . 9
1.6.2. Core-hole
3d-shell coupling . . .10
1.7. Theoretical considerations . . . . 10
1.8. Outline of thesis . . . . 11
2. High Resolution X-ray Spectrometry 13
2.1. X-ray diffraction . . . . 13
2.1.1. Bragg’s law . . . . 13
2.1.2. Rocking curve . . . . 15
2.2. Curved crystal spectrometers . . . . 16
2.2.1. Johann geometry . . . . 16
2.2.2. Energy resolution . . . . 18
3. Charge-Coupled Devices 21
3.1. Charge-coupled devices as radiation detector . . . . 21
3.2. Architecture and design . . . . 22
3.3. Fast frame transfer CCDs . . . . 23
4. Experimental Set-up 27
4.1. Mechanical set-up of the crystal spectrometer . . . . 27
4.2. X-ray tube . . . . 27
4.3. Target chamber and fluorescence targets . . . . 28
4.4. Bragg crystal . . . . 31
4.5. X-ray detector . . . . 32
4.6. Spectrometer operation and monitoring . . . . 33
5. Measurement set-up and procedure 37
5.1. Preparation of measurement . . . . 37
5.1.1. Pre-adjustment of geometry . . . . 37
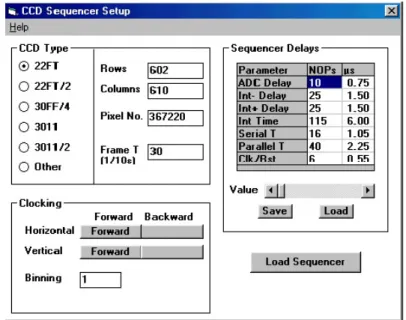
5.1.2. Detector calibration and start-up . . . . 37
5.1.3. X-ray tube . . . . 39
Contents
5.1.4. Crystal scan (positioning reflection on the detector) . . . . 39
5.1.5. Target scan . . . . 39
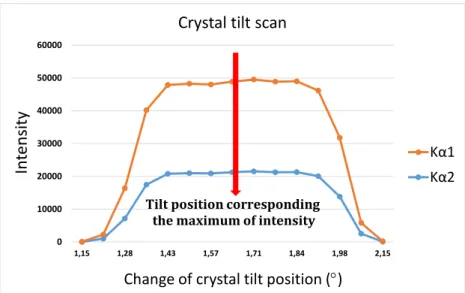
5.1.6. Crystal tilt scan . . . . 40
5.2. Measurement procedure . . . . 40
5.2.1. Alternating targets . . . . 40
5.2.2. Measuring sequence and duration . . . . 41
5.2.3. Background studies . . . . 42
5.2.4. Monitor for the spectrometer stability . . . . 43
6. Data analysis 45
6.1. Data processing . . . . 45
6.1.1. Raw data . . . . 45
6.1.2. Charge contents . . . . 45
6.1.3. Hit pattern and position spectrum . . . . 45
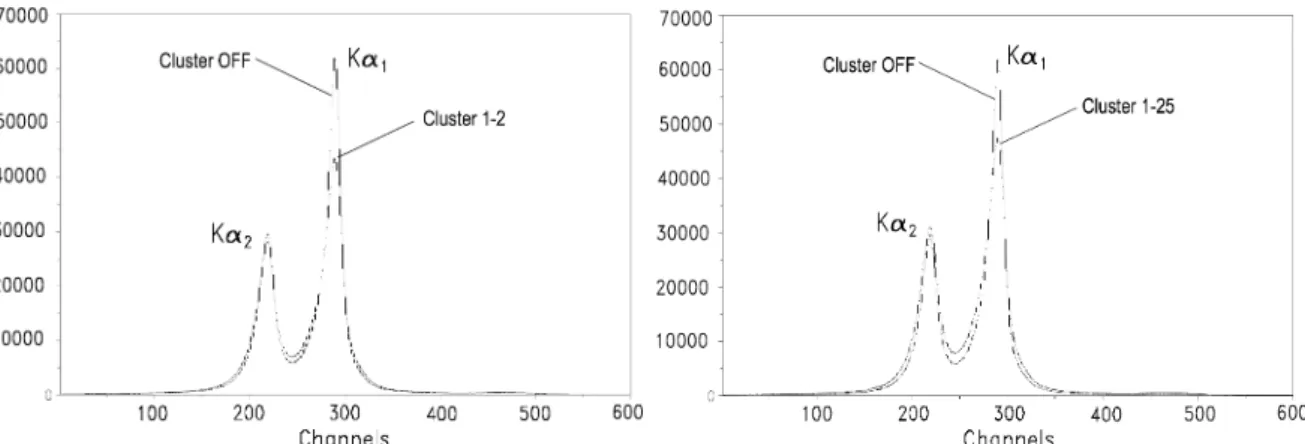
6.1.4. Cluster analysis and charge cuts . . . . 46
6.2. Spectrometer response . . . . 47
6.3. Spectra overview . . . . 49
7. Results 51
7.1. Fits to the line shape . . . . 51
7.2. Peak energies . . . . 52
7.3. Line shape of Kα spectra . . . . 53
7.4. Line shape of Kβ spectra . . . . 58
7.5. Line width and asymmetry factor . . . . 61
7.6. I
Kα2/I
Kα1intensity ratio . . . . 61
8. Discussion 63
8.1. Ordering by nominal ionisation number . . . . 63
8.2. Ordering by
3d-shell electrons . . .65
8.3. Line shape . . . . 67
8.3.1. Kα doublet . . . . 67
8.3.2. Kβ complex . . . . 67
8.4. Theoretical approach to the energy shift . . . . 68
8.5. High-spin vs. low-spin states . . . . 70
9. Summary 73 A. Appendix - CCD readout and clock sequencing 75 B. Appendix - Voigt profile 79 C. Appendix - High performance SCADA system for monitoring and control of crystal spectrometer 81
C.1. Concepts of SCADA systems . . . . 81
C.2. Labview
c-based SCADA system for the spectrometer . . . . 82
C.3. Spectrometer setting . . . . 83
C.3.1. Crystal angle
ΘCRY. . . . 83
C.3.2. Fine adjustment of crystal angle . . . . 88
C.3.3. Crystal tilt . . . . 89
C.3.4. Spectrometer arm angle
ΘARM. . . . 89
C.3.5. Crystal-detector distance (focal length
YCD) . . . . 90
C.3.6. Principle of working of the limit switches . . . . 91
xii
Contents
C.4. Monitoring of the spectrometer . . . . 92
C.4.1. Temperature measurements . . . . 92
C.4.2. Monitoring the vacuum . . . . 93
C.4.3. THERMOVAC vacuum gauge (Pirani method) . . . . 93
C.4.4. PENNINGVAC vacuum gauge (cold cathode method) . . . . 94
C.5. FieldPoint front-end . . . . 96
C.5.1. Fieldpoint modules . . . . 96
C.5.2. Temperature measurements . . . . 100
C.6. Labview
c-based block diagrams . . . . 101
C.6.1. Initialization of the communication port . . . . 101
C.6.2. Crystal axis control . . . . 101
C.6.3. Arm axis control . . . . 104
C.6.4. Detector axis control . . . . 104
C.6.5. Read Input/Output Port . . . . 105
C.6.6. Status of limit switches . . . . 105
C.7. Archiving the monitored data . . . . 106
List of Figures 108
List of Tables 111
Bibliography 115
. Erklärung 121
. Publikationen 123
. Lebenslauf 125
1. I NTRODUCTION
The shell structure of the atomic levels becomes apparent by the emission of characteristic X-radiation. The wavelengths of at least the main transitions are unambiguously attributed to a particular element
A(Z, N)which is synonymous to the nuclear charge
Z. Spectroscopicmethods contributed significantly to the understanding of the properties of matter governed by the laws of quantum mechanics.
High-resolution X-ray spectroscopy offers a powerful tool to study the electronic structure of atoms and molecules. It was immediately realized, that the simple hydrogen-like approach of one electron moving in a mean electric field had to be modified by a shell- dependent screening and a complex electron-electron and electron-hole interaction. Even more complex are molecular spectra which include also the interaction with valence electrons from neighbouring atoms.
Precision studies of such radiation traces back to X-ray diffraction by crystals discovered by von Laue and his collaborators in 1912 which resulted in the development of two complementary areas of research, (i) the study of crystal structure using X-rays and (ii) the investigation of atomic structure by emission spectra to high precision using diffraction in crystals. An estimate of the wavelength of X-rays already existed and von Laue calculated that the atomic spacing in a solid was of comparable dimension. He considered that a crystal may act like a diffraction grating and, consequently, tried to pass a narrow beam of X-rays through a zinc blende crystal, resulting in a pattern of diffraction spots on a photographic plate.
In this work, the characteristic X-radiation from a medium Z nucleus, manganese, is studied.
The transitions of such X-ray fluorescence in the few keV range have typically natural line width of the order of 1 eV. Hence, an energy resolution of the order of one electron volt (eV) or better is mandatory for precision studies which is achievable only with crystal spectrometers.
In this energy range, reflection-type Bragg spectrometers have to be used in order to minimise absorption.
1.1. Motivation
The experiment described here originates from the need to make precise energy calibrations at energies in the few keV range for ultimate resolution measurements of X-rays from light exotic atoms [1–3]. Experience from a similar case, where an ultimate energy calibration with scandium X-rays failed [4], led to the question as to what extent chemical shifts must be taken into account for a precise energy determination. For 6 keV, a case study using of manganese fluorescence X-rays began to be applied in a precise determination of barium Lγ
2,3transition [5, 6].
Inspection of the literature reveals that for manganese Kα transitions the data base for
compounds is rather scarce. If mentioned at all, the accuracy for the line energy is of the
order of 100 meV. Also unsatisfactory is the status for an accurate quantification of the line
shape, which makes it impossible to reach the ultimate level of calibration of about 10 meV.
1. Introduction
For these reasons the measurements here aim at a precision as was achieved for the metallic state of the
3dtransition elements [4, 7–9], which will serve as energy calibration standard for the
Kαand
Kβlines measured for the compounds. A recent review on the
3dtransition metal complexes may be found in [10, 11].
For the Kβ transition, plenty of data are available. Therefore, such data can be used as consistency check for the spectra recorded with this apparatus. It will turn out, however, that previous data are partly contradictory and this experiment is able to provide supplementary high-quality information.
Obviously, having an ultimate resolution device at hand, it makes sense to study at this occasion the complex inner-shell interactions of electrons in manganese. In particular, because effects are rather pronounced in the case of the
3dtransition elements, as it can be seen,
e. g.directly from the well known anomalous
Z-dependence of the Kα line widths [12].
Spectroscopic studies of compounds are used in order to obtain structural information both from line shifts and line shapes by measuring valence-to-core or outer core-to-core transitions like the Kβ
1,3complex, where the influence of ligands is clearly noticeable [10].
The Kβ
1,3satellite transitions K’, K", or K
2,5(see Chap. 1.3) are very sensitive to the chemical environment and, therefore, can be used for a chemical characterisation even with medium resolution devices [10, 13, 14].
Chemical effects are less pronounced for the most inner core-to-core transition Kα. However, applying ultimate resolution spectroscopy in a suitable measurement geometry should allow to extend such studies also to these transitions. For cases where energy shift or line shape point to specific compound structures, Kα lines have the advantage being by far the most intense transitions of an element’s characteristic X-radiation.
In order to achieve an energy calibration at the level of 10 meV, the exact knowledge of the line shape is an essential requirement in order to associate a particular wavelength of the measured spectrum to serve as an X-ray standard. Typically, the peak value is chosen, where the measure for the accuracy is determined by the knowledge of the experimental response.
Sufficient knowledge of the resolution function given, allows a detailed parametrisation of the line shape with the spectrometer response removed, the response of an arbitrary detector can be modelled and a possible offset is under control. Such high quality of the data enables future detailed comparisons with results of theoretical calculations, which in view of the variety of effects and of the complicated structure of compounds may be left to experts in the field.
A complementary tool to access the electronic structure of atoms is photo-electron emission spectroscopy or X-ray absorption which detects electrons after atom excitation [15–18]. The creation of a hole in the
2pshell,
e. g.represents the final sate of the excited atom after K X-ray emission. The results may be compared to the work presented in this thesis, which provides information about so called characteristic X-ray emission spectra, which studies the energy release in de-excitation as electromagnetic radiation stemming from a
1score-vacancy transition.
1.2. Atomic structure
The shell structure of the electron orbits around the central charge
Zare determined by the quantisation of the action and the Pauli exclusion principle. Quantisation manifests in a finite value for the quantity
h, the Planck constant, and the Pauli principle states that two fermionscannot occupy the same quantum state.
2
1.3. X-ray emission
The Bohr model first takes into account the appearance of energy shells, which is characterised by the principal quantum number
n. The value of nranges from 1 to the shell containing the outermost electron of that atom,
i. e. n = 1,2, .... This model stillignores an angular momentum of the electron’s orbit, which is also quantized and given by the azimuthal quantum number
`requiring an extension: the Bohr-Sommerfeld model. It describes the subshell and with that the shape of the orbital and ranges for a given
nfrom
`= 0−(n−1). The length of the orbital angular momentum vector is given by the relation
~p
`(`+ 1), where ~ = 2πh
is the reduced Planck constant. In chemistry and spectroscopy,
`= 0,1,2, and 3 are called ans, p, d, andf
orbital.
Each orbital angular momentum state may split in
2`+ 1substates, which corresponds to the possibilities of projecting the total angular momentum to an external magnetic field direction leading to an energy splitting. These levels are characterised by the magnetic quantum number
m`. The corresponding projection is
Lz = ~m`, where values of
`range from
−lto
+lin integer steps. With any angular momentum associated is an also quantised magnetic moment which originates in a classical picture from the circular current owing to the electron’s orbit.
First evidence, that the electron itself possesses an intrinsic angular momentum came from the fine structure splitting of spectral lines. It turned out, that the electron spin vector has length
~·q1
2(12 + 1)
and two projections
SZ =±~2relative to an external field. These states refer to “spin up” and “spin down” states. The magnetic moment, however, is twice as large as expected from spin
12,
i. e.the
g-factorg = 2, and is only explained within the relativistictreatment (Dirac theory). Angular momentum of an electron and its spin add to the total spin
jleading to the two possible combinations
j=`±12.
Each electron in any individual orbital must have different quantum numbers because of the Pauli exclusion principle,
i. e.no electron has the same set of quantum numbers (n, `, m
`, ms).
Hence, the maximum occupation numbers for
s, p, d, ...states are 2, 6, 10, ... leading to the ordering scheme of elements well-known as periodic table.
The atomic energy levels can be determined in a good approximation based on the levels of the hydrogen-like atoms under consideration of the electron shielding of the Coulomb field of nucleus by the other electrons. Then the binding energy is given by [19]
E(n, l, j) =R· MA
MA+m[(Z−σV)2
n2 +α2(Z−σI)4 n4 ( n
j+12 −3
4)].
(1.1)
Here,
R = R∞ · hc = mc2α2/2 = 13.6eV is the Rydberg energy,
MA- nuclear mass, m - electron mass,
Z- atomic number,
j- total angular momentum quantum number,
α-Sommerfeld fine-structure constant (α
≈ 1371),
σV- complete shielding, and
σI- internal shielding.
The first term, which includes the kinetic and potential energies, represents the main part of the binding energy. The smaller second (fine structure) term represents the interaction energy of magnetic moments from spin and angular momentum.
1.3. X-ray emission
Characteristic X-ray emission spectra stem from photon emission when refilling inner-shell
holes produced,
e. g.by photo effect (see Fig. 1.1). In X-ray spectroscopy, two notations are
commonly used. An X-ray transition,
e. g.Kα
1denotes the electron transition from the
2p3/21. Introduction
to the
1slevel, which corresponds to the hole or vacancy transition in the opposite direction
1s−1→2p−13/2.
The width in energy
Γof an X-ray line depends on the life time (τ ) of the involved quantum states which is related to the transition probability
Pby
τ = P1. According to Heisenberg’s uncertainty relation, the life time corresponds to an energy spread
Γof the transition given by
Γ2 =~·P.
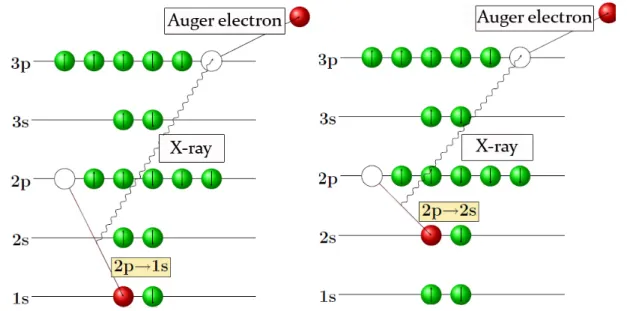
Fig. 1.1. :Schematic representation of the photoionisation and the emission of the characteristic X-rays through the electron transitions.
Radiation-less de-excitation for inner-shell holes occurs by Auger transitions (Fig. 1.2 – left).
Here, the energy release when refilling an inner-shell vacancy is transferred to an electron in a higher shell, which is emitted from the atom if the binding energy is exceeded. If the Auger transition occurs within the same main shell, these processes are denoted Koster- Kronig transitions (Fig. 1.2 – right).
Radiative and Auger transitions are competitive processes which depend differently on the atomic number. As decay probabilities add up, the total width
Γof the transition is given by the sum of radiative and Auger widths
Γ = ΓX + ΓA. In light atoms
(Z ≤30)Auger effect dominates also for K transitions, which is seen from a K fluorescence yield of less than 50%
[20].
The natural line shape of an X-ray transition is described by a Lorentzian
I(E0−E) = Γ2π
1
(E0−E)2+ Γ2/4,
(1.2) where
E0is the centre energy with the integral
R∞−∞I(E0 − E)dE = 1. The width Γ
corresponds to the full-width half-maximum (FWHM) of the Lorentz curve.
In the absence of external electromagnetic fields, a characteristic X-ray transition is characterised already by the two sets initial and quantum numbers
(n, j)(Tab. 1.1). In an idealised atom, where an electron changes its place ignoring any coupling with other electrons or holes in the atomic shell, a single energy can be attributed to initial and final state and, hence, to the transition. Such lines are called diagram lines and are realised approximately almost exclusively for low-lying atomic levels not affected by coupling to outer shells and binding effects.
In light atoms dipole transitions dominate (|∆l|
= 1;|∆j|= 0,1; ∆n6= 0). The only (electric)quadrupole transition (
|∆l| = 2;|∆j| = 0,1,2)appearing within this experiment is the Kβ
5quadrupole transitions at the high energy side of the Kβ
1,3doublet.
4
1.3. X-ray emission
Fig. 1.2. :Schematic representation of the Auger and Coster-Kronig transitions.
Besides the described diagram lines, X-ray spectra exhibit a more complex structure. At first, the ionisation process may lead to multiple vacancies. Such additional vacancies occur predominantly in higher shells of binding energy, where the exceeding energy of excitation of deep-lying holes is used for ionisation. The corresponding change of the electron-density distribution compared to a singly ionised atoms changes the level energies.
The proper description of the atomic shells constitutes a many-body problem which is solvable only approximately. All electrons influence each other by the direct electron-electron Coulomb interaction and symmetries in quantum mechanics require to consider exchange interaction because electrons are identical particles. The coupling between core holes and outer shells leads to an additional level splitting, which however is difficult to resolve for Kα transitions in view of the comparably large natural line width
Γ. In contrast, for the Kβcomplex, the Kβ
0line appears well separated from the Kβ
1,3transition [10].
One example on the short wavelength side is represented by the group of Kα satellites in particular visible in the range of the
3delements
Z = 21−30(α
0, α3, α03and
α4) [21, 22]. They arise when besides an
1shole one more electron is missing in L shell (Tab. 1.1). Additional vacancies in the M shell can appear on the short (3p hole) and the long wavelength side (3d hole). Such satellites are much closer in energy to the diagram lines.
Table 1.1. :Notation of Kαand Kβtransition energies. EI and MO denote possible contributions from the exchange interaction and molecular orbit formation [10]. For the multiple ionisation case describe the additional terms the coupling of the single angular momentum,2S+1L withL=P
l andS=P
s
Kα
1 1s−1 → 2p−13/2Kβ
1 1s−1 → 3p−13/2Kα
2 1s−1 → 2p−11/2Kβ
3 1s−1 → 3p−11/2Kα
3 1s−12p−1 3P → 2p−2 3PKβ
2 1s−1 → 4p−11/2,3/2Kα
4 1s−12p−1 1P → 2p−2 1DKβ
5 1s−1 → 3d−15/2,7/2Kα
0 1s−12p−1 1P → 2p−2 1SKβ
0 1s−1 → 3p−1+ EIKα
30 1s−12s−1 1S → 2s−12p−1 3PKβ” 1s
−1 → 3p−1+ MOKα
00 1s−13p−2 → 2p−13p−21. Introduction
More complicated are satellite structures in solids and compounds. Valence orbitals of the emitting atoms overlap with orbitals of the neighbouring atoms and molecular orbitals (MO) are formed constituting the bond. As a result, so called cross transitions between the different ions can occur. Such effects are seen in the Kβ regime [10].
E. g., the Kβ5emission band denotes the electrical quadrupole hole transitions from
1s−1to
3d−15/2,7/2states which is actually mixed with
pstates of the ligand. For
73 ≤Z ≤ 80this can be proven by means of the intensity ratio of the Kβ
5to the Kβ
1transitions. A scheme for the K fluorescence complex is shown in Fig. 1.3 [10].
Fig. 1.3. :Simplified energy scheme for K fluorescence emission [10]. The different radiative decay channels of the 1s vacancy give rise to the K fluorescence spectrum. The continuum electron that occurs after 1s photoionization is neglected in the intermediate and final states. Atomic configurations are used for simplicity.
In summary, the complexity of the X-ray spectra and the structure of the satellite spectrum gives insight in structural and bond information of the atom’s environment and the status of its outer shells, among others the spin state of an incomplete
3dshell. manganese.
1.4. Properties of manganese
The experiment described in this work is a study of the element manganese and some of its compounds. Manganese, having the atomic number
Z = 25, is a metallic element of 7thsubgroup of the periodic system. The nominal ground-state configuration of its atomic shells is
[1s22s22p63s23p63d54s2]. From the group of3delements it is the one with a half full
3dshell (see Fig. 1.4).
With the fraction of 900 ppm after iron and titanium it is the heavy metal with highest appearance on the crust of the earth. It plays a decisive role in the oxygen production by the photosynthesis of plants. The only stable isotope of manganese is
55Mn. Manganese appears —depending on pressure and temperature— in four different modifications. At room temperature until
700◦C the
α-type modification, a cubic structure is found. Between 700−1070◦C the
β-modification (sc) and between1079−1143◦C the
γ- modification (fcc)is stable. At higher temperatures a
δ- modification (bcc) exists and at≈ 1250◦C the melting point is reached [23] (see Fig. 1.5). The characteristics of the different modifications, as well as magnetic properties are described in [24].
The experiment described here is performed at room temperature,
i. e.only the
α-typemodification of manganese is used. Metallic lattices are of considerable complexity. So,
6
1.4. Properties of manganese
α-type Mn consists of 58 atoms per unit cell with four non-equivalent sites [25]. From the
conductivity, one concludes a free electron density equivalent to 1.95 per atom [26]. Hence, the electron shell configuration at the atom site is practically
[1s22s22p63s23p63d5], i. e.the 2
4selectrons are non-localised. The magnetic moment of the various sites of the unit cell almost compensate. The magnetic susceptibility is a factor of about 30 smaller compared to Mn(II) compounds [27].
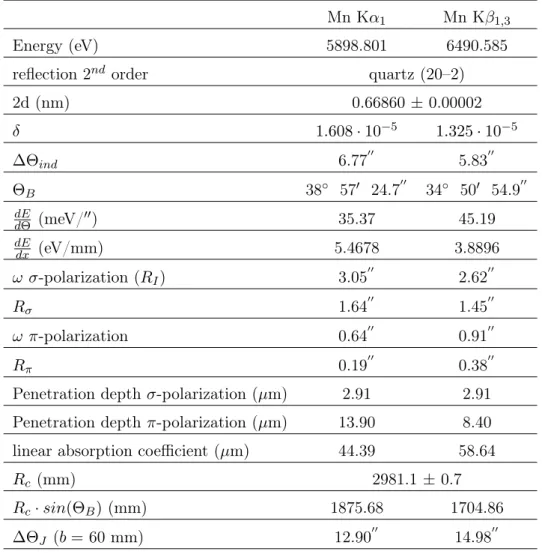
For this metallic configuration, the Kα and Kβ X-ray energies have been measured to high accuracy [8]. These results constitute the absolute energy calibration for the crystal spectrometer (see Chap. 7). The K series fluorescence yield of manganese is about 30% (in numbers 0.308) [20], the intensity ratio Kβ/Kα was measured to be 0.140 [8].
Fig. 1.4. :Binding energies and nominal electron configuration of manganese.
Manganese
Temperature
fluid
Fig. 1.5. :Phase diagram of manganese.
1. Introduction
1.5. Properties of manganese compounds
In compounds, nominal oxidation numbers are attributed to the constituents. It denotes the number of transferred electrons according to the stoichiometric formula of the compound, which is, however, in general only a crude approximation to the true electron distribution.
Nevertheless, it provides a classification reflecting the occupation of outer shells. For manganese oxidation states from
−3to
+7have been observed. The most common ones are
+2,+3,+4,+6, and +7, which correspond to ionisation numbers II, III, IV, VI, and VII.In this experiment, compounds with manganese atoms in the states Mn(0), Mn(I), Mn(II), Mn(II), Mn(IV), Mn(V), and Mn(VII) have been studied (Tab. 1.2).
The ordering scheme maybe refined by using electronegativity (EN). EN is defined as a measure of the capacity of an atom to attract an electron participating in a chemical bond.
Value reach from 0.7 for francium (actually disposal of the valence electron) up to 4.0 for fluorine (acceptance of an electron) in order to approach as much as possible the noble gas configuration of the valence shell. EN of manganese, carbon, and oxygen are 1.55, 2.55, and 3.44 according to the Pauling scale. Chemical bonds are between the extremes covalent for elements of similar EN where the delocalisation of valence electrons of all constituents form the bond, and ionic where the valence electrons are either completely donated or accepted.
According to Pauling, the ionic character is given by
(1−e−(∆χ2 )2), where∆χis the difference of EN. Ionic character values for manganese involved bonds are: MnO - 59%, MnF - 78%, MnC - 22%.
Formal oxidation numbers correlate with the number of electrons remaining in the
3dshell.
For Mn(II), all 5
delectrons remain, where for Mn(VII) the
3dshell is completely empty.
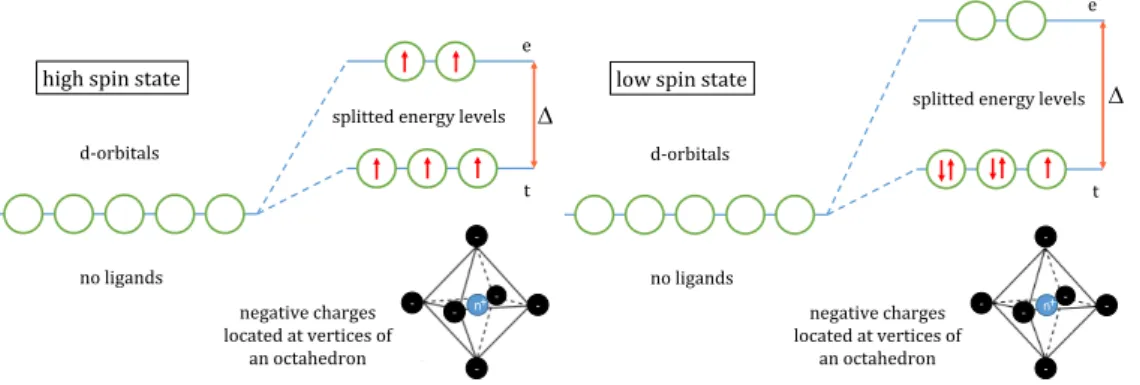
Embedded in a structure like a crystal, the complete energy degeneration (in absence of spin-orbit interaction) of the 5d orbitals is removed. As known from coordination chemistry, compounds of
3delements with high ionic character often form the maximum spin because it is lower in energy than pairwise compensated. As a rule of thumb, high-(low-)spin states are formed when the interaction energy
∆due to the ligand field is small (large).
Fig. 1.6 demonstrates the scheme of energy splitting for the octahedral crystal structure of manganese.
Thus, high-spin states up to
S = 52are possible for Mn because only incomplete shells contribute. The electrons forming these states are denoted unpaired and their number
nunpcan be read off from the ionisation number (Tab. 1.2). The existence of these high-spin states is proven from the measurements of the magnetic moment, which also show that angular momentum contributions from the
3delectrons are quenched [10, 28]. In this case, the magnetic moment
µis given exclusively by the spin part
µ =gpS(S+ 1)µB
with
µBbeing the Bohr magneton and
g= 2being the
g-factor for fermions.The crystal structure of the various compounds may influence the atomic levels. The compounds studied in this work are all of octahedral structure (typical for the complex chemistry of
3delements), except the one of the MnO
−4anion in KMnO
4which is tetrahedral.
Octahedral and tetrahedral structures have configuration numbers 6 and 4,
e. g.6 and 4 nearest neighbours. These two geometries have been used for an attempt to reproduce the energy shifts by means of a molecular orbital calculation (see Chap. 8). Tab. 1.2 shows the basic parameters characterising the Mn compounds used.
8
1.6. Level splitting
d-orbitals
no ligands
splitted energy levels high spin state
t e
-
- -
- -
- n+
negative charges located at vertices of
an octahedron
d-orbitals
no ligands
splitted energy levels low spin state
t e
-
- -
- -
- n+
negative charges located at vertices of
an octahedron
Fig. 1.6. :Energy splitting scheme for the octahedral crystal structure of manganese.
Table 1.2. :Crystallographic parameters of measured Mn compounds.
ionisation no of unpaired Crystal structure Unit cell Space group
no. electrons (a,b,c in A;α, β, γin◦)
Mn (metal) body - centered cubic 8.912, 8.912, 8.912; 90.0, 90.0, 90.0 I 43m
Mn(0) 0 5 monoclinic 14.160, 7.110, 14.670; 37.5, 105.0, 37.5 I2/a
Mn(I) I 4 monoclinic 11.990, 7.070, 10.930; 31.1 117.8 31.1 P21/a
MnF2 II 5 tetragonal 4.873, 4.873, 3.310; 90.0, 90.0, 90.0 p42/mnm
MnO II 5 Halite (cubic), cF8 4.536, 4.536, 4.536; 90.0, 90.0, 90.0 Fm¯3m (225)
Mn(CH3COO)2 II 5 monoclinic/tetrahydrate 9.099, 17.600, 19.560; 42.74, 94.52, 42.74 p42/mnm
MnF3 III 4 Monoclinic/octahedral 8.920, 5.047, 13.474; 90.0, 92.62, 90.0 C2/c(15)
Mn2O3 III 4 cubic 4.506, 4.506, 4.506; 90.0, 90.0, 90.0 Ia¯3(206)
MnO2 IV 3 tetragonal 4.398, 4.398, 2.877; 90.0, 90.0, 90.0 D4h14−P42/mnm
Mn(V) complex* V 2 monoclinic 14.261, 8.620, 8.620; 42.906, 94.188, 42.906 P21/c
KMnO4 VII 0 orthorhombic 9.09, 5.72, 7.41 D2h16−P nma
1.6. Level splitting
1.6.1. Spin-orbit coupling
The energy splitting of the Kα lines, representing the hole transition
1s3dn → 2p53dn, is dominated by a strong spin-orbit coupling,
i. e.the interaction of the magnetic moment of the electron with the magnetic field created due to its orbit in the nuclear Coulomb field. In the simple case of an ion with complete shells and one inner-shell hole, the fine-structure splitting relative to the energy centre of gravity of the multiplet reads
E =−ξ
2 ·[j(j+ 1)−`(`+ 1)−s(s+ 1)],
(1.3)
where
ξis the spin-orbit interaction parameter. As
j = `± 12and
s= 12, the splitting for the fine-structure doublet is
∆E= ξ
2 ·(2`+ 1).
(1.4)
In the case of Mn Kα,
∆Eamounts to about 11 eV [29].
The spin-orbit parameter decreases rapidly with increasing
nwhile increasing with atomic
number
Z(ξ
∝ Zn34). Therefore, for the Kβ
1,3transition the spin-orbit splitting is small and not
yet resolved in the case of manganese for
Z = 25. Its contribution to the total shape of the Kβcomplex is, if at all, reduced to a broadening of the Kβ
1,3component, the structure of which
is dominated by exchange interactions (see Chap. 1.6.2).
1. Introduction
1.6.2. Core-hole 3d-shell coupling
In the case of small contributions of the crystal field to the orbital energy, one expects high-spin states according to the number of unpaired electrons according (Hund’s rule).
Nominally and depending on the compound, zero to 5
3delectrons are present. As mentioned before, one can assume vanishing contributions from the angular momentum of the
3dshell, the total spin of the
3delectrons ranges from
S = 0−52.
For incomplete shells, the interaction of the
2por
3pcore hole with the
3dshell must be considered.
E. g.for an
S= 52state, in principle on expects a splitting of the Kα
1and Kα
2line in 4 and 2 components, respectively, which is dominated by the
(np,3d)exchange interaction.
In the case the Kα, it is about one magnitude smaller than the spin-orbit contribution, but is vice versa for the Kβ case, where interacting hole and electrons are located in the shell with the same principle quantum number [10, 19, 28].
The splitting of the fine-structure components itself can be treated analogue to the spin-orbit case. For the splitting of the
LIIand the
LIIIline caused by coupling to the total spin given by the number of unpaired electrons,
nunp, the approximation
ELII,III =−1
3a[J(J + 1)−S(S+ 1)−j(j+ 1)]
(1.5) holds with
J = j +S, where jLII = 1/2, jLIII = 3/2, and S = nunp/2and
abeing the parameter describing the exchange interaction. If the splitting is caused exclusively by the exchange interaction
(np,3d)and vanishing
3d-shell angular momentum, the interval for thesplitting is given by
∆ELII,III ∝J =j+S.
(1.6)
Hence, for a splitting not resolved,
i. e. ∆ELII,IIIis less than the natural line width, a linear increase of the total width with
3d-shell spin is expected [19].Such core-hole valence-shell coupling has been observed,
e. g.in photo-electron emission from either
2sor
3sholes in MnF
2, which has
d-shell spinS = 52. These final states have
7Sand
5Ssymmetry when hole and
3d-shell spins couple parallel or antiparallel. The case ismore complicated if a core
pelectron (2p or
3p) is removed, since then four final hole states7P
and
5P1,2,3can be formed from the parent
3d5terms of
6S,4Pand
4Dleading to in total 4 transitions [30, 31].
As on example for a Kβ splitting (see Tab. 1.1), the component
Kβ0appears in Mn(II) shifted by
−17eV from the Kβ
1,3as a satellite on the long-wavelength side (Fig. 6.6). It represents the component with hole spin aligned antiparallel to the spin state
(6S)5Pof the
3dshell, where the main part of the Kβ
1,3consists of the aligned spin configuration
(6S)5P. The other two weaker components
(4P)5Pand
(4D)5Pare predicted to be in between. The relative importance of exchange and spin-orbit contributions is discussed in detail in ref. [28].
1.7. Theoretical considerations
The theoretical calculation of the transition energies is a demanding task in view of the variety of effects. Theories have been developed describing many-body interactions both for the atomic and molecular cases like multi-configuration-Dirac-Fock [32], molecular orbital or ligand field calculations to differentiate in more detail intra-atomic Coulomb, crystal-field [33], exchange, or spin-orbit contributions [17]. Theoretical calculations including chemical and solid state effects have reached an accuracy of 0.1 eV or better [16].
10
1.8. Outline of thesis
It is beyond the scope of this work to provide a detailed theoretical analysis of the measured spectra. The interpretation of results is based on the extensive previous work ranging over decades and emphasis is given to the quality of data owing the good resolution of the spectrometer. Nevertheless, an attempt has been made to describe the gross feature of the energy dependence of the X-ray lines by a molecular orbit calculation, which essentially tests the variation of the electron density depending on the compound.
1.8. Outline of thesis
Kα and Kβ X-ray emission spectra have been measured by means of Bragg diffraction using
a curved-crystal Johann spectrometer. The basic principles of such a set-up are described
in Chap. 2. The performance of crystal spectrometers benefits from a particular type of
semiconductor X-ray detector — charge-coupled devices (CCDs). Properties of CCDs are
outlined in Chap. 3. Chapter 4 describes the set-up as realised at the Institut für Kernphysik at
the Forschungszentrum Jülich and the measurement procedure is introduced in Chap. 5. Data
processing and analysis are covered in Chap. 6. Results are introduced in Chap. 7 and the
discussion of the results is given in Chap. 8. A summary of the thesis is outlined in Chap. 9.
2. H IGH R ESOLUTION X- RAY S PECTROMETRY
2.1. X-ray diffraction
2.1.1. Bragg’s law
It was Bragg, who offered a simple interpretation of the diffraction patterns produced by von Laue. He suggested that each of the spots surrounding the central image could be a reflection of the X-ray beam from internal planes within the crystal, that contain many regularly spaced atoms. Such planes should be parallel to the cleavage plane of a crystal and Bragg tried to reflect an X-ray beam from such a surface of a mica crystal. Using a photographic plate he recorded a spot at a specific angle of reflection.
The X-rays emerging from different planes have the same phase if the length difference between their paths is a multiple of the X-ray wavelength. This condition can be satisfied only for a particular value of the X-ray incident angle. Considering two crystal planes spaced by a distance
dand X-rays with an incident angle
Θ, the path difference is equal to2d·sinΘ. Thecondition for constructive interference between the waves scattered on the atoms of equally spaced planes is given by the Bragg law [34]:
nλ= 2d·sin ΘB,
(2.1)
where
nis the order of diffraction,
λthe wavelength of the radiation,
dis the spacing of the reflecting planes and
ΘBis then called the angle of Bragg reflection or Bragg angle (see Fig.
2.1).
Bragg’s law is used in spectroscopy to transform a wavelength determination in an angle measurement. By using the relation
E=hc/λwith
cbeing the speed of light in vacuum and
hthe Planck constant one obtains the photon energy.
Fig. 2.1. :Bragg reflection from crystal.
An important correction to Bragg’s law stems from the index of refraction of the crystal
material. For X-rays the refractive index is slightly less than 1 and so the X-ray path is
2. High Resolution X-ray Spectrometry
bent away from the normal inside the crystal (see Fig. 2.2). This alters the distance traveled by X-rays reflected from each ”lower” plane of atoms and consequently changes the path difference for the Bragg condition to occur.
Fig. 2.2. :Bragg correction due to refraction.
The real part of the refraction index
µis parametrised as
µ= 1−δ,
(2.2)
with
δbeing a small positive number which itself depends on the wavelength. Inside the crystal, the X-ray wavelength changes from
λto
λ0, and the angle for Bragg reflection becomes
Θ0B. Considering the refraction at the crystal surface due to Bragg’s law and rewriting it inside the crystal leads to [35]
nλ0 = 2d·sin Θ0B.
(2.3)
One obtains
µ= 1−δ= λ
λ0 = cos ΘB
cos Θ0B.
(2.4)
Eliminating
µand primed variables leads to
nλ= 2d·sin ΘB
1−2·δ−δ2 sin2 ΘB
12
.
(2.5)
Since
δis of order
10−5, we can ignore
δ2, expand the bracket and, again ignoring powers of
δhigher than 1 and get
nλ= 2d·sin Θ
1−4d2 n2 · δ
λ2
,
(2.6)
which is known as the modified Bragg law [35]. The quantity
δ/λ2is about constant.
The correction factor in brackets (2.6) varies with order of reflection becoming less significant as the order increases. Hence, the diffraction angle
Θ0differs from the uncorrected Bragg angle
ΘBand can be expressed as an angular shift
∆ΘindΘ0B = ΘB+ ∆Θind.
(2.7)
14
2.1. X-ray diffraction
2.1.2. Rocking curve
According to Eq. (2.1), an incident photon with energy E can be reflected by the crystal only exactly at angles according to
sin Θ0B(n) = n·2dEhc. However, due to the diffractive nature of the scattering of electromagnetic waves from electrons, a monoenergetic incoming wave is reflected into a finite angular range around the corrected Bragg angle
Θ0B. Conversely, this means that the Bragg crystal accepts radiation within a small angular range which essentially represents the intrinsic resolution of the crystal material. The gross features of the diffracted intensity profile of a monoenergetic wave (Darwin curve) is shown on Fig. 2.3 with a flat top region known as the region of total reflection. Due to the index refraction shift the reflectivity is not peaked at zero given by
ΘB.
The angular range accepted by the crystal corresponds to the fraction of wavelength
ζ = ∆λλ. It can be calculated by means of the dynamical theory of diffraction, which can be applied in case of perfect single crystals [36]. Here, the orientation of the diffracting planes is ideal and the whole wave field interferes. The X-ray beam is very weakly reflected in each crystal layer and the total reflected beam is a coherent sum over the total number of planes crossed by the incoming beam. The full width half maximum (FWHM) of the accepted wavelength range (without absorption) reads
ζDF W HM =C·3√ 2 π
d n
2
r0|F|
vc ,
(2.8)
where
dis the crystal lattice spacing,
vcthe volume of the unit cell being of the order of
d3and
r0 = 2.8179403267(27)·10−15m is the classical electron radius. The structure factor
Frepresents the scattering from the various atoms at their positions in the unit cell.
The polarisation factor
Ctakes into account that the reflectivity depends on polarisation.
Any direction of the electric field vector can be constructed by the components parallel and perpendicular to the reflecting plane. The two polarisations are denoted
π(stands for parallel) and
σ(stands for senkrecht (german for perpendicular)). For
σand
πpolarisation,
C= 1and
|cos(2ΘB)|
, respectively. Consequently,
C = 12[1 +|cos(2ΘB)|]for an unpolarised beam.
Wavelength and corresponding energy interval are related to an angular spread by
−∆E E = ∆λ
λ = ∆Θ
tanΘB,
(2.9)
as can be shown by differentiating Bragg’s law. Hence, the angular width of the Darwin curve at FWHM is
ωD =ζDF W HMtanΘB,
(2.10)
Fig. 2.3. :Typical rocking curve for an ideal flat crystal.
2. High Resolution X-ray Spectrometry
i. e.
the rocking curve width describes the divergence of a parallel monoenergetic beam of radiation after Bragg reflection by the crystal. Identifying
∆Θin Eq. 2.9 with
ωD, one obtains the angular width of a monochromatic wave diffracted from an ideal crystal, results in the (relative) intrinsic resolution for X-ray energy or wavelength.
Along its path inside the crystal, more and more intensity of the incoming X-ray beam is diffracted into the outgoing one. A measure for the attenuation with penetration depth is the primary extinction length
Λ, which is defined to be the decrease of the incoming intensityto
1e. As the reflectivity changes along the Darwin curve, the central value is taken given by [36]
Λ = 1 C ·1
4 ·n d
vc
r0|F|,
(2.11)
Λ/d
is a measure of the number of planes contributing to the reflection, which would be of the order 80000 if absorption is neglected.
In addition to diffraction, electromagnetic waves are attenuated by absorption. In the energy range considered here photo effect is by far the dominating process. Hence, the total penetration depth is determined by combining extinction length and linear absorption coefficient
µ, where1/Λ> µis mandatory to achieve sufficient reflected intensity.
The total reflectivity, denoted integrated reflectivity
RI, is given by the integral over the rocking curve. Neglecting absorption the maximum reflectivity, the peak reflectivity
P = 1.For the total or integrated reflectivity one obtains
RI = 43·2√2
3 ·ωD
[36]. Including absorption,
P <1, the integrated reflectivity is in good approximation given byRI ≈ 4
3·P·ωD.
(2.12)
2.2. Curved crystal spectrometers
As described above, the Bragg condition is only fulfilled for a small angular interval
ωleading to a low rate of reflected X-rays coming from a spatially extended source. Already in the early times of X-ray spectroscopy the use of bent crystals in order to improve the efficiency of Bragg spectrometers was investigated. However, the development of such a method was hindered by the conclusion of a report by E. Wagner [37], which claimed that the fulfilment of both, the Bragg condition and the ordinary law of reflection, where the emission angle is equal to the incidence angle, is impossible to accomplish. It was found by Johann, that by using a cylindrically bent crystal and an extended source it is possible to simultaneously fulfil both constraints up to a small error which can be quantified [38].
2.2.1. Johann geometry
A common set-up for reflection-type spectrometers with bent crystals uses the so called Johann geometry [38]. It incorporates an extended source, a cylindrically bent crystal and a position-sensitive detector. The bending radius of the crystal is equal to twice the radius of
Rcof the so called Rowland circle. The Rowland circle, neglecting the difference of the crystal’s bending radius and the one of the Rowland circle, constitutes the focusing condition for monoenergetic X-rays
16
2.2. Curved crystal spectrometers
Rc·sin ΘB,
(2.13)
where the detector is placed.
The deviation of the Rowland circle to the crystal surface leads to a defocussing of the parts of the beam that are not reflected at the center of the crystal (Fig. 2.4). Owing to the symmetry of specular reflection, the trajectories of the source rays do not cross the Rowland circle in the same position. From geometrical considerations it can be seen, that X-rays not following the central ray to the crystal are always reflected towards the high energy side,
i. e.towards smaller Bragg angles. This shift is maximal at the edges of the crystal. Assuming the total horizontal width of the crystal to be
b, the so called Johann shift tangential to the Rowlandcircle reads in leading order [39, 40]
∆ΘJ = 1 2
b 2Rc
2
cot ΘB.
(2.14)
Fig. 2.4. :Schematic drawing of a Bragg spectrometer in Johann setup. This type of setup together with an extended source and detector allows for simultaneous measurement of a finite energy interval.
Smaller wave lengths (higher energies) belong to smaller Bragg anglesΘB.
The resulting Johann broadening can be tolerated if it is small compared to the intrinsic crystal resolution
ωD. Such conditions can be adjusted by choosing appropriate crystal widths
band bending radii
Rc.
In principle, the Johann shift can be avoided using the Johansson set-up [41]. There, the crystal planes are again bent to a radius equal to two times the radius of the Rowland circle, but additionally the crystal surface is ground with the radius of the Rowland circle itself.
In this way, the crystal surface coincides always with the Rowland circle. In practice, this is realised for compact industrial spectrometers of moderate resolution. The production of such crystals for ultimate-resolution spectroscopy, however, meets demanding technological difficulties.
Two-dimensional bending of the crystal increases the efficiency of the spectrometer, because
the additional vertical focusing reduces the reflection height and, hence, enlarges the hit
density on the detector [39]. Usually, spherically bent crystals are used. The crystal expansion
in vertical direction leads to a curvature of the reflection in direction to lower energies.
2. High Resolution X-ray Spectrometry
In principle each point of the source, when fulfilling the Bragg condition, is reflected to a hyperbola-like curve in the detector plane. Therefore, the integral distribution at the detector emitted from an extended source comprises of a multitude of superimposed hyperbola (see Fig. 6.5).
Using an extended source together with a large-area position-sensitive detector allows for a simultaneous measurement of an energy interval given by the horizontal extension of the source and the detector. X-rays with different wavelengths are accepted from different places of the extended source and are focused to adjacent places on the detector. In this way the position spectrum measured in the detector plane is equivalent to an energy spectrum.
The local angular and position dispersion at the focus are given by
dEdΘ = − E
tan ΘB
(2.15)
dE
dx = E
Rc·sinΘB·tanΘB
,
(2.16)
where the direction
xis perpendicular to the axis crystal-detector centres (see Fig. 2.4).
2.2.2. Energy resolution
The energy resolution of the Johann-type crystal spectrometer depends at first on the intrinsic crystal resolution
ωDaccording to Eq. (2.9), and, secondly on the aberration effects due to the imaging properties. The intrinsic resolution maybe affected by the quality of the crystal material, miscut surface distortions, and the precision of the curved crystal mounting. Such effects have to be determined in dedicated measurements as described in [42, 43].
Inspecting the aberrations due to the bent geometry, it turns out that the Johann shift dominates when allowing a crystal diameter of about 100 mm and choosing bending radii of 3 m. Effects from the finite heights of the crystal (width) and source are marginal when using a two-dimensional position-sensitive detector of sufficient resolution[44]. In this way, the curvature in the detection plane can be corrected with a precision not distorting the energy information (see Chap. 6.1.3).
The gross features of the energy resolution are therefore already described by the contribu- tions of rocking curve
∆E E
ω
=ωD·cot ΘB
(2.17)
and the weighted average due to the Johann shift. For a rectangular shape of the aperture defining the reflecting surface of the crystal (see Chap. 4.4), the weighted average amounts to about
13of the maximum shift [44].
∆ΘJ2
is therefore one third of the maximum Johann shift squared.
∆E E
J
= ∆ΘJ
3 ·cot ΘB= 1 6
b 2Rc
2
cot2ΘB.
(2.18)
Hence, for the total energy resolution
∆EEone expects the range
∆EE 2
ω
+ ∆E
E 2
J
≤ ∆E
E 2
≤ ∆E
E
ω
+ ∆E
E
J
.