T H E W O R L D B A N K O P E R A T I O N S E V A L U A T I O N D E P A R T M E N T
2002 The World Bank Washington, D. C.
Helen Abadzi
INDIA: Education Sector Development in the 1990s
A Country Assistance Evaluation
Director-General, Operations Evaluation: Robert Picciotto Director: Gregory Ingram
Manager: Ruben Lamdany Task Manager: Gianni Zanini
The author is the Senior Evaluation Officer working in the area of education in the OED Sector and Thematic Evaluation Group (OEDST) of the World Bank.
This paper is available upon request from OED.
Public Disclosure Authorized Public Disclosure Authorized Public Disclosure Authorized Public Disclosure Authorized
2
ENHANCING DEVELOPMENT EFFECTIVENESS THROUGH EXCELLENCE AND INDEPENDENCE IN EVALUATION
The Operations Evaluation Department (OED) is an independent unit within the World Bank; it reports directly to the Bank’s Board of Executive Directors. OED assesses what works, and what does not; how a borrower plans to run and maintain a project; and the lasting contribution of the Bank to a country’s overall development. The goals of evaluation are to learn from experience, to provide an objective basis for assessing the results of the Bank’s work, and to provide accountability in the achievement of its objectives. It also improves Bank work by identifying and disseminating the lessons learned from experience and by framing recommendations drawn from evaluation findings.
OED Working Papers are an informal series to disseminate the findings of work in progress to encourage the exchange of ideas about development effectiveness through evaluation.
The findings, interpretations, and conclusions expressed here are those of the author(s) and do not necessarily reflect the views of the Board of Executive Directors of the World Bank or the governments they represent.
The World Bank cannot guarantee the accuracy of the data included in this work. The boundaries, colors, denominations, and other information shown on any map in this work do not imply on the part of the World Bank any judgment of the legal status of any territory or the endorsement or acceptance of such boundaries.
Contact:
Operations Evaluation Department
Partnerships & Knowledge Programs (OEDPK) email: ecampbellpage@worldbank.org
email: eline@worldbank.org
Telephone: 202-458-4497
Facsimile: 202-522-3125
http:/www.worldbank.org/oed
Acronyms
DEA Department of Economic Affairs DIET District Institutes of Education DOE Department of Education
DPEP District Primary Education Project
EFA Education For All
GDP Gross Domestic Product
GER Gross enrollment ratio
IDA International Development Association
NCERT National Council of Educational Research and Training NGO Non-governmental organization
NIEPA National Institute of Education Planning and Administration NPE National Policy on Education
OED Operations Evaluation Department PROBE Public Report on Basic Education
SIEMAT State Institutes of Educational Management and Training TVET Technical-vocational education and training
UPBEP Uttar Pradesh Basic Education Project
UPE Universal Primary Education
Contents
Preface...i
Executive Summary ...iii
1. Self-Reliance In Project Implementation...1
2. Completed Projects: Technical-Vocational Education And Training ...3
3. Ongoing Projects – District-Based Primary Education ...4
Significant Achievements...5
Some Concerns...7
A. Local-Level Social Processes and Obstacles...9
B. Low Quality of Education... 11
C. Uneven Quality of In-service Training, Modest Institutional Development ... 12
D. Issues of Data Reliability, Analysis, and Objectivity... 13
E. Supervision Concerns ... 15
4. Evaluation Of IDA Assistance ...16
Outcomes...16
Institutional Development Impact...17
Sustainability ...17
5. Sectoral Issues – Directions For The Future ...18
Open Discussion of DPEP Successes and Obstacles ...18
Financial Accountability and Local-Level Concerns in DPEP...19
Need for Integrated Sectoral Dialogue...20
Better Use of International Experiences and Technical Expertise...21
6. Recommendations ...21
Box 1: Field Observations Obstacles To Student Performance Despite Best Intentions ...8
Table 1: OED Ratings of Technical Vocational Education Projects ...4
Figures: 1. Progress in Literacy Rates for Selected Countries (1980-1986) ...1
2. Progress in the Gross Domestics Product Share Devoted to Education (1980/1986) ...2
3. Enrollments have increased ...6
4. Dropout declined under Uttar Pradesh Basic Education ...6
Annexes A. Background, Policy Framework, And Bank Education Lending History In India ... 23
B. Summary of Discussion at CAE workshop on March 29, 2000 ... 31
C. OED Responses to Selected Government Comments ... 33
Preface
This paper is one of the background papers prepared as an input to the India Country Assistance Evaluation (Task Manager: Mr. Gianni Zanini) by the Operations Evaluation Department (OED) of the World Bank. Findings are based on a review of project appraisal and completion reports, sector reports, and a number of other documents produced by the Borrower, the Bank, OED, and various educational researchers. Bank staff, government officials, and local professionals were interviewed at both headquarters and in the field office. Their valuable assistance is gratefully acknowledged.
Earlier versions of the paper (prepared by Ms. Sukhdeep Brar) were supervised by Aklilu Habte (consultant) and were reviewed by the Bank’s India education sector team.
A revised paper was discussed at a workshop in New Delhi on March 29, 2000, chaired by Professor Denzil Saldanha, and with the participation of central and state government officials, academics and members of policy research institutes, and other representatives of civil society. Workshop participant views, field visit observations, interviews with officials and donor staff, and two sets of comments from the Ministry of Human Resource Development were taken into account in preparing this final version of the paper.
The author is grateful for all comments received, which have been taken into
account in this revised version. However the views expressed in this paper remain
entirely those of the author. They do not necessarily reflect the views of OED or the
World Bank.
Executive Summary
1. World Bank lending in education has taken place through a unique working relationship in line with India’s principle of self-sufficiency and domestic development. Until the late 1980s, the government of India strongly resisted external funding for education programs. Subsequently, the goal of universal elementary education resulted in demand for additional resources, leading the Department of Education (DOE) to review its policy on external funding in education. The Bank’s continued efforts towards a dialogue with DOE aimed at confidence building also contributed to this change in policy. Since 1980, the Bank’s investments in education in India have grown from an almost negligible amount to $2 billion. The Bank has approved four
vocational and technical education and training (TVET) projects and six basic education projects.
Completed Projects – Technical and Vocational Education and Training
2. In addition to civil works and equipment, the TVET projects focused on improving the quality of instruction and on empowering institutions to carry out the tasks needed to train students who would be valuable to industry (curricular revisions, updating teacher skills, self- maintenance of equipment, improved linkages with industry, income generation, financial, and academic autonomy). They also focused on increasing female participation in TVET.
3. All four TVET projects are completed and audited. Although the Vocational Education Project (Cr. 2008-IN) fell short of some of its targets, the Technician I and II projects achieved or surpassed theirs. Altogether, about 1,100 institutions were constructed or received additions, equipment, and furniture. Overall, their capacity increased more than 50 percent, by roughly 100,000 student places, and expansion often exceeded targets. The Operations Evaluation Department (OED) has rated project performance as satisfactory or highly satisfactory, though substantial improvements are still needed in industry linkages, quality of trainers and academic flexibility.
Ongoing Projects – Primary Education
4. The primary education projects, which focus on local-level delivery of inputs through innovative means, are still under imple mentation. Therefore, evaluative statements about them are tentative. There is much state variance in achievement of various project outcomes, but joint review mission reports and other materials show achievements in the following areas:
• A very high level of government commitment at the central and state level. Donor staff have been very much impressed by the eagerness of various officials to implement the very large and complex district-based projects. Overall, about 50 million children have been involved.
• Large enrollment increases in the most deprived areas. For example, in the Uttar Pradesh
Basic Education Project (UPBEP), enrollments in the 1991–2000 period reportedly
increased by 67 percent at the primary level and by 74 percent at the lower secondary
(also called upper primary). The gross enrollment ratio increased from a baseline level of
66 percent to 107 percent (including overage children), although the target level was only
78 percent.
• Large increases of female enrollments. Girls’ enrollment reportedly increased by 97 percent in the UPBEP and by 39 percent in DPEP; girls’ attendance was 77-87 percent in project areas. Dropout decreased.
• Textbooks that are actually used in classes were provided on a large scale.
• In-service training of about 100,000 teachers through block and cluster resource centers.
Instructional methodology was emphasized and child-centered methodologies were disseminated to teachers and parents.
• Large numbers of teacher appointments, particularly locally residing para-teachers.
• Formation of over 171,000 village education committees, some of which are very active.
• Construction of thousands of schools, toilets, and drinking water fountains through local village authorities and through suitable local designs.
• Establishment of block and cluster resource centers as well as district institutes of teacher education.
5. Areas of concern for primary education include:
• Less than impressive learning outcomes. Baseline to mid-term comparisons showed strongest improvement for grade 1 and minimal improvement for the higher primary grades. Overall, achievement in the poorer districts remained far below expected minimum standards.
• Fewer teachers in areas where need is greatest; some teachers may be reassigned near their homes, leaving the poorest children under-served.
• Uneven quality of in-service training and modest development of training institutions.
• School construction problems in poorer areas and in the earlier project stages.
• Limited function of village education committee activitie s in the poorer areas.
6. In addition, it has been difficult to verify program effects due to:
• Uncertainty regarding the provision of inputs, partly because donors are usually unable to visit project sites unannounced and observe operations as they happen under everyday conditions;
• Uncertainty regarding outputs, because donors have limited access to data and studies;
studies are executed by a few chosen institutions;
• Some questions regarding the reliability and methodology of data collection and reporting;
• Agreements between government and donors that remain unwritten, omission of some controversial issues in aide-memoires; and
• Inadequate procedures for ensuring financial accountability.
7. Nevertheless, the government has tackled, with great energy, extremely difficult and complex problems. It would be impossible to improve quickly on all fronts, and some
imperfections are inevitable. OED rates the outcome of the educational program as satisfactory,
with high relevance and substantial efficacy and effic iency. Institutional development is rated as
modest and sustainability as likely.
8. Specifically for primary education, OED suggests:
• Independent verification of enrollments, project benefits, and flow of funds at the local level. NGOs or independent academics might undertake these activities and report to the government and the donors, thus giving the government the opportunity to mitigate problems early. Donors should visit many school sites unannounced. Data sets from independent studies (e.g. health surveys and PROBE) should be analyzed to compare sampled DPEP and non-DPEP districts.
• Increased availability of the studies to donors and qualified academics, improved quality of reports and statistical analyses. More extensive data analyses at the local, district, and state levels, particularly by independent academics.
• Assessment of the local-level processes that greatly influence project success. Study of the social or other types of obstacles which arise (e.g. difficulties of operationalizing village education committees, keeping teachers in remote areas, local microcorruption customs) in search of remedies.
• Eliminating some fundamental limitations of lower-income classrooms (e.g. densely packed large and noisy classes of children who receive limited teacher attention) through after-hours remediation of the weakest students and specific training to help teachers focus on low performers early on.
• Restructuring the district and state institutes of education which thus far have not been able to provide suitable service or locate suitable staff. Study world experience in locating such capacity in various administrative entities, such as local colleges of education.
9. For the lending program in sectoral terms, OED recommends:
• An integrated approach and study of the effects of one subsector on another;
• Increased financing of higher education through user fees and alumni contributions;
• Direct lending to states;
• Better use of donors’ technical expertise and world experience in various methodological
and administrative issues.
1. Self-Reliance In Project Implementation
1.1 Atmnirbharta means self-reliance in Sanskrit. Ever since Mahatma Gandhi boycotted textile imports from the UK and advocated the swadeshi (domestic) spinning and weaving of cloth from raw materials, atmnirbharta has been a core value in India’s financial and social policy. For many years, imports were limited, foreign capital was discouraged, and local industry was subsidized to build many of the products that other developing countries imported from the industrialized world.
The resulting achievements, such as automotive production and proficiency in software development, have been an important source of national pride.
1.2 For many years, India tried to increase access to and quality of primary education in a swadeshi manner, with its own funds and very little donor involvement. But poverty, population size, and linguistic diversity made it difficult to make more serious inroads with just its own funding and methodology. During the British Raj, schools had been managed locally, but the government promoted centralization after independence. Compared to other countries in the region, which had received consistent donor assistance, India performed about average in improving literacy and primary education enrollment (Figure 1). Its financing of education also improved with the years, in line with other countries (Figure 2). However, India consistently fell behind other Asian countries (such as China) in education and health indicators, an issue pointed out during the 1990 Education For All conference in Jom Tien. (Annex A details national trends in the education sector).
Figure 1. Progress in Literacy Rates for Selected Countries (1980 to 1986)
0 20 40 60 80 100
0 2 0 40 60 80 100
Literacy rate, 1980/1985*
India
Bangladesh Nepal
Pakistan
Malawi
Mauritus
Burkina Faso
The left terminus is women's literacy, the right terminus is men's.
Sri Lanka Thailand
China
* 1985 figures were used for Sri Lanka, China, and Thailand because 1980 figures were not available.
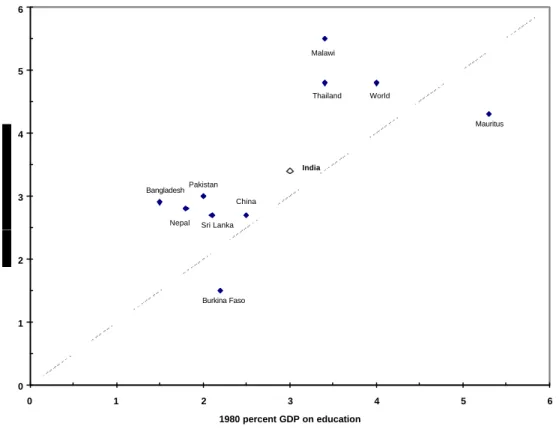
Figure 2. Progress in the Gross Domestic Product Share Devoted to Education (1980/1986)
1.3 From the 1970s it was evident that to overcome India’s serious social disparities, all citizens would need access to a high-quality education that the central government could not afford to finance or monitor on its own. Decentralization was needed to move authority, fiscal responsibility, and implementation capacity to the local levels, an effort that India undertook consistently since 1986 through the revised National Policy on Education (Annex A). Financing education externally was politically problematic. India had welcomed bilateral donor assistance in the form of grants for education, but it wanted to borrow from the World Bank only for balance of payments or hardware (such as the construction of agricultural universities in Bihar and Assam in 1972). The government was concerned that the Bank might impose conditions that could be seen as objectionable by some parties on such a sensitive national issue as primary education. On the other hand, India could not on its own get the financial and implementation impetus needed to educate its fast-increasing population. The Department of Economic Affairs agreed to borrow as a way to increase absorption of IDA funds that were not being used elsewhere due to low
implementation capacity. The 1991 economic crisis subsequently created an urgent need for increased resources. The story of IDA lending in education is a story of maintaining atmnirbharta while building swadeshi implementation capacity.
1.4 After considerable thought and discussion, the government asked the World Bank to finance educational projects, under the condition that government staff take the lead in preparing and implementing them (Annex A). From 1989 to 2000, the Bank financed four vocational-
0 1 2 3 4 5 6
0 1 2 3 4 5 6
1980 percent GDP on education India Bangladesh
Nepal Pakistan
Malawi
Mauritus
Burkina Faso
World Thailand
Sri Lanka China
technical education projects and seven primary education projects (Annex A Table 1). In both subsectors, projects stressed decentralization and autonomy; states were asked to prepare plans and submit them for approval. The states that were willing and able to prepare plans acceptable to the government were included in the projects. OED Review Framework
1.5 The Operations Evaluation Department (OED) typically evaluates projects after their completion. All five technical-vocational education projects under implementation have been completed. OED audited them in October-November 1999, and has issued specific statements about their outcomes.
11.6 All primary education projects are still underway, and measures that will determine outcomes are still being collected. Focusing on intermediate implementation variables, OED reviewed files, studied supervision reports, and interviewed mid-level government staff about views regarding relevance and implementation. Preliminary review findings were presented at a workshop held in Delhi on March 29, 2000, and participants’ views were elicited. Subsequently, more interviews were held with officials and donor staff, and a field visit took place in the
Saharanpur district of Uttar Pradesh on April 3, 2000. This report presents a synthesis of data and views received thus far. Since the primary-education projects are yet to close, OED’s statements about their outcomes and impact remain tentative.
2. Completed Projects: Technical-Vocational Education And Training
2.1 The government’s strategy was to bring about the much-desired industrialization of the country, particularly in high-technology areas, in order to produce human and material resources that would compete in the world market. The projects also focused on increasing female
participation in vocational-technical education. Four projects were implemented (Annex A) in 1989–99; they concentrated on the lower levels of the formal technical-vocational education and training (TVET) system, which train technicians and craftsmen to support the work of degree- level engineers. They also focused on states and institutions that were most willing to make much-needed changes. Over 10 years, the Bank committed $855 million to TVET. Though the amount was minuscule compared to the needs of the country, the two parties developed a productive working relationship, and the Bank established itself as a credible interlocutor in education.
2.2 The projects were complex, with much construction of specialized buildings and large- scale procurement of complex equipment. They tested the implementation capacity of the state departments of technical education, most of which gradually rose to the challenge. Although the Vocational Education Project (Cr. 2008-IN) fell short of some of its targets, the Technician I and II projects achieved or surpassed theirs. Altogether, about 1,100 institutions were constructed or received additions, equip ment, and furniture. Overall, their capacity increased more than 50
1. Bank Report No. 20437, Performance Audit Report, India, Vocational Education Project, Technician Education I
Project, Technician Education II Project, Electronics Industry Development Project, April 27, 2000, Operations
Evaluation Department, World Bank
percent, by roughly 100,000 student places. Expansion often exceeded targets. For example, the advanced vocational training scheme was to benefit 17,000 students but benefited 84,000.
Female participation exceeded targets and more than doubled, from about 11–15 percent to 30 percent. The one problem found consistently was that students often did not have specific textbooks and studied from notes, while many of the books that had been developed were either unsuitable or not available for students to take home and study.
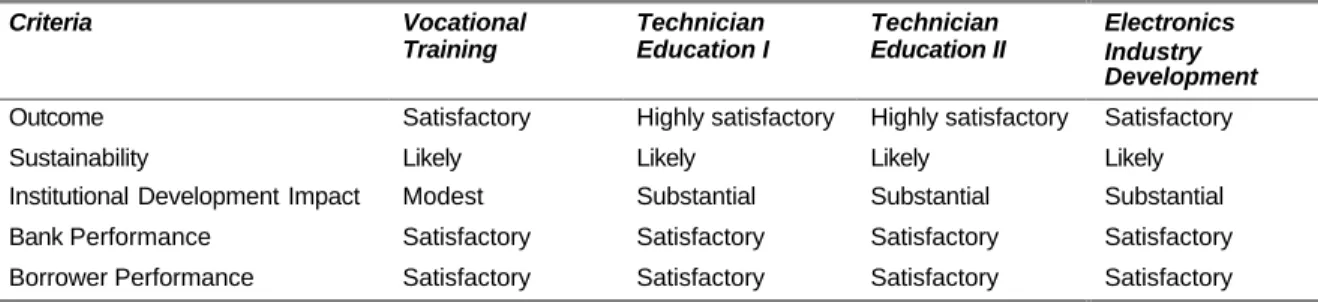
2.3 OED rated the outcomes of the Technician Education I and II projects as highly satisfactory when the projects were audited in October 1999 (Table 1). The Electronic Industry Development Project (Ln. 3093-IN), which was appraised by the Bank’s industry division, created a best practice model of sustainability (the self-sustainability scheme) by gradually withdrawing funds from participating polytechnics and engineering colleges while fostering income generation and staff development. Overall, the experience in TVET underlined the importance of communications among states to share experiences, raising expectations and praising success, which must continue if the institutions are to become more closely linked with industry, more autonomous, and more financially self-sufficient. The Bank’s experience in India shows that it is possible to implement successful TVET projects. Government commitment, ownership, and attention to execution can make it possible to overcome the obstacles of these very complex operations.
Table 1: OED Ratings of Technical-Vocational Education Projects
Criteria Vocational
Training
Technician Education I
Technician Education II
Electronics Industry Development Outcome Satisfactory Highly satisfactory Highly satisfactory Satisfactory
Sustainability Likely Likely Likely Likely
Institutional Development Impact Modest Substantial Substantial Substantial Bank Performance Satisfactory Satisfactory Satisfactory Satisfactory Borrower Performance Satisfactory Satisfactory Satisfactory Satisfactory
Note: The rating scale for institutional development as well as Bank and Borrower performance is “highly satisfactory”,
“satisfactory”, “unsatisfactory”, “highly unsatisfactory”. The outcome rating scale also includes “moderately satisfactory” and
“moderately unsatisfactory” levels. Sustainability is rated as likely, uncertain, or unlikely .
3. Ongoing Projects – District-Based Primary Education
3.1 These projects reflect a clear policy to move a significant share of educational
decisionmaking to the district and sub-district level and were expected to create the institutional framework to carry out long-term, cost-effective human resource development. The general objectives were to build institutional capacity; improve the quality and completion rates of the primary education system; and expand access to primary education-especially for girls, scheduled castes, and scheduled tribes. Starting in 1993 in Uttar Pradesh, the projects were implemented simultaneously in several groups of states as well as in single states, such as Bihar. (Annex A has detailed discussion of policies and project descriptions.). The lending program was preceded by studies and baseline data collection. An elaborate monitoring and evaluation component is producing many data. Donors have coordinated closely in financing and supervising the projects.
The government in collaboration with the donor community has carefully crafted a supervision
design that is elaborate, yet manageable, so much so that it has received a recognition award by the Bank’s Quality Assurance Group (Annex A). Bank and government collaboration have been excellent, and relationships have been warm.
Significant Achievements
3.2 The government commitment and mobilization have been overwhelming, both at the state and the central levels. Some very competent officials have been assigned to implement the program, and there has been much attention to administrative issues at the higher levels, linkages with states, and assured flow of donor and counterpart funds to the districts. Reports to the donors are detailed and thoughtful and show a great deal of work. Government commitment and activity far exceed the levels usually seen in other low-income countries and have very much impressed Bank staff.
2As a result, the Uttar Pradesh Basic Education Project (UPBEP), the District Primary Education Project (DPEP), and follow-on projects have received considerable worldwide
publicity. The Human Development Network has prepared a case study on this effort.
33.3 Social conditions vary considerably among states and districts therein, and there is much performance variance among various states and projects. Joint review mission reports and other materials for projects under implementation show progress in the following areas.
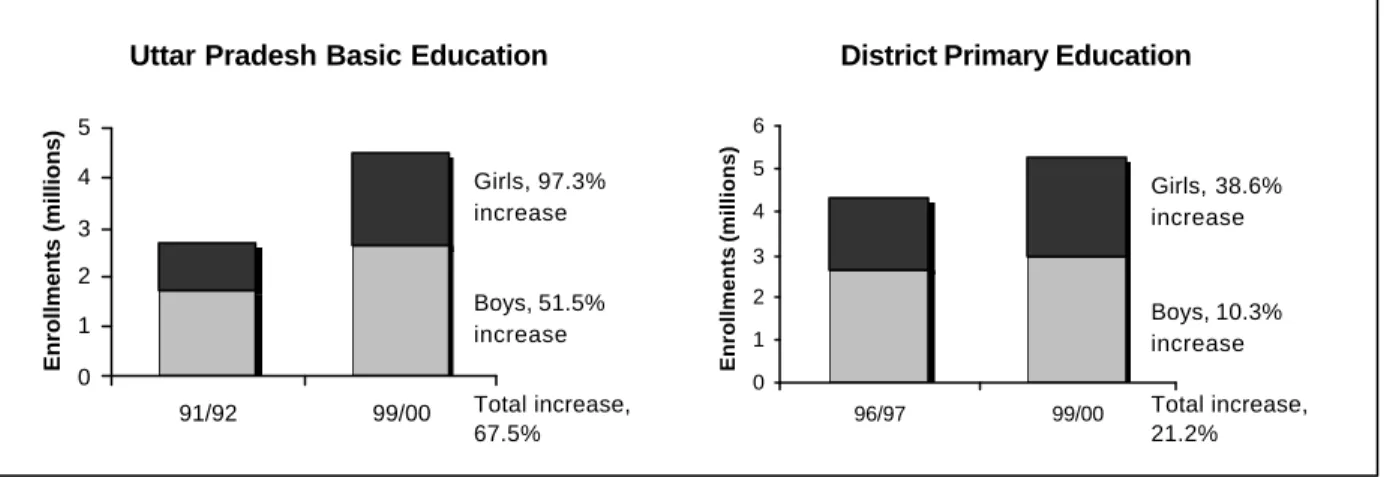
• Reports on enrollment increases are impressive, particularly in the poorer areas. For example, in the Uttar Pradesh Basic Education Project enrollments, over the period 1991–2000, show a 68 percent increase at the primary level (Figure 3) and 74 percent increase at the lower
secondary (also called upper primary). Contrary to the national trend (see Annex A, para. 3) the gross enrollment ratio (GER) in Uttar Pradesh project areas increased from a baseline level of 66 percent to 107 percent (including overage children), although the target level was only 78 percent. In DPEP, enrollment reportedly increased by 21 percent from 1996 to 2000. The GER increased from 90 percent to 106 percent. By comparison, the GER in equivalent non-project districts was 97 percent.
42. An example is the bimonthly DPEP newsletter, which highlights champions, reports activities of the participating states and the results of various studies.
3. Education Reform and Management Case Study, June 2000.
4. Making a difference: Focus on Girls Education in Uttar Pradesh, India. UP Education for All Project Board.
Presentation made at the World Bank Human Development Week, March 2000. It is unclear whether enrollment rates
are stable throughout the year or reflect only early counts.
• Reports on girls’ enrollment show substantial increases, particularly areas of traditionally lowest enrollment. For example, enrollments reportedly increased by 97 percent in the UPBEP and 39 percent in DPEP; overall, DPEP districts
are enrolling more girls than similar non-DPEP districts; gir ls’ attendance was 77–87 percent in project areas. Enrollment of scheduled-caste and tribal girls rose by 44 percent and 40 percent, respectively. Girls’ dropout in UPBEP was reduced by 42 percent, and the gender gap was reportedly eliminated in many districts (Figure 4). Representation of women teachers in UPBEP districts rose from 18 percent to 28 percent.
Nevertheless in some areas as in Orissa, female participation is not satisfactory.
• Though there is much variance among grades and states, learning outcomes are reported as improving. A midterm assessment study was conducted in 42 districts of seven states covering 50,000 students in 1,800 schools in 1994 and 1997. Grade 1 scores in language and
mathematics showed considerable improvement in three years, whereas grades 3 / 4 scores showed less.
5Half the districts in 1997 scored at or above the 60 percent mastery criterion in grade 1, but almost no district reached this criterion in grades 3 and 4 (partly perhaps as a result of curricular changes). The gender gap in achievement is reportedly closing.
• Instructional methodology has been emphasized, and there has been much dissemination of child-centered training to teachers and parents. A change in instructional methodology may lie behind the improvements in grade 1.
5. The government indicates that there are improvements in most districts, but the magnitude of the effect of the DPEP is hard to ascertain from the available analyses since there is significant variation in results between districts.
Uttar Pradesh Basic Education
0 1 2 3 4 5
91/92 99/00
Enrollments (millions)
Girls, 97.3%
increase
Boys, 51.5%
increase Total increase, 67.5%
District Primary Education
0 1 2 3 4 5 6
96/97 99/00
Enrollments (millions)
Girls, 38.6%
increase
Boys, 10.3%
increase Total increase, 21.2%
Figure 3. Enrollments have increased
Figure 4. Dropouts declined under Uttar Pradesh Basic Education
0 20 40 60 80
1991 1998
Boys Girls