Keysight Technologies Understanding the
Kramers-Kronig Relation Using A Pictorial Proof
By Colin Warwick,
Signal Integrity Product
Manager, Keysight EEsof EDA
White Paper
In principle, application of the inverse Fourier integral to the complete frequency response of any physical network should always yield a causal time-domain impulse response.
Such a response would be useful as a model in the transient mode of a SPICE-like simulator. In practice however, the frequency response information we have in hand is often incomplete (e.g., it’s bandlimited and on a discrete-frequency point grid) and can contain measurement errors.
A naïve application of the inverse Fourier integral to such a frequency response almost always yields an incorrect, non-causal time-domain model. The Kramers-Kronig rela- tion1 is very useful in this situation because it allows us to correct the frequency response and build a caus- al time-domain model. For example, the convolution simulator in Keysight Technologies’ Advanced Design System (ADS) Transient Convolution Element uses this relationship in a patented implementation that builds a passive and delay causal model from bandlimited frequency-domain data like S-parameters.
The first step in understanding the validity of this approach is to examine the math behind the Kramers-Kronig relation. The usual proof involves contour integration in the complex plane of the frequency domain, but it doesn’t afford you much insight into what is going on. The pictorial proof offered here aids understanding. It illustrates a treatment in a textbook by Hall & Heck.2
In essence, the Kramers-Kronig relationship comes about because of several facts:
Even functions (cosine-like) in the time domain yield the real parts of the frequency-domain response.
Odd functions (sine-like) in the time domain yield imaginary parts of the frequency-domain response.
All functions can be decomposed into the sum of an odd and even function. In general, these terms are independent, but unlike the general case, the odd and even terms of a decomposed causal function have a simple, specific dependency on each other.
Knowledge of one determines the other.
This dependency carries through to the real and imaginary parts of the frequency response because of facts 1 and 2.
1. John S. Toll, Causality and the Dispersion Relation: Logical Foundations, Physical Review, vol. 104, pp. 1760 - 1770 (1956).
R. de L. Kronig, On the theory of the dispersion of X-rays, J. Opt. Soc. Am., vol. 12, pp. 547-557 (1926).
H.A. Kramers, La diffusion de la lumiere par les atomes, Atti Cong. Intern. Fisica, (Transactions of Volta Centenary Congress) Como, vol. 2, p. 545-557 (1927).
2. Advanced Signal Integrity for High-Speed Digital Designs by Stephen H. Hall and Howard L.
Heck, pp.331-336 ISBN-13 978-0-470-19235-1
Introduction
To get a better understanding of these facts, let’s take a closer look at each one step by step.
The Fourier integral-frequency response of an arbitrary function h(t) is defined as:
∫
∫
−∞∞∞
∞
−
− = −
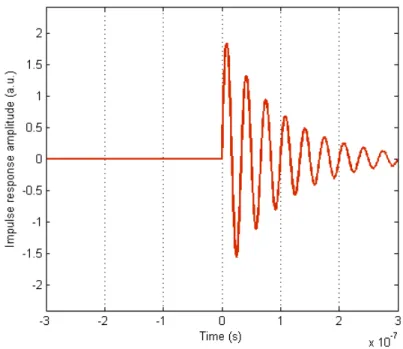
= e h t dt t h t j t h t dt H(ω) jwt () cos(ω ) () sin(ω ) () Think about the subset of functions that are real-valued and causal (one example is shown in Figure 1):
h(t) = 0 for t < 0, h(t) is real for t >=0
Let’s see how this class of functions constrains H (ω) .
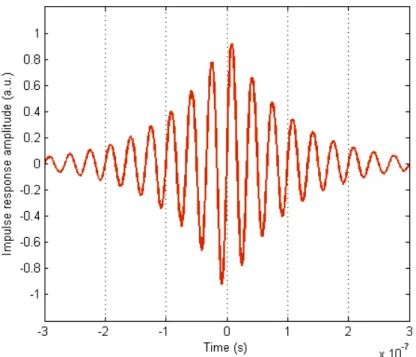
For reasons that you’ll see below, we’re going to build our causal impulse response out of non-causal even and odd terms. Before we do that though, let’s assemble a mini toolbox of properties of even and odd functions. The first tool is the relationship between an odd impulse response (an example is shown in Figure 2) and its Fourier integral, where the odd impulse response is defined by:
Figure 1. Example of a causal impulse response, namely a damped 30-MHz sine wave.
) ( )
( t −h t
h
o o−
Tool 1: The Fourier integral of a (non-causal) odd impulse response is pure imaginary.
To see why this is so, remember that cosines are even and sines are odd. For an odd function, the odd-even products – cos(ωt)ho(t) – integrate out to zero because the left and right halves have equal magnitudes but opposite signs and therefore, always cancel each other. Consequently, the only finite terms are the j sin(ωt)ho(t) odd-odd terms which are pure imaginary.
The second tool is the relationship between an even impulse response and its Fourier integral, where the impulse response is defined by:
Tool 2: The Fourier integral of a (non-causal) even impulse response is purely real. The even-odd products – j sin (ω)He(t) – must integrate to zero for the same reason as previously stated. Only the even-even products cos (ωt)he(t) are finite and those are purely real.
Now, let’s decompose a causal function into even and odd parts, and then apply these tools to each part. You can construct any causal or non-causal h(t) out of a sum of some linear combination of even and odd components, using:
2 ) ( ) ( 2
) ( ) ) (
( h t h t h t h t
t
h − − −
In the general case, this construction isn’t particularly useful or interesting.
However, an interesting thing happens when you construct a causal function out of even and odd components.
Figure 2. Example of a non-causal odd impulse response, an increasing then damped 30 MHz sine wave.
) ( )
( t h t
h
e e−
Consider our odd function ho(t), then multiply it by the signum function illustrated in Figure 3 and defined as:
1 ) (t −
signum
if
t 0and
signum(t) 1if
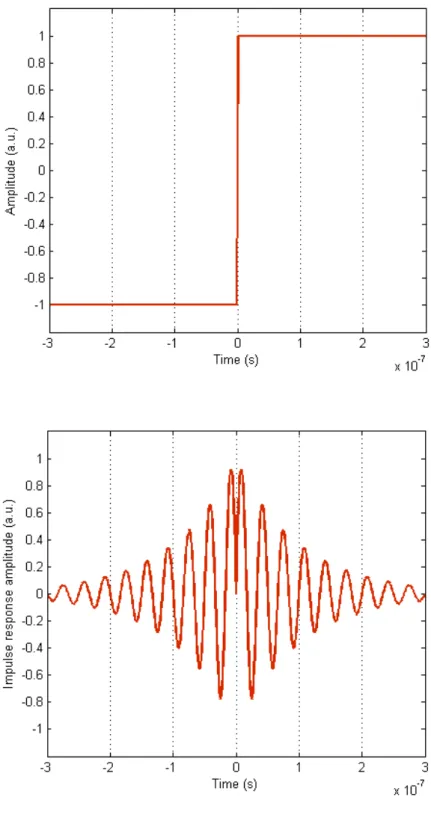
0 tThe signum function gives the left hand half of ho(t) an up-down flip and this yields a new even function he = signum(t)ho(t) , an example of which is shown in Figure 4.
Figure 3: The signum function is simply the sign (but not the sine) of its argument.
Now, think about what happens when we add the odd function and the even function we derived from it (Figure 5). In this case:
) ( ) ( ) ( )
( ) ( )
( t h t h t signum t h t h t
h
e o o oImpulse responses constructed in this way are necessarily causal since the left hand half of even exactly cancels the left hand half of odd. It might seem strange to go to all this trouble to construct an impulse response, but the beauty is that we can now see what the Fourier integral looks like.
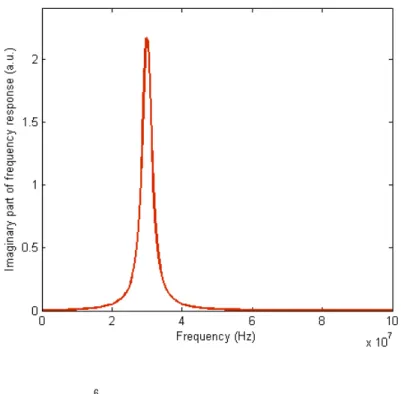
Before diving into the specifics, notice from Tools 1 and 2 that the even he = signum (t) ho (t) will yield a real response, while the odd ho(t) will yield a pure imaginary response (Figure 6). Both depend on the same function ho(t).
Figure 6. The imaginary part of the frequency response comes entirely from the odd part of the time response (Figure 2, in this case). Note that for aesthetic reasons, the curve was flipped up-down.
The imaginary part is actually negative.
Physically, the peak corresponds to severe damping at the resonant frequency (30 MHz).
Figure 5. Example of a causal impulse response, created by adding the functions in Figures 2 and 4.
We can see immediately that the causality constraint means that the real and imaginary parts are related and contain the same information. But what is the exact relationship? Multiplication in the time domain is equivalent to convolu- tion in the frequency domain, so:
) ( ) ( ) ( )
( SIGNUM H
oH
oH
Here, upper case functions denote the Fourier integral of the corresponding lower case function and denotes convolution. The recipe for convolution in words and pictures is: “flip the kernel left-right using a dummy variable, slide it over the other term, multiply, integrate over the dummy variable, rinse, and repeat.”
Breaking that down, take the convolution kernel (called the Hilbert kernel) in a dummy variable, flip it left-right SIGNUM (–ω’), slide it over by ω to give SIGNUM (ω – ω’), multiply by Ho (ω) and integrate:
−
SIGNUM − H d H
SIGNUM ( )
o( ) ( )
o( )
What does the Hilbert kernel look like? Well, signum(t) is odd so we know that SIGNUM (ω) must come from the sine waves and be pure imaginary (Tool 1).
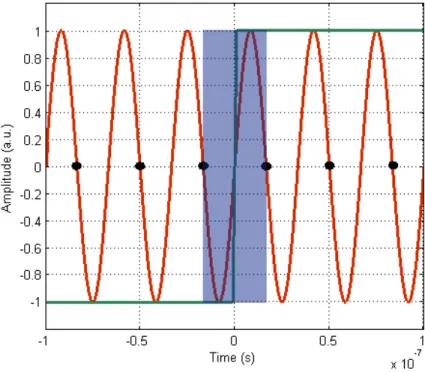
Figure 7 shows one point of the Fourier integrals we must do. Imagine Fourier integration as being a ‘multiply and add’ operation on the red and green curves.
We get the response at, in this case, 30 MHz. Note that only the two shaded half periods immediately to the left and right of the sign change at the origin give non- canceling products. Every other pair of half periods cancel each other out because, away from the origin, signum(t) is either constant +1 or constant –1.
Figure 7. Pictorial representation of one frequency point of the Fourier integral of the signum(t) function.
The area under the non-canceling, shaded area is proportional to wavelength and so inversely proportional to period ω. Actually, pictures aside, it’s not too hard to do the Fourier integral because we can split it into one half from –
∞
to 0 and one half from 0 to∞
. You can quickly convince yourself that the Hilbert kernel is:
SIGNUM j 2 ) (
Figure 8 illustrates what it would look like.
The bottom line is that the Hilbert transform in the frequency domain is equivalent to multiplication by signum(t) in the time domain. We can therefore, rewrite the real part of our frequency response as the Hilbert transform of the imaginary part:
−
− H d
H j SIGNUM
H
e o o( )
) (
) 2 ( ) ( )
(
Note that here Ho (ω’) is pure imaginary and j times pure imaginary is purely real, as expected.
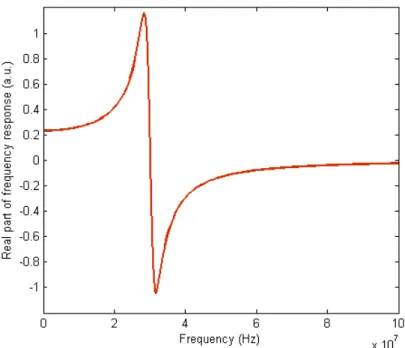
Next, imagine convolution as running the Hilbert kernel (Figure 8) over the imaginary part (Figure 6) of the frequency response. What you end up with is shown in Figure 9. Thus, the real part of frequency-domain response of a causal impulse response can be calculated knowing only the imaginary part. You can apply a similar proof starting with an even function and show that the imaginary part can be calculated knowing only the real part.
Figure 8. The imaginary part of the Hilbert kernel. The real part is zero.
In summary, you can decompose any causal impulse response as an odd function plus signum times the same function. This second term is even and the left hand part of it exactly cancels the left hand part of the first odd term, thereby ensuring causality. The even and odd decomposition of the casual impulse response yield the real and imaginary parts of the frequency response, respectively. Using the fact that multiplication by the signum function in the time domain is equivalent to the Hilbert transform in the frequency domain, we can calculate the real part solely from knowledge of the imaginary part or visa versa.
The Kramers-Kronig relations give a condition that is both necessary and suf- ficient, so even before applying an inverse Fourier integral, you can determine whether a given frequency response will yield a causal or a non-causal impulse response. If the real and imaginary parts are Hilbert transforms of each other, the impulse response is causal, and not otherwise. This fact is very useful because it allows us to test whether or not a frequency response is causal without ever having to leave the frequency domain.
Keysight’s ADS Transient Convolution Element contains a convolution simulator that uses the Kramers-Kronig relationship as part of its algorithm to build passive and delay causal models from frequency-domain data like S-parameters. For more information, refer to the article “S-parameters Without Tears” in RF DesignLine at: http://www.rfdesignline.com/howto/222400306 and the ADS Signal Integrity brochure: http://www.keysight.com/find/eesof-si-design-with-ads.
Figure 9. The real part of the example frequency response comes entirely from the even part of the time response (Figure 2, in this case). Physically, the switchback corresponds to a damped resonator that can respond to a stimulus below its resonant frequency (30 MHz), but that
“turns off” above it, because it can no longer respond quickly enough.
www,keysight.com
www.keysight.com/find/eesof
For more information on Keysight Technologies’ products, applications or services, please contact your local Keysight office. The complete list is available at:
www.keysight.com/find/contactus
Americas
Canada (877) 894 4414
Brazil 55 11 33 51 7010 Mexico 001 800 254 2440 United States (800) 829 4444
Asia Pacific
Australia 1 800 629 485
China 800 810 0189
Hong Kong 800 938 693
India 1 800 112 929
Japan 0120 (421) 345
Korea 080 769 0800
Malaysia 1 800 888 848 Singapore 1 800 375 8100
Taiwan 0800 047 866
Other AP Countries (65) 375 8100
Europe & Middle East
Belgium 32 (0) 2 404 93 40 Denmark 45 45 80 12 15 Finland 358 (0) 10 855 2100
France 0825 010 700*
*0.125 €/minute Germany 49 (0) 7031 464 6333
Ireland 1890 924 204
Israel 972-3-9288-504/544
Italy 39 02 92 60 8484
Netherlands 31 (0) 20 547 2111
Spain 34 (91) 631 3300
Sweden 0200-88 22 55
United Kingdom 44 (0) 118 927 6201
For other unlisted countries:
www.keysight.com/find/contactus
(BP-04-10-14)