Policy Research Working Paper 5741
What Did the Maoists Ever Do for Us?
Education and Marriage of Women Exposed to Civil Conflict in Nepal
Christine Valente
The World Bank
Poverty Reduction and Economic Management Network Gender and Development Unit
July 2011
WPS5741
Public Disclosure AuthorizedPublic Disclosure AuthorizedPublic Disclosure AuthorizedPublic Disclosure Authorized
Produced by the Research Support Team
Abstract
The Policy Research Working Paper Series disseminates the findings of work in progress to encourage the exchange of ideas about development issues. An objective of the series is to get the findings out quickly, even if the presentations are less than fully polished. The papers carry the names of the authors and should be cited accordingly. The findings, interpretations, and conclusions expressed in this paper are entirely those of the authors. They do not necessarily represent the views of the International Bank for Reconstruction and Development/World Bank and its affiliated organizations, or those of the Executive Directors of the World Bank or the governments they represent.
Policy Research Working Paper 5741
Between 1996 and 2006, Nepal experienced violent civil conflict as a consequence of a Maoist insurgency, which many argue also brought about an increase in female empowerment. This paper exploits within and between- district variation in the intensity of violence to estimate the impact of conflict intensity on two key areas of the life of women in Nepal, namely education and marriage.
Overall conflict intensity had a small, positive effect on
This paper is a product of the Gender and Development Unit, Poverty Reduction and Economic Management Network, with generous funding from the Government of Norway. It is part of a larger effort by the World Bank to provide open access to its research and make a contribution to development policy discussions around the world. Policy Research Working Papers are also posted on the Web at http://econ.worldbank.org. The author may be contacted at christine.valente@sheffield.ac.uk.
female educational attainment, whereas abductions by
Maoists had the reverse effect. Male schooling was not
significantly affected by either conflict measure. Conflict
intensity and Maoist abductions during school age both
increased the probability of early female marriage, but
exposure to conflict during marriageable age does not
appear to have affected women’s long-term marriage
probability.
What Did the Maoists Ever Do for Us?
Education and Marriage of Women Exposed to Civil Conflict in Nepal
Christine Valente
aUniversity of Sheffield, U.K.
JEL Codes: I20, J12, O12
Keywords: Civil conflict, Education, Marriage, Gender, Nepal.
aEmail: christine.valente@sheffield.ac.uk. I thank INSEC for sharing their conflict data. I also thank Martha Ainsworth, Quy-Toan Do, Helge Holterman, Steve McIntosh, Gudrun Østby, Kati Schindler, Olga Shemyakina, Hassan Zaman, the World Bank’s Nepal Country Director's office, and participants at two Gender and Conflict Research Workshops at the World Bank (Washington) and PRIO (Oslo) for their useful comments. Funding by the World Bank-Norway Trust Fund is gratefully acknowledged. The views expressed in this paper are mine alone and do not necessarily reflect those of the funding agencies. All errors are my own.
2 1. Introduction
Between 1996 and 2006, Nepal experienced violent civil conflict as a consequence of a Maoist insurgency. Numerous human rights violations were recorded, going from direct casualties in violent exchanges between Maoist insurgents and government forces, to rape and torture of civilians by the army, and extortion and abductions by rebels. Over 13,000 people died during the conflict, and an estimated 200,000 were displaced (US Agency for International Development, 2007). Contrary to a few conflict episodes of extraordinary magnitude which have attracted much attention in the literature such as Rwanda and Burundi, the Nepalese civil conflict has been of moderate intensity, involving the displacement of less than 1% of the population.
Although men are typically more affected by direct conflict-related mortality, women face more insidious challenges, as they have to take on new roles to replace men who get involved in the fighting or migrate for work, are more vulnerable to sexual violence, and, in many developing societies, may have to bear more heavily the brunt of reduced family resources.
Given the ubiquity of violent civil conflict in developing areas of the world, and the well- known additional difficulties faced by women in these countries, it would be useful to better understand the contribution of conflict to female deprivation so as to inform policy. Indeed, there is little evidence of the impact of civil conflict on gender inequality to date.
This is of particular concern in Nepal, where women entered the conflict (in 1996) being very disadvantaged compared to their male counterparts in terms of human development, including education (only 21% of female adults were literate compared to 54% of male adults) and life expectancy at birth (52.4 years as opposed to 55 for men, despite the natural female longevity advantage). To put these figures into international perspective, Nepal’s gender development index stood at 0.27, compared to 0.34 for Bangladesh, 0.42 in India, and a 0.56 average for all developing countries (Ojha, 2004).
In Nepal, however, the insurgents took a strong position against (caste-, ethnicity- and) gender-biased traditions, and although this egalitarian rhetoric was not thoroughly followed in practice, women have been directly involved in combat – it has been reported that up to one- third of guerillas were female – and there is anecdotal evidence of an improvement in the condition of women in areas controlled by the Maoists, e.g., through a decrease in polygamy, domestic violence, and alcoholism (Lama-Tamang et al., 2003; Manchanda, 2004; Geiser, 2005;
Ariño, 2008). On the one hand, direct involvement in fighting should heighten the adverse
3
impact of the conflict on women. On the other hand, many more women have not been involved in the fighting and may have experienced both the expected adverse effects of war and some degree of social improvement due to the Maoist influence – whether due to genuine social change, fear of insurgent reprisal, or the unintended increase in female participation in activities traditionally reserved to men due to the men’s involvement in the fighting and migration to seek work elsewhere (Menon and Rodgers, 2011). The overall impact on gender inequality is therefore unclear.
In this paper, I exploit within- and between- district variation in the intensity of violence, as measured by the number of fatalities, but also school destructions, and abductions by Maoists, to shed light on ways in which the conflict affected two key areas of decision in a woman’s life, namely education and family formation. More specifically, I estimate the impact of conflict intensity on educational attainment for men and women and on the probability of marriage (for women). Violent civil conflict may affect education, and may do so unevenly for men and women for a variety of reasons. In addition, the functioning of the marriage market may be affected by conflict either directly, or indirectly through changes in schooling.
Educational attainment is generally expected to be adversely affected by exposure to violent civil conflict. Direct youth enrollment in the military, limited mobility, and the destruction of schools may all negatively affect the ability of children to attend school. Increased poverty may pressurize parents into taking children out of school (to avoid direct costs), and putting them to work (to avoid opportunity costs). Political instability and reduced life expectancy may decrease the expected returns to education and, in turn, reduce investments in human capital. Last but not least, in the case of Nepal, parents may have been deterred from sending their children to school out of fear of having them abducted by the insurgents (Human Rights Watch, 2004). Quoting figures from the Informal Sector Service (INSEC), UNESCO (2010) reports that between 2002 and 2006, the Maoists destroyed 79 schools, one university and 13 district education offices, while 10,621 teachers and 21,998 students were abducted (p.8). According to additional data provided by INSEC, the total number of abductions by Maoist forces during the whole conflict totaled over 85,000. While most abductees were seemingly returned safe and sound after a few days of intensive indoctrination (Macours, 2011), a number of youths joined the Maoists fighters (in 2003, an estimated 30% of Maoists forces were aged 14-18) and between 1996 and 2006, 145 teachers and 344 students were killed and many more wounded (UNESCO, 2010).
The adverse effect on education could be higher for women if a conflict-related decrease in
income affects investment in female human capital disproportionately or if there are
overwhelming concerns about physical violence (including sexual violence) leading the
4
movement of girls to be more restricted than that of boys. On the other hand, if the leading channel through which conflict decreases human capital accumulation is through direct engagement of children in fighting, then boys would be more negatively affected.
However, the general expectation that schooling should be disrupted in regions of more intense fighting may not be very well founded in Nepal. First, national trends do not indicate an increase in poverty coinciding with the conflict but a steady decrease in poverty instead (World Bank, 2005). Second, the insurgents have been reported to actively and coercively challenge traditions that tend to decrease educational attainment, namely discrimination against women, lower castes and indigenous ethnic groups (Hart, 2001; Lama-Tamang et al., 2003; Aguirre and Pietropaoli, 2008).
In Nepal, marriage is almost universal, arranged marriages are the norm, and early marriages
are quite common, especially for girls. Nearly 80 percent of 20-year old women and of 25-year
old men surveyed in the 2001 and 2006 Demographic and Health Surveys of Nepal were already
married (Figure 1). Adverse economic conditions such as those potentially brought about by
civil conflict and a potential shortage of husbands due to the fighting and migration are unlikely
to affect the quasi-universality of marriage, but violent conflict could lead to an increase in the
proportion of women who do not marry and are therefore likely to end up in submissive
positions in the household of a relative. Younger brides are generally preferred by prospective
grooms, so that the dowry attached to them is lower. Civil conflict may therefore also lead
impoverished parents to favor early marriages. If the conflict affects female educational
outcomes, it is also likely to have an impact on early marriage, as girls who leave school earlier
are more likely to be married young. In addition, the strong focus on sexual purity, of unmarried
girls especially, in most religious groups of Nepal, combined with the reported prevalence of
rape during the conflict (Manchanda, 2004; Ariño, 2008), may have ruined the chances of
marriage for a number of rape victims, or encouraged parents to marry their daughters early to
prevent it. On the other hand, Maoist insurgents are reported to have opposed early marriage and
even tried to abolish dowry (Hart, 2001; Manchanda, 2004; Aguirre and Pietropaoli, 2008), and
Maoist recruitment targeted girls under 18, which may have contributed to increase age at
marriage. Age at marriage matters insofar as women who marry younger are more likely to have
an inferior position in the couple (Niraula and Morgan, 1996). Marriage practices largely
condition the future life of the spouses, especially so for women, and so the impact of civil
conflict on marriage is of major importance for the human capital accumulation, fertility, and
long-term wellbeing of women.
5
Figure 1 goes about here.
In the next section, I review the existing evidence on the impact of conflict on education and family formation, with an emphasis on male-female differences, before turning to the presentation of the Nepalese context in Section 3, data and estimation methods in Section 4, and estimation results in Section 5. Section 6 concludes.
2. Literature Review 2.1. Education
As put by Blattman and Miguel (2010) in a recent survey of causes and consequences of civil wars, “The leading question is not whether wars harm human capital stocks, but rather in what ways, for whom and how persistently” (p.64). The evidence is still scant, however, and there is no emerging consensus. A number of cross-country analyses suggest that political instability has large negative effects on growth (see Blattman and Miguel (2010) for a review), but results from better-controlled studies using within-country variation in the intensity of conflict are more mixed. Miguel and Roland (2006) find that, 25 years down the line, living standards and levels of human capital had converged between regions of Vietnam differentially affected by bombings during the Vietnam War after instrumenting the number of bombings with distance to the 17
thparallel north latitude. Other within-country, macro-studies have investigated the impact of bombing on city-level population growth, with varied results as to the duration of the war effect. Davis and Weinstein (2002) found that, in Japan, the destruction only had a short- term effect on population growth. Findings in Brakman et al. (2004) indicate that most but not all of the effect of WWII bombings in Germany was temporary in Western Germany, but that it was persistent in the long run in Eastern Germany.
At the microeconomic level, results from an emerging (difference-in-difference) literature on
the impact of war-related destruction or civil conflict on educational attainment suggest that the
effect of conflict is highly heterogeneous, and depends on conflict characteristics, age and
gender. Although results vary from one context to the other, overall the main losers appear to be
girls in post-primary education, while the evidence of an adverse impact for primary education is
generally non-existent (or even sometimes suggests a counterintuitive positive effect). Akbulut-
Yuksel (2009) finds that German individuals of school age during World War II who lived in
cities more heavily targeted by allied bombings had significantly less education than cohorts
born later, compared to individuals of the same age exposed to less bombings. In Guatemala,
where the worst period of the Guatemalan civil war (1979-1984) saw over 25,000 deaths (to be
compared with a current Guatemalan population of 13 Million), Chamarbagwala and Morán
6
(2011) find that individuals who were of schooling age in departments more affected by the war between 1979 and 1984 completed fewer years of schooling, and that this effect was much more marked for girls (who lost 0.55 years compared to a loss of 0.13 for boys). Nevertheless, the authors also find a significant, positive correlation between conflict intensity and educational achievement at low grades (Grades 1 to 3), while the main losers appear to be girls found in higher grades (Chamarbagwala and Morán, 2008). In Bosnia and Herzegovina, Swee (2009) estimates that cohorts of children exposed to higher intensity of conflict at the municipality level were less likely to complete secondary schooling, but that primary attainment was unaffected.
Shemyakina (forthcoming) finds that girls (but not boys) who were of schooling age during the Tajik civil war of 1992-1998 in areas severely affected by conflict events are less likely to complete mandatory schooling (9 grades). Rodriguez and Sanchez (2009) conclude that, in Colombia, children aged 12 and older exposed to more violence at the municipality level are more likely to drop out and enter the labor market. Three recent papers, one by Akresh and de Walque (forthcoming), and two by Jeannie Annan, Christopher Blattman and colleagues (Annan et al., 2009; Blattman and Annan, 2010) illustrate the marked heterogeneity in findings on the impact of civil conflict across demographic groups and across conflicts. Akresh and de Walque (forthcoming) analyze the impact of the Rwandan genocide on schooling outcomes. They estimate that cohorts of children exposed to this extremely violent conflict episode, which killed 10 percent of the country’s population, completed 18.3 percent fewer years of education. But contrary to results from, e.g., Guatemala (Chamarbagwala and Morán, 2011), they find that non- poor, male individuals were more negatively affected. Studying the effect of forced recruitment into the Ugandan Lord’s Liberation Army, Jeannie Annan, Christopher Blattman and colleagues find dramatically different effects for men and for women, in the opposite direction to, e.g., Shemyakina (forthcoming) and Chamarbagwala and Morán (2011). Abducted men, who, in their sample, were on average abducted for just over 15 months, experienced much worse educational attainment and labor market outcomes, as well as poorer psychological health (Blattman and Annan, 2010). But they find no such effects for female abductees, which they attribute to the lack of opportunities for women in general (Annan et al., 2009).
2.2. Marriage
Marriage practices are likely to be affected by violent civil conflict, be it for economic
reasons (marriages are expensive, especially for the parents of the bride who have to pay the
dowry), as a direct consequence of the fighting (groom shortages, delayed decisions due to
uncertainty over the survival of a young groom, Maoist opposition to religious traditions), or
7
because of the migration of young males likely induced by conflict. 200,000 people are believed to have been displaced due to the conflict (US Agency for International Development, 2007).
However, recent research investigating the direct effect of violence on migration decisions in one district of Nepal moderately affected by the conflict finds that conflict intensity does not increase the probability of migration outside the district, and that there is a U-shaped relationship for migration inside the district, after controlling for individual socio-economic and demographic indicators (Bohra Mishra and Massey, forthcoming).
Despite the existence of several studies of the impact of economic shocks on marriage (e.g., Caldwell et al., 1986; Palloni et al., 1996; Nobles and Buttenheim, 2006), to the best of my knowledge there are only two previous analyses looking into the effect of civil conflict on marriage. Shemyakina (2009) presents difference-in-difference estimates of the impact of exposure to the Tajik conflict on the probability of marriage at a given age and finds that women more exposed to violent conflict were 30% less likely to be married at a given age than women in areas less exposed to violence. In a less well controlled study, Jayaraman et al. (2009) find that women living in areas more affected by the 1994 Rwandan genocide married later compared to women with similar childhood rural or urban location, religion, education, and age category, but living in areas less affected by the genocide.
3. Nepalese Background 3.1. General
Nepal is a landlocked country located between China and India, that counted over 23.2 Million inhabitants during the last census in 2001 (28.6 Million estimated as of June 2008).
Two-thirds of the population are employed in agriculture, nearly one third of the population lives
below the poverty line, and Nepal is one of the 20 poorest countries in the world in terms of
GDP per capita (CIA Factbook). The average education level in Nepal is very low. In the sample
used in this paper for the baseline analysis, which, as explained in Section 4.2, comprises
children aged 5-9 or 16-19 at the beginning of the conflict, summary statistics in Panel A of
Table 3 show that about three quarters of males, and just above half of females had completed
primary education when observed in 2006, i.e., when aged 14 or older. Primary schooling
completion is therefore a relevant cut-off when analyzing the impact of conflict. Related to this
low educational level, summary statistics in Panel C of Table 3 show that between 16.7 and 20.7
percent of women aged 6-9 or 16-19 at the beginning of the conflict were married by the age of
15, depending on district conflict intensity.
8
Despite a relatively intense and durable civil conflict, Nepal has experienced steady growth in real gross GDP (5% per year between 1995/96 and 2003/04), an additional increase in disposable income due to huge flows of remittances from abroad (representing 12.4% of GDP), seen a steady decrease in poverty over the period (from 42% in 1995/96 to 31% in 2003/04), as well as an improvement in human development indicators such as primary school enrollment (up from 57% to 73%) and child mortality, which decreased by 5% per year (World Bank, 2005;
Macours, 2011).
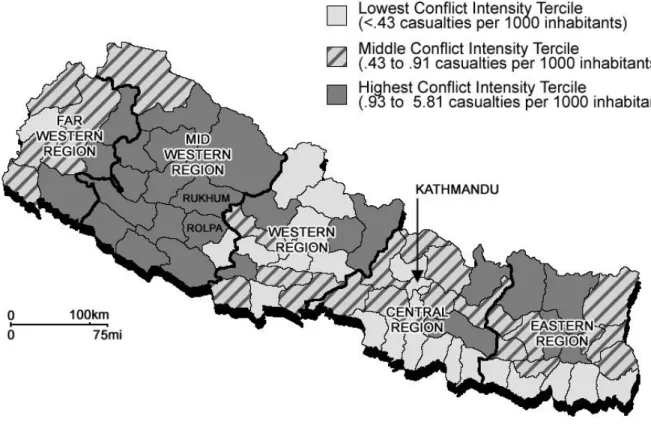
Nepal comprises seventy five districts divided between five development regions: Far Western, Mid-Western (where the conflict started), Western, Middle, and Eastern. The Middle region is richest, and, just before the start of the conflict, the prevalence of poverty was increasing as one moved further West (World Bank, 2005). The intensity of conflict varied widely across districts, and I use this variation in order to identify the effect of conflict.
3.2. Conflict
Nepal was an absolute monarchy until 1990. Despite multiparty democratic elections being held in 1991, a Maoist insurgency broke out in 1996, only to end in 2006. The insurgency started in February 1996 in the Rolpa district. At first, it was concentrated in a few Communist strongholds in Western Nepal, but by the end of the war, conflict-related casualties were recorded in 73 out of the 75 Nepalese districts. The Maoist presence varied from sporadic attacks to the organization of their own local governments and law courts. Over the course of the conflict, Maoists attacked government targets such as army barracks, police posts, local government buildings (Do and Iyer, 2010). They were also reported to terrorize, loot, abduct, and physically assault civilians (Bohara et al., 2006). On the other hand, government security forces also killed civilians and were accused of using children for spying, torturing, displacing and summarily convicting civilians (Bohara et al., 2006).
The principal objective of the insurgents was to obtain the creation of a constituent assembly to draft a new constitution. Other important aims were stated to be: land redistribution and equality for all castes, language groups, and women.
Figure 2 goes about here
A crucial moment in the conflict was the end put by the Maoists to a short-lived cease-fire
agreed in 2001. From then on, the government's response intensified dramatically, involving the
Royal Nepal Army, leading to an escalation of violence (see Figure 2). Another cease-fire was
9
agreed and broken by the Maoists in 2003, who then extended their actions to urban areas (Do and Iyer, 2010), going as far as imposing a week-long blockade of the capital Kathmandu in August 2004. Building on opposition to King Gyanendra's authoritative reaction to the prolonged conflict, the Maoists joined forces with some of the country's major political parties, leading to the signature of a peace agreement in November 2006 and the creation of an interim government led by a power-sharing coalition including the Maoists.
Figure 3 goes about here
The intensity of conflict varied much across districts of Nepal, as illustrated in Figure 3, which depicts the distribution of districts between the three terciles of conflict deaths per 1000 inhabitants. One specificity of the Nepalese conflict, which is likely to be particularly relevant for an analysis of educational and marriage outcomes, is the insurgents’ practice of abducting civilians, and more particularly of abducting school children en masse. Contrary to the case of the Ugandan Lord’s Resistance Army mentioned earlier, abductees were generally freed after a few days of indoctrination. According to Human Rights Watch (2004), this indoctrination took the form of lectures on Maoism, on the abductees’ rights as citizens, and Maoist songs and dances. As illustrated by Figure 4, there is a strong correlation between the number of abductions by Maoists and intensity of fighting as measured by conflict-related casualties, but the relationship is not systematic. Districts with the highest proportion of abductees among the population are found in the middle casualties tercile, which may be due to a lesser need for indoctrination in the Maoist strongholds.
Figure 4 goes about here
Several arguments have been put forward to explain the district variation in the intensity of the insurgency, including geography (Murshed and Gates, 2005; Bohara et al., 2006; Do and Iyer, 2010), poverty (Murshed and Gates, 2004; Do and Iyer, 2010), lack of political participation (Bohara et al., 2006), and inter-group inequality (Murshed and Gates, 2005;
Macours 2011). But very little is known so far of the impact of the conflict, both at the aggregate and gender-differentiated levels.
The term civil conflict encompasses a wide array of violent episodes, from isolated clashes
between government and rebel groups to the loss of 10 percent of a country’s lives as in
Rwanda. Even less extreme instances on which the body of knowledge on the microeconomic
10
impact of conflict is based are of comparatively high magnitude, such as Guatemala, where 200,000 people died and 8.3 percent of the population were displaced (Chamarbagwala and Morán, 2011) and Tajikistan, where between 50,000 and 100,000 people died in a year, about 10 percent of the population was displaced, and 80 percent of the country's industry destroyed (Shemyakina, forthcoming). Although some conflict years exceeded the 1,000 battle-deaths threshold commonly used to define civil war, Nepal’s armed conflict was one of moderate intensity, and so an interesting case study towards an understanding of the magnitude of conflict effects across the conflict intensity spectrum.
The question of the impact of the Nepalese civil conflict is especially intriguing in the face of the contradictions highlighted in qualitative accounts between, on the one hand, the destruction brought about by the conflict, and, on the other hand, positive, often unintended, consequences of the insurgency. Shedding light on the impact of this civil conflict episode is particularly interesting given the rapid economic development experienced by the country as a whole. The development record of Nepal during the conflict is puzzling on more than one account. Conflict theory and evidence suggest that slow growth and poverty are favorable to conflict (so that sustained growth is expected to decrease the duration of the conflict), and that conflict has adverse consequences on poverty and growth (Blattman and Miguel, 2010). In particular, one would expect exposure to conflict to be detrimental to household income and wealth due to war- related disruption, destruction and looting, and thus in turn to investments in human capital. The positive national trends with respect to aggregate development indicators are compatible with two hypotheses: (1) the conflict has tamed down, but not prevented growth and development;
and (2) positive changes brought about by the insurgency (either directly or as an unintended byproduct) have more than compensated the adverse effects of the conflict. If (1) applies, then one would expect to find that, at the sub-national level, socio-economic outcomes such as education did not improve as much where there was more fighting. If this is not the case, then either (2) prevails or the conflict has only tamed down growth and development through macroeconomic channels that affected the whole country, and which could only be appraised under very strong assumptions regarding the national counterfactual of Nepal in the absence of conflict.
In this paper, I rely on within- and between-district variation in the intensity of violence to
investigate differential changes in primary educational attainment, school enrollment, completed
years of education, and the probability of being married across districts experiencing varying
degrees of violence, in order to test the above hypotheses.
11 4. Data and Estimation Strategy
4.1. Data
Demographic and Health Surveys (DHS) have been carried out in a number of developing countries as part of the Measure DHS project, a reputable USAID-funded project aimed essentially at providing detailed, reliable information on fertility, family planning, maternal and child health and mortality. The second and third DHS carried out in Nepal took place in 2001 and 2006, respectively, and are repeated cross-sections, not panel data. In 2001, six out of 257 sampling units had to be dropped from the sample for security reasons (Ministry of Health et al., 2002, p.6). But in 2006, conflict was nearly over everywhere, and so data collection could proceed without hindrance.
For each DHS, a national sample of households is first interviewed using a household questionnaire collecting usual individual demographic and education data, as well as household-level socio-economic information such as ownership of durable goods and housing materials. The demographic characteristics of individual members are then used to determine which members are eligible for individual interviews, namely all women aged 15- 49 (DHS 2006) or all ever-married women aged 15-49 (DHS 2001), as well as a subset of males aged 15-59. The data used for the education analysis comes from the household questionnaire, whereas that used for the marriage study comes from individual interviews with eligible women.
Summary statistics, by district conflict intensity and specification subsample, can be found in Table 3.
Another national dataset carried out in Nepal during the relevant period is the Nepalese
Living Standard Survey (NLSS) of 2003/2004. Given the timing of the conflict, the DHS is
generally more useful for the present analysis since data collection occurred later. As a
consequence, the outcomes of interest (namely, education and marriage) are more likely to
be realized for cohorts exposed to the conflict in 2006 than in 2003/2004. In addition, since
the conflict was raging at the time of the NLSS data collection, there were more difficulties
with data collection than in the 2006 DHS. Finally, we need to focus on specific cohorts to
identify the effect of exposure to the conflict, and so the larger sample sizes provided by the
DHS are particularly valuable. Nevertheless, one advantage of the NLSS over the DHS is
that the NLSS collected data on the individual’s district of origin before migrating to the
12
place where he or she is surveyed. The DHS only has data on the date at which individuals interviewed individually moved to their current place of residence. This information is not available for household members not eligible for an individual interview, and so it is not applicable to the sample used in the education analysis. In the next section, I explain how I can nonetheless check the robustness of my education findings based on DHS data to conflict-related migration.
The NLSS data on the individual’s district of origin before they last migrated is particularly useful in the marriage analysis, since in Nepal, as in most of South Asia, marriage is patrilocal. Marriage is therefore often accompanied by migration, not uncommonly to a different district, and so this may create both classical and non-classical measurement error in the district-level conflict measures used here. In particular, if when conflict was very intense, parents used marriage as a way of putting their daughters to safety by marrying them to men from more peaceful districts, this may create an artificially positive correlation between being married and being observed in a low-conflict intensity district.
Therefore, when analyzing the impact of conflict on marriage, I present estimation results using data from both the DHS and the NLSS.
1The data used to measure conflict intensity are taken from electronic files provided by the Informal Sector Service Center (INSEC), an independent, well-regarded, human rights NGO based in Kathmandu and with representatives in each of the 75 Nepalese districts, who monitor human rights violations. Data from INSEC has been extensively used in the media, international agencies and government reports, and in a number of academic studies, including Bohara et al. (2006) and Do and Iyer (2010). The INSEC data files contain the number of conflict-related deaths per month per district of Nepal between February 1996 and December 2006, as well as the total number of school destructions and abductions by Maoists at the district level, which are used to construct most measures of exposure to conflict used in this paper.
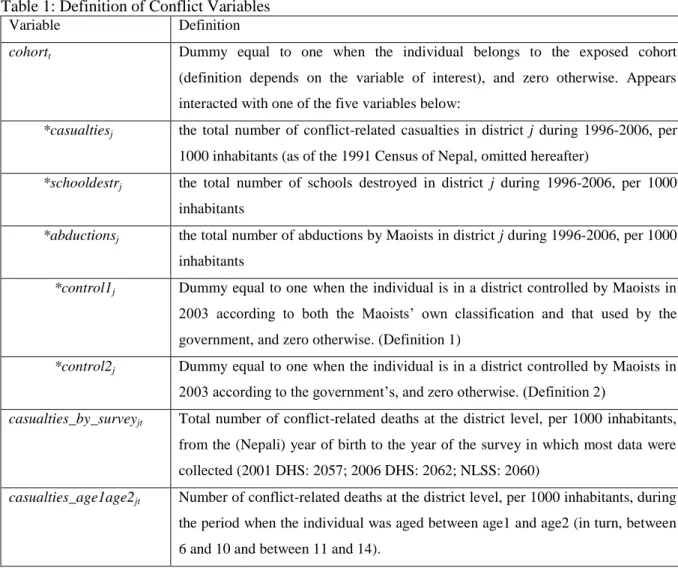
I also use two indicators of Maoist control over the district by 2003, based on classifications reported by Hattlebak (2007). I consider in turn two alternative definitions of Maoist control. I first categorize as under Maoist control any district that is categorized as such by both Maoists and the government (Definition 1). I then apply what Hattlebak (2007) considers the more reliable classification of the two, namely the government classification (Definition 2). The definition of all the conflict exposure variables used in this paper can be found in Table 1.
1 NLSS Data was provided by the Nepalese Central Bureau of Statistics (CBS).
13
Table 1 goes about here
4.2. Estimation Strategy
All the analyses described below rely on within-district variation in exposure to conflict and are thus robust to correlation between the intensity of conflict at the district level and any other time-invariant characteristics of the district that also influence the explained variable. Although specifications vary, the approach is essentially of the difference-in-difference type. The main threat to identification is therefore the possibility that time-varying omitted factors may be correlated both with the left-hand-side variable and conflict exposure.
Research on the causes of the Nepalese conflict summarised in Section 3 has shown that conflict was more intense in more mountainous and forested regions, and up until 2002, in poorer areas. These characteristics are also likely to have an effect on education and the marriage market and it is therefore essential to control for regional differences. This is done in several ways. First, the inclusion of district fixed effects ensures that any time-invariant differences in the explained variable between districts with different degrees of conflict are differenced-out.
Second, all regressions include region-specific time dummies, i.e., for each year except the first one, which is the omitted category, there are five dummies corresponding to each of the five development regions of Nepal. Figures in World Bank (2005, p.6) show that poverty has decreased at a different pace across these five regions, and this may confound the effect of conflict if the intensity of violence is caused not only by levels but also by trends in poverty. The region-specific time dummies fully capture these different regional trends, and imply that the source of identification of the effect of conflict is the variation in conflict intensity within development region, net of district-specific constant characteristics and time-varying characteristics that are common to all districts in a given region. Third, I test for the presence of differential pre-conflict trends correlated with future conflict, which is equivalent to carrying out a series of placebo experiments. Fourth, I use several identification strategies, relying, in turn, on (i) a comparison of cohorts that are exposed (treated) and not exposed (control) to conflict, and (ii) a comparison of outcomes for individuals of a given age observed just before the conflict escalated (in 2001) and at the end of the conflict (2006), thus comparing individuals born only five years apart but experiencing very different conflict intensity.
Two issues of particular concern when estimating the impact of any conflict episode are
mortality selection and migration. In the case of Nepal, the number of conflict-related deaths was
14
sufficiently small to rule out mortality selection as an important source of bias. With less than 1 percent of the population forcibly displaced, the sample selection bias potentially caused by forced migration is not as high as in many other conflict situations, but should not be ignored.
More importantly, Nepal has seen growing numbers of voluntary migration over the past decade, and these migration patterns may well be correlated with conflict intensity. Since conflict intensity is measured at the district level in this paper, migration within district does not pose any estimation issues. In their case study of Chitwan, Bohra-Mishra and Massey (forthcoming) find that conflict-related violence does not increase the probability of migration outside the district, but the experience in Chitwan is unlikely to be representative of the whole country. I tackle the migration issue in several ways, depending on data availability. In the marriage analysis, migration bias is likely to be particularly severe since women move to the place of residence of their groom upon marrying, which could be in a different district. Even if these movements were unrelated to conflict intensity, classical measurement error in exposure to conflict would lead to attenuation bias. Therefore, I provide estimates for the whole DHS sample as well as for the sample of women who, at the start of the conflict in 1996, already lived where they are interviewed in 2006. I also provide a robustness check in which I use the NLSS, and so can construct the conflict exposure variable on the basis of conflict-related casualties in the district of residence year by year. In the education analysis, there may also be a migration bias when education outcomes are observed at an age at which some individuals may have migrated away from the district. One of the specifications addresses this concern by comparing the change in educational outcomes for individuals aged 14 or younger, between the 2001 DHS and the 2006 DHS. At such a young age, voluntary migration is extremely unlikely to have occurred.
Education
a. Specification 1: Plain difference-in-difference
This specification corresponds to the most traditional case of difference-in-difference. I define two cohorts, one not exposed to conflict (“control”) and one exposed to conflict (“treated”), and compare the difference in primary attainment between these two cohorts and across districts characterised by different levels of conflict intensity.
An inspection of the data shows that, although the legal age for the start of schooling is 6
years old and there are five years of primary schooling, a sizeable proportion of children is
enrolled in primary school before 6 (70.1% at 5) and until 14 (16.1%) in the 2006 DHS, with
15
numbers decreasing sharply afterwards (7.9% at 15 and 2.85% at 16).
2Therefore, an analysis of the effect of conflict on primary schooling attainment should consider children aged 14 or more at the time of the survey, and control cohorts should have been at least 15 at the beginning of the conflict, and preferably slightly older. I define the treated cohort as comprising individuals aged 5 to 9 years old at the start of the conflict in 1996, so that all treated cohorts are exposed to the conflict during most of their potential primary schooling career and the youngest exposed cohort is observed at age 14 in the 2006 DHS. The control cohorts include individuals aged 16 to 19 at the start of the conflict. I exclude cohorts aged 10 to 15 in 1996, as the treatment status of these cohorts is less clear-cut: many of these individuals could have been enrolled in primary schooling during the conflict, but they were not exposed to conflict during their whole primary schooling careers.
More specifically I estimate the following equation using the fixed effects estimator, and using data from the 2006 DHS:
Y
ijrt= β
1district
j+ β
2region
r*year
t+ β
3(cohort
t*casualties
j) + ε
ijt(1)
Where Y
ijrtis a dummy equal to one if the individual has completed primary education, and zero otherwise; district
jis a set of district fixed effects, and region
r*year
tare a set of interaction terms between binary indicators for each of Nepal’s five development regions and a set of birth year dummies year
t(excluding the first year). cohort
t*casualties
jis the interaction between a dummy equal to one when the individual belongs to the treatment cohort and the number of conflict- related casualties (per 1000 inhabitants) in district j during 1996-2006.
Under the assumption that there is no correlation between the number of district casualties and unobserved district-time-varying factors (after controlling for region-specific year fixed effects), β
3identifies the average treatment effect of exposure to conflict on those exposed.
I also estimate variants of Equation (1) in which I add a regressor capturing specific aspects of the conflict which are likely to have affected schooling outcomes. I include, in turn, the total number of school destructions (per 1000 inhabitants) during the conflict, and the number of abductions by Maoist forces (per 1000 inhabitants) during the conflict. In addition, I consider whether Maoist control over the district had an effect on primary attainment by estimating variants of Equation (1) in which I replace the casualties measure by an indicator variable switching on when the district was under Maoist control.
2 In the 2001 DHS, 44.4% of 5-year olds, 24.6% of 14 year olds, and 13.6% of 15 year olds are enrolled in primary schooling.
16
Household characteristics should not be included as regressors because these are only observed at the time of the survey, not at the time of exposure to conflict.
b. Specification 2: Comparison of cohorts experiencing the same total exposure to conflict, but at different periods in their lives
An alternative identification strategy is to compare the outcomes of individuals, who despite having been exposed, during their potential primary schooling life, to the same degree of violent conflict, have experienced a different intensity of conflict at a given age. The timing of exposure is likely to matter: the existing microeconometric evidence on the impact of conflict on education indeed indicates that the effect of exposure to conflict varies with age at exposure. I therefore estimate the following equation:
Y
ijrt= θ
1district
j+ θ
2region
r*year
t+ θ
3casualties_6_10
jt+ θ
4casualties_11_14
jt+ ε
ijrt(2) Where Y
ijrt, district
jand region
r*year
tare defined as in Equation (1), casualties_age
-_age
+jtis the number of conflict-related casualties per 1000 inhabitants in district j during the years included in a moving window defined by age
-and age
+in the life of an individual born in year t.
c. Specification 3: Comparison of outcomes in 2001 and 2006 for a given age
An alternative way of considering the effect of exposure to conflict is to compare the change in outcomes (e.g., completed years of education) between two surveys for a given age at interview, for districts with a more or less pronounced intensification of conflict between the two surveys. By using two surveys relatively close in time, such as the 2001 and 2006 DHS’s, this approach also has the advantage of comparing cohorts that are only five years apart, which reduces concerns over potential confounders. Furthermore, when the sample is restricted to children under 14 years old, the concern over selection bias due to voluntary migration vanishes.
More specifically, I estimate models of the form:
Y
ijrt= γ
1district
j+ γ
2age
t+ γ
3region
r*age
t*dhs2006
+ γ
4(conflict_by_survey
jt) [+ X
ijrtГ]+ ε
ijrt17
Where Y
ijrtis, in turn, the primary schooling completion dummy, an indicator for enrollment status, and the number of completed years of education. age
tis a set of dummies for the age of the index individual at the time of the survey, dhs2006 is a dummy equal to one for 2006 DHS observations and zero for 2001 DHS observations, and conflict_by_survey
jtis the total number of conflict-related deaths at the district level, per 1000 inhabitants, up to the (Nepali) year in which the bulk of the survey data was collected. The inclusion of region and age-specific dummies for the change in outcome between the two surveys controls comprehensively for potential region- specific, time-varying confounding factors, allowing these to vary by age group. X
ijrtis a vector of household characteristics (binary indicator for rural location, and dummies for the educational attainment of the household head
3). In general, the inclusion of covariates that explain a sizeable share of the variation in the outcome variable tends to increase the precision of the estimate of the treatment effect (Duflo et al., 2008). However, the inclusion of socioeconomic household regressors may cloud the interpretation of the effect of conflict intensity because the latter may have an effect on the former. Therefore, I focus my attention on largely predetermined variables.
Marriage
Given the short time elapsed between the start of the conflict and the latest data available (10 years), it is not possible to estimate the impact of conflict during primary school age on long term marital status. For instance, an individual aged 5 at the beginning of the conflict is only 14 or 15 years old at the time of the 2006 DHS survey. It is however possible to estimate the impact of exposure to conflict during primary schooling age on early marriage, e.g., on the probability of being married by the age of 15 years old.
It is also relevant to analyze the effect of exposure to conflict during core marriageable age (15 to 20 years old for Nepalese women) on long-term marital status. I therefore carry out a separate analysis considering the impact of exposure to conflict during marriageable age on marriage by age 21, at which over 80 percent of women are married (Figure 1).
I start by estimating Equation (1), where Y
ijrtis now a dummy variable equal to one if the woman was married at age 15 or younger, and zero otherwise, and where casualties
jis the number of casualties (per 1000 inhabitants) during 1996-2004
4. The only difference with the treated and control cohorts used in the primary education analysis is that individuals aged 5 at
3 More household characteristics such as female headship, asset ownership, and dwelling materials are available, but these are excluded as they are more likely to be caused by conflict.
4 The Western Calendar is used here for the convenience of the reader. In the analysis, the cut-off point is the end of Nepalese year 2060 (April 2004), which coincides with the bulk of data collection for the 2003/2004 NLSS.
18
the start of the conflict are dropped, since they are only 14 at the time of the 2006 survey and so not eligible to be interviewed individually.
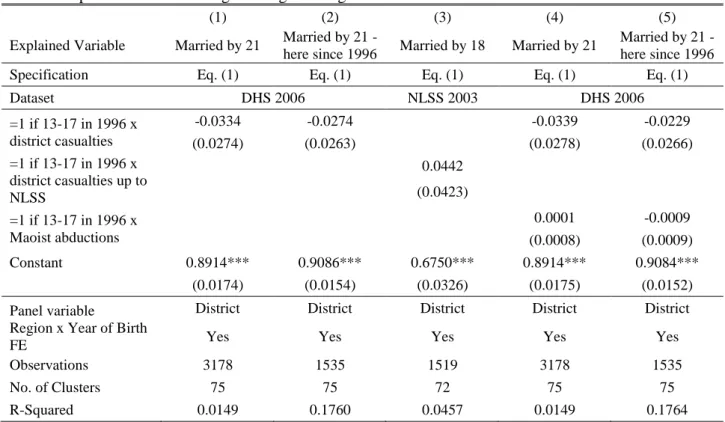
I then estimate the effect of exposure to conflict during marriageable age in a similar specification, but modifying the definitions of the dependent variable, and of the treated and control cohorts accordingly. The exposed cohort comprises individuals aged 13 to 17 years old at the start of the conflict in 1996 and the control cohort comprises those aged 23 to 27 in 1996.
This is based on the observation that marriages tend to start taking place in the mid-teens and that, at the time of the 2006 DHS, all women in the treated cohort were 21 or older. Therefore, the outcome variable is a dummy equal to one if the index woman was married by the age of 21 to account for the right-truncation of the marriage variable. The youngest woman included in the control cohort was aged 23 at the start of the conflict, so that the outcome of interest (whether married by 21) was realised before the start of the conflict for this cohort. When using NLSS data, I keep the same definitions for the treated and control cohorts, but given the earlier date of the survey, the treated cohort is observed at a younger age. Therefore, I consider the probability of marriage by 18 years old instead.
All specifications are estimated using district fixed-effects panel data models, and all models allow for residuals to be correlated in an arbitrary fashion within district to avoid over-rejection of the null hypothesis of zero treatment effect due to serial correlation, following Bertrand et al.
(2004). All outcome variables used in the analysis are listed in Table 2.
Table 2 goes about here
Test of pre-conflict differences in trends
The main threat to identification in a difference-in-difference setting is the potential for unobserved time-varying omitted factors correlated with the treatment. It is impossible to test whether there are such omitted variables coinciding precisely with the treatment at hand. But one can test whether there were differences in time-varying unobservables correlated with future conflict variables before the conflict began. I test for differences in pre-conflict trends correlated with future conflict intensity by running regressions of the form:
Y
ijrt=δ
1district
j+ δ
2year
t+ δ
3(pre_conflict_year
t*conflict
j) + ε
ijrt(4)
where year
tare year of birth dummies, pre_conflict_year
tis the set of year dummies
corresponding to the five youngest cohorts who could not be affected by the conflict, and
19
conflict
jis any of the conflict measures used in the paper. I run these regressions on the sample of the last 10 birth year cohorts not affected by the conflict for the outcome of interest. More specifically, in the primary education and early marriage analyses, the sample comprises individuals aged 15 to 24 at the start of the conflict. In the analysis of marriage by 21 years old, the sample comprises individuals aged 22 to 31 at the start of the conflict. I test for the joint significance of the δ
3’s (using an F-test), which corresponds to a test of differences in pre- conflict trends correlated with future conflict intensity.
5. Results
5.1. Graphical Analysis and Tests for Pre-conflict Differential Trends
Figures 5 to 8 plot trends in primary schooling completion and marriage, by conflict intensity district groups. An inspection of Figures 5 and 6 show a sustained increase over time in the proportion of individuals completing primary education. The upward trend is particularly marked for females, indicating a decrease in educational gender inequality. Three groups of districts are plotted separately, according to the tercile of the distribution of district conflict casualties (per 1000 inhabitants) into which they fall. A comparison of the rate of improvement by conflict intensity tercile suggests that districts where conflict was more intense had lower male and female primary schooling rates pre-conflict compared to low-conflict intensity districts, but have tended to catch up since then, especially for females, for whom they have now overtaken the low-conflict intensity group.
Figures 5 and 6 go about here
Figures 5 and 6 suggest that the catching up started for children who were not exposed to the conflict during their entire primary schooling period, but who, at the start of the conflict, were still at an age at which many Nepalese children are enrolled in primary school (e.g., 24.6% of 14 year olds were enrolled in primary schooling in 2001 ). One concern is that part of the catching up observed in these graphs, where districts are aggregated according to conflict intensity, may be due to differential pre-conflict trends in primary schooling attainment across districts with varying conflict intensity. I test whether this is the case by estimating variants of Equation (4) on the sample of children aged 15 to 24 in 1996.
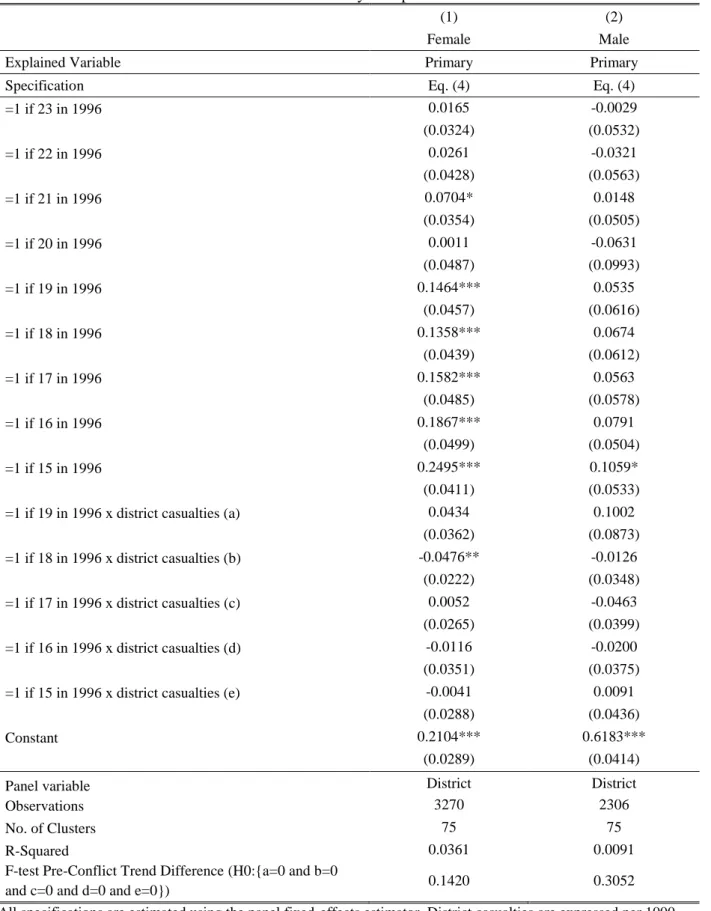
Table A-1 presents results from a regression of Equation (4), where Y
ijrtis an indicator for
primary schooling completion, and conflict
jis the main conflict intensity measure used in this
paper, namely the number of total district conflict casualties per 1000 inhabitants. The
20
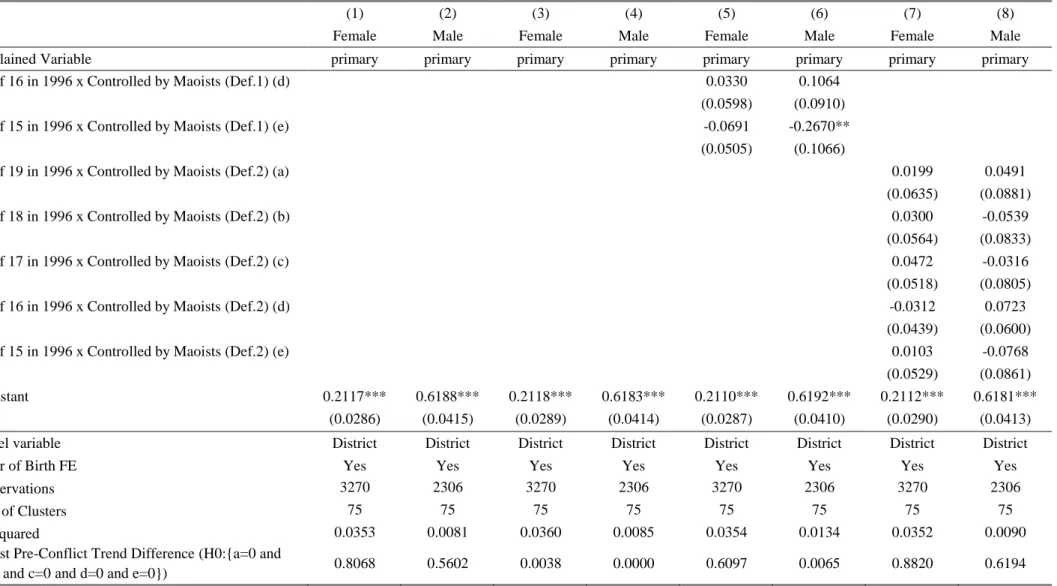
interaction terms between each of the five youngest cohorts are not jointly significant, indicating the absence of differential pre-conflict trends between districts with different degrees of conflict intensity. The coefficient on each interaction term can be interpreted as a placebo experiment identifying the differential change over time in primary completion rates for a given untreated cohort, between districts with varying (future) conflict intensity. The coefficient on the interaction term for women aged 18 in 1996 is statistically significantly negative, indicating that this cohort has a lower primary schooling completion rate relative to older cohorts, in districts where there was more fighting relative to districts with less fighting. This implies that the estimated effect of conflict on the treated cohort in Equation (1) may be biased downwards (i.e., be more negative than the true effect). As we shall see in the next subsection, this bias cannot affect the sign of my estimate, since I find a significantly positive effect.
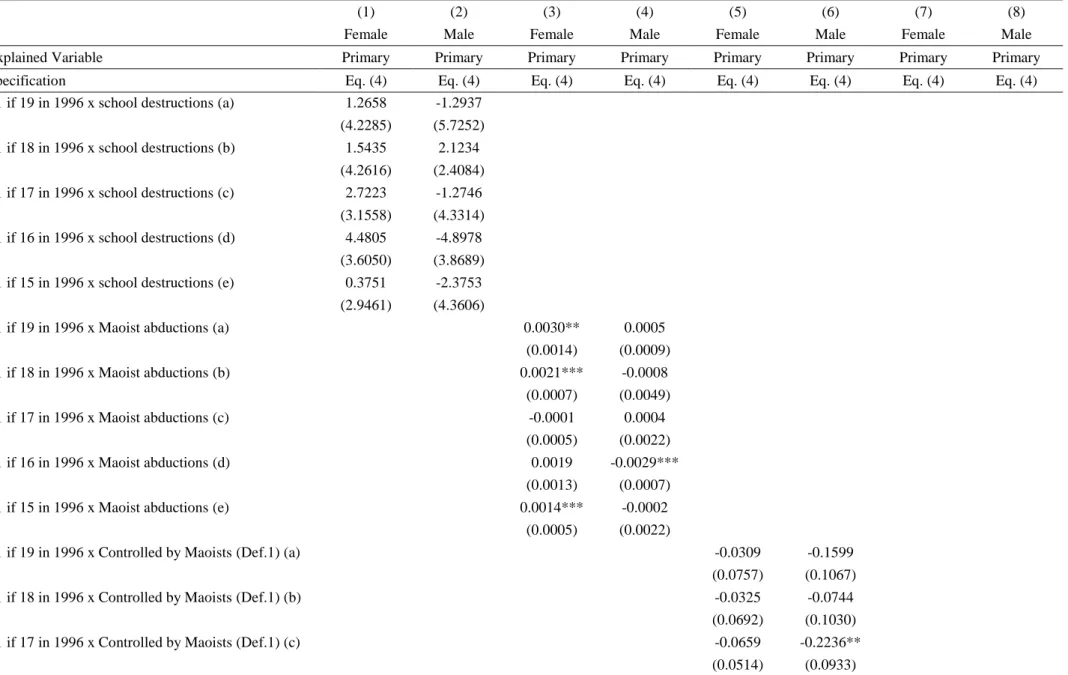
Table A-2 reports tests of pre-conflict differential trends when conflict
jis, in turn, each of the additional conflict intensity measures used in the paper. In the case of Maoist abductions and Maoist control (for males and under definition 1), there is evidence of differential pre-conflict trends. However, in all cases, the direction of the pre-conflict differential trend goes in the opposite direction to the estimated effects of conflict presented in the next section, so that the magnitude of the reported effects is likely a lower bound for the true magnitude of the effect. For instance, in Column (4) we see that the second youngest male non-treated cohort has a lower primary completion rate in districts where there were more abductions. The pre-conflict differential trend would therefore tend to overestimate the magnitude of any negative effect of abductions on male primary schooling. The reverse is true for three of the female cohorts, as shown in Column (3). As we are about to see, I find that abductions have a negative effect on female schooling, but not on male schooling, whereas the pre-conflict trend differential works against male schooling, but in favor of female schooling. The pre-conflict differences are therefore unlikely to be driving my findings on the effect of abductions.
Figures 7 and 8 go about here
Figure 7 shows that the occurrence of early marriage has decreased over time. Before the conflict, fewer women tended to be married by age 15 in the high conflict intensity district group compared to low intensity districts, but early marriage rates seem roughly similar across conflict intensity terciles for cohorts exposed to the conflict during primary schooling age.
A similar pattern emerges from Figure 8 for marriage by 21 years old. Over 80 percent of
women are married by this age over the period. Still, the marriage rate at 21 years old tended to
21
be lower in high conflict-intensity districts before the conflict, and this rate has decreased faster in the low-conflict intensity district group.
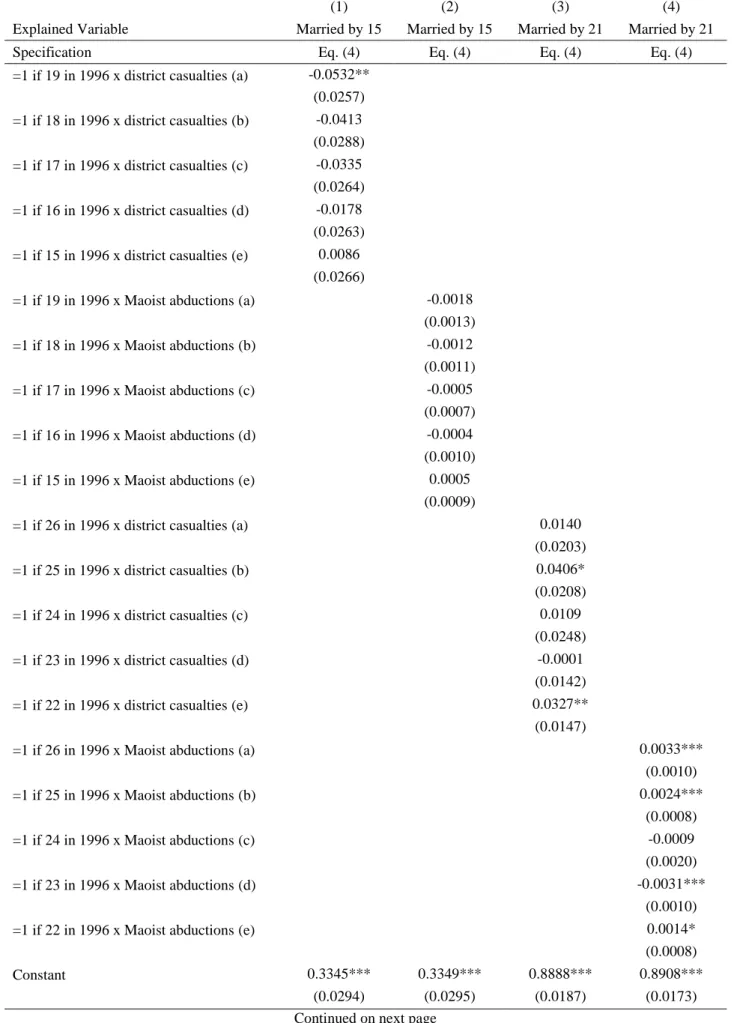
Table A-3 tests for differences in pre-conflict marriage and early marriage trends. Pre- conflict early marriage trends do not differ systematically across districts more or less affected by conflict. However, the rate of marriage by 21 years old tends to increase somewhat faster before the conflict in districts which experienced more conflict-related casualties. This would tend to lead estimates of Equation (1) to bias upwards the effect of conflict intensity on marriage by 21 years old. There is a significant correlation between pre-conflict, year to year variation in the rate of marriage by 21 years old and future Maoist abductions, but the direction of the differential “trend” is unclear.
Having established that pre-conflict trends are unlikely to drive my estimates of the impact of conflict on primary education and early marriage, but that the long-term marriage analysis may suffer from some bias, I now turn to the difference-in-difference estimation results.
5.2. Education
The inspection of Figures 5 and 6 suggested that inequality in primary schooling achievement between districts which experienced different degrees of conflict intensity has tended to decrease with the onset of the insurgency, and especially so for girls. In Tables 4 to 7, I present estimates of the impact of exposure to conflict on educational outcomes to check whether the conclusion of the graphical analysis is confirmed when controlling for unobserved heterogeneity between individual districts and between regions over time, and when using different identification strategies.
Table 4 goes about here
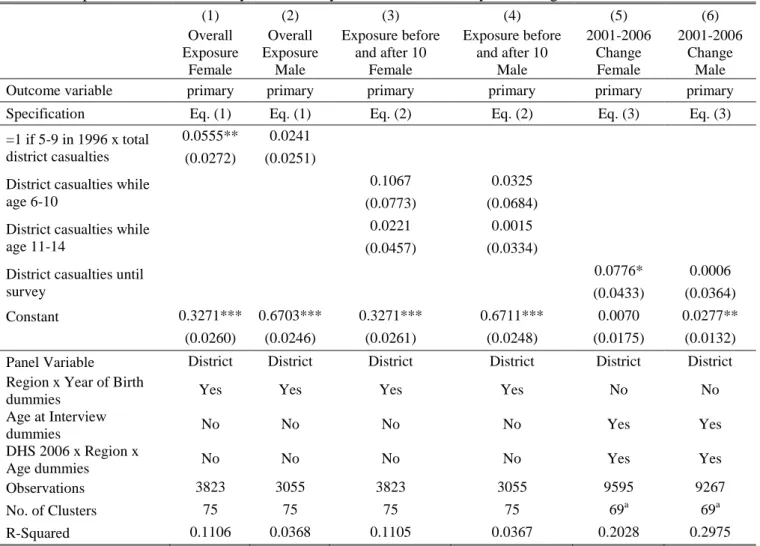
Table 4 reports findings on the impact of conflict exposure on primary education attainment.
The first two columns of Table 4 present estimates of the long-term effect of conflict intensity on
primary schooling completion, using the baseline difference-in-difference specification
(Equation 1). The last two columns of Table 4 test the robustness of these findings by comparing
the change in primary completion rates at any given age between 10 and 18 years old, for
districts with varying degrees of conflict intensification between the 2001 and 2006 DHS
surveys (Equation 3). Columns (3) and (4) explore the long-term impact of conflict intensity
experienced up to- and after 10 years old (Equation 2).
22
The results in the first column indicate that areas with more fighting have seen a larger increase in female primary attainment. Casting this result in terms of the distribution of conflict violence, this implies that an increase in violence by one standard deviation of the district-level distribution of casualties during the conflict (0.98 casualties per 1000 inhabitants) increases female primary schooling attainment by 5.6 percentage points. Put differently, this is roughly the effect of a dramatic move from the 5
thto the 75
thpercentiles of the district-level conflict distribution of total casualties. The sign of this effect is confirmed when comparing cohorts born only five years apart observed at the same age (between 10 and 18 years old) in 2001 and 2006 (Column 5), although this effect is somewhat larger but less precisely estimated and so only marginally significant. When investigating separately exposure to conflict at ages 6-10, the
“normal” primary schooling age when over 80% of children are enrolled in primary school (author’s calculations based on DHS 2006 data) and at 11-14, when the share enrolled decreases sharply from 70.5% to 16.1%, neither conflict exposure coefficient is statistically significant, nor are these coefficients statistically significantly different from each other.
Across all specifications in Table 4, conflict exposure does not appear to affect male primary schooling completion.
The estimates reviewed so far suggest that any positive factor contributing to an increase in female educational attainment is broadly common to all girls aged 6-14, which rules out an explanation due to a reduction in the incidence of early marriage and indicates that, although parents may be reluctant to send young female teenagers to school due to the risk of sexual violence, this effect is compensated by other channels favorable to girl schooling, as otherwise one would expect that conflict experienced while 11-14 would tend to decrease educational attainment. The results in Table 4 also suggest that such favorable factors are not shared equally by boys. Although boys are more likely to be recruited by the insurgents, this is unlikely to be affecting children under the age of 11, and so the results from column (4) showing no effect of the conflict at age 6-10 on primary attainment do not give support to the hypothesis that Maoists may have encouraged schooling for all, e.g., due to their “view that schooling is essential to the creation of a new generation of enlightened revolutionaries” (Hart, 2001, p.33), their sometimes mentioned role in enforcing attendance of teachers and other government employees (Hart, 2001; Collins, 2006), or overall encouragement of education among deprived ethnic minorities.
Table 5 goes about here
23
Estimates of Equations (1) and (2) have the advantage of shedding light on the long-term effect of the conflict on primary education. However, by focusing only on individuals who are generally old enough to have finished primary schooling (i.e., are aged 14 or older at the time of the 2006 DHS), we introduce the risk that estimates may be biased due to migration. An alternative strategy is to compare the educational attainment of children too young to have migrated away from the district for work or marriage, between 2001 and 2006 using Equation (3). By focusing on children under 14 years old, these estimates may not capture the long-term effect of conflict, but they are unlikely to be much affected by migration patterns. In addition, since we also observe household characteristics at the time of survey, it is possible to gain precision by including time-invariant household covariates.
5Table 6 goes about here
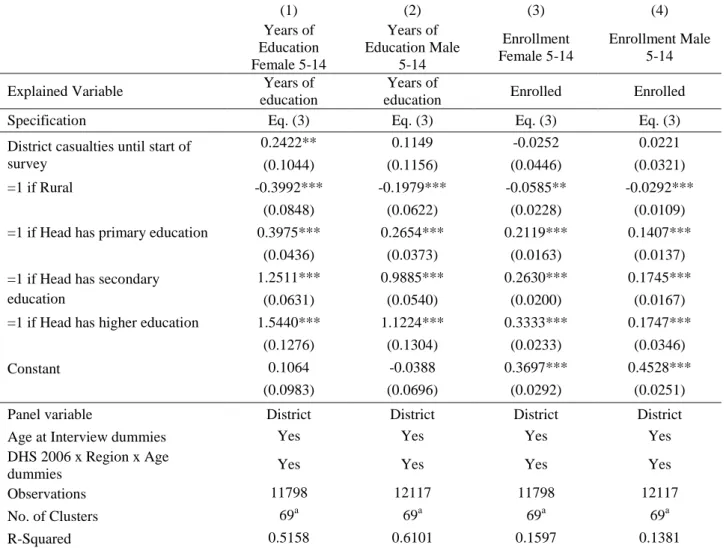
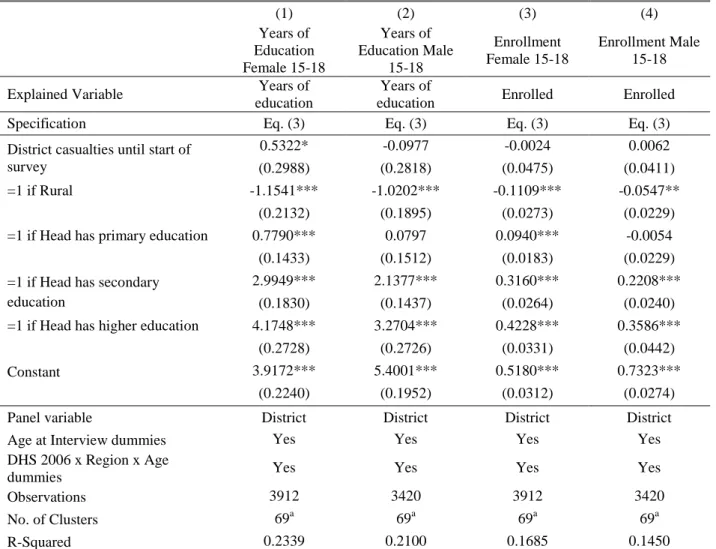
Findings for children aged between 5 and 14 years old at the time of the survey are presented in Table 6. Column (1) of Table 6 indicates that an increase in violence by one standard deviation increases completed years of education by about one quarter of a year, for girls aged 5 to 14 in 2006 compared to girls from the same district who were the same age when surveyed in 2001 before the conflict escalated. However, there is no discernible effect on enrollment, and no effect on either outcome for boys. The combination of improved accumulation of years of education for females without evidence of increased enrollment suggests that the channel through which girls obtained more education is through an increase in the speed at which they accumulate years of education.
6Results in Table 7 are obtained in the same way as those in Table 6, but for the subgroup of individuals aged 15 to 18 at the time of the survey. This sample is more likely to be selected due to migration patterns, but it is interesting to note that females in heightened conflict areas appear to make educational gains at this more advanced age too.
Table 7 goes about here
In Table 5, I investigate whether specific aspects of the conflict had different effects on primary schooling completion, and test the hypothesis that Maoist rule over a district may have
5 Conclusions are unchanged when these regressors are excluded. Results are available upon request.
6 When estimating Equation (3) on a dummy indicating progression to the next grade, for the sample of children enrolled in school at the time of the survey, I find a statistically significant, positive effect of conflict intensity.
Results are available upon request.