PAKISTAN
EXPORT DIVERSIFICATION AND TRADE POLICY FINAL REPORT
FINAL REPORT
June 26, 2012
97939
Public Disclosure AuthorizedPublic Disclosure AuthorizedPublic Disclosure AuthorizedPublic Disclosure Authorized
ABBREVIATIONS AND ACRONYMS
AEO Authorized Economic Operator ATP Annual Trade Policy
ATTA Afghan Transit Trade Agreement BRIC Brazil, Russia, India and China CAR Central Asian Republics DDRs Duty drawback rates DG Director General
DTRE Duty & Tax Remission on Export EDB Export Development Board EDB Engineering Development Board EFC Export Finance Scheme
EM Extensive margin EP Exportable products EPB Export Promotion Board EPZs Export Processing Zones EU European Union
EXPY Export Sophistication FBR Federal Bureau of Revenue FDI Foreign Direct Investment FTA Free Trade Agreement
FTIP Foreign Trade Institute of Pakistan GCC Gulf Cooperation Council GD Goods Declaration GD Director- General GDP Gross Domestic Product GOP Government of Pakistan GSP General System of Preferences HS Harmonized System
ICP Indian Civil Service IM Intensive margin
IMF International Monetary Fund IPP Independent Power Producers IT Information Technology KDLB Karachi Dock Labor Board
KICT Karachi International Container Terminal LMM Locally Manufactured Machinery LPI Logistics Performance Index
LTF-EOP Long-term Financing for Export Oriented Projects
LTFF Long-Term Finance Facility MAF Million acre feet
MFA Multi-Fiber Agreement MFN Most Favored Nation MOC Ministry of Commerce
NABA National Accountability Bureau
NLC National Logistics Cell
NLTA Non- Lending Technical Lending Assistance
NTC National Tariff Commission
NTCIP National Transport Corridor Improvement Program
NTTFC National Trade and Transport Facilitation Committee
OIC Organization of the Islamic Conference OTRI Overall Trade Restrictiveness Index PaCCS Pakistan Customs Computerized System PIFFA Pakistan International Freight Forwarders
Association
PITAD Pakistan Institute of Trade and Development
PPP Pakistan People’s Party PPP Public-Private Partnership
PSCB Pakistan Public Sector Capacity Building PTA Pakistan Tanners Association
QRs Quantitative restrictions R&D Research and Development RCA Revealed comparative advantage REGS Rapid Export Growth Strategy SAFTA South Asian Free Trade Agreement SBP State Bank of Pakistan
SMART System of Market Analysis and Restrictions of Trade
SME Square Meter Equivalent SROs Statutory Regulation Orders T&C Textiles and Clothing
TDAP Trade Development Authority of Pakistan TFP Total factor productivity
TIR Transports internationaux par la route UAE United Arab Emirates
UK United Kingdom
UNCTAD The United Nations Conference on Trade and Development
US United States
WAPDA Water and Power Development Authority WBI World Bank Institute
WDI World Development Indicators WeBOC Web Based One Customs WITS World Integrated Trade Solutions WTO World Trade Organization
PAKISTAN
EXPORT DIVERSIFICATION AND TRADE POLICY TABLE CONTENTS
Executive Summary ... i
Chapter I: An Economy Shaped By Crises ...1
A. Introduction...1
B. Crisis Number 1: Public Policy and the “Mussalman problem” ...5
C. Crisis Number 2: Relations between India and the New State of Pakistan ...9
D. Crisis Number 3: The Ideological Shift in Public Policy...12
E. Crisis Number 4: The Evolving Pattern of Governance ...13
Chapter II: Competitiveness and Trade Outcomes ...19
A. Introduction...19
B. Growth, Diversification and Sophistication...21
C. Firm Dynamics in Exporting: Entry, Exit and Survival ...35
Chapter III: Trade Policy for Export Diversification ...51
A. Introduction...51
B. Trade, Tariff, Tax Policy in Pakistan: Evolution and the Current Regime ...51
C. Current Tariff and Trade Policy Regime: A Descriptive Analysis ...54
D. The Nature of Distortions from Tariff Policy ...57
E. Analysis of Anti-export Bias of the Tax and Tariff Regime...61
F. The Presence of Anti-Export Bias from Exchange Rate Management ...64
G. Other Measures Affecting Trade ...65
H. Export Subsidies: An Assessment of Incentive Bias ...68
I. Compensatory Support to PTA Users...69
J. Institutional Framework for Trade Policy-Making: Lack of Coherence ...72
Chapter IV: Domestic Factors Affecting Exports...76
A. The Overarching Challenges: Shocks, Stability and Scarcity...76
B. Economic Governance, Labor Policy and Access to Finance ...79
C. Providing Basic Infrastructure for Commerce ...82
D. Strengthening Economic Governance through Better Regulation ...84
E. Achieving Flexible Labor Markets and Enhancing Skills ...86
F. Expanding Corporate Access to Finance ...87
G. Absorbing Technology and Fostering Corporate Innovation ...88
H. Trade Facilitation and Logistics for Exports ...89
Chapter V. Market Access and Preferential Trade Agreements ...111
A. Trade Preferences and Pakistan’s Trade ...112
B. Welfare Effects of Tariff Liberalization in Pakistan...113
C. Fiscal impact and welfare gains ...115
D. Effects of Full Tariff Liberalization on the Intensive Margin of Imports ...116
E. Fiscal Impact and Welfare Gains ...117
F. Beyond Tariffs and Market Access...118
G. Trade Creation and Diversion Effects of Pakistan’s PTAs ...121
H. PTAs Impact on Export Growth ...123
Chapter VI. Trade Policy Research and Analysis ...126
A. Introduction...126
B. Institutional Context of Trade Policy Analysis...127
C. A Transformative Paradigm—From FTIP to TDAP ...127
D. PITAD Structure and Management ...128
E. Research Activities ...129
F. The New Strategy for Research ...130
G. Activities under the NLTA ...131
H. Coalescing the Trade Community, Building partnerships, and Outreach...133
I. Results and Outcomes: PITAD Progress and Trade Policymaking in Pakistan ...135
J. The Case for Accelerated World Bank Collaboration with PITAD...137
K. The Way Forward ...138
Boxes
Box 1. Sophistication of exports in Pakistan ... 32
Box 2. Contribution of Intensive and Extensive Margins to Export Growth ... 47
Box 3. Exception to MFN Regime: Three Key 2006 SROs ... 56
Box 4. Insights from Firm Level Data: The Economic Determination of Tariffs ... 59
Box 5. Estimated OTRI for the World, 2010 ... 60
Box 6. Experience in Trade Reform ... 75
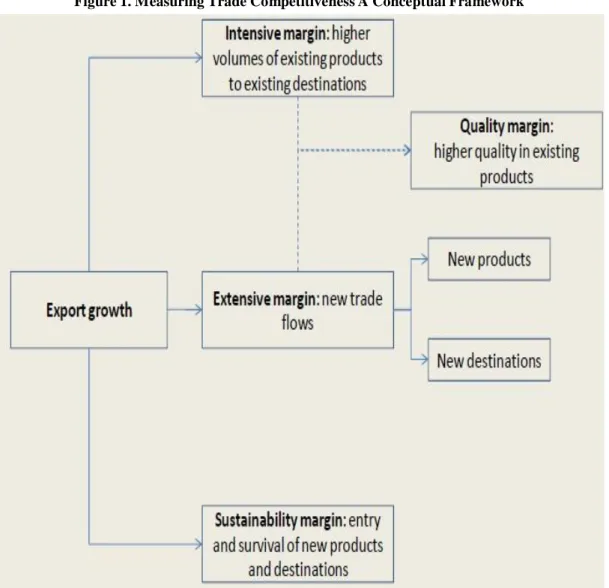
Figures Figure 1. Measuring Trade Competitiveness A Conceptual Framework ... 20
Figure 2. Index of Export Growth, 1980 - 2011 ... 21
Figure 3. Trade Orientation 1990s versus 2000s ... 22
Figure 4. Herfindhal Index, 2000-2008 ... 24
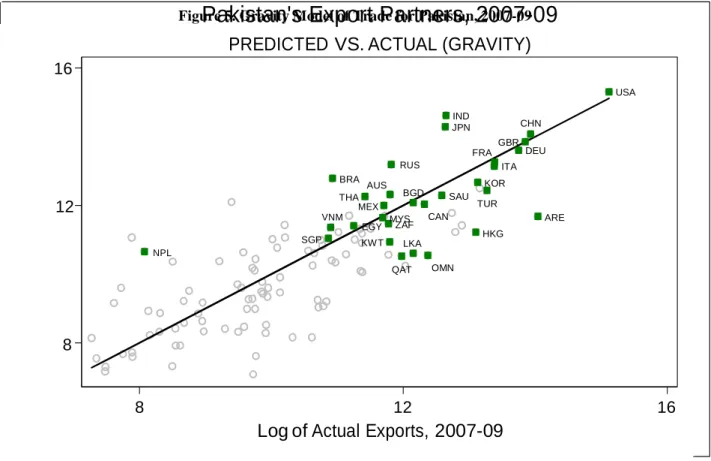
Figure 5. Gravity Model of Trade for Pakistan, 2007-09 ... 25
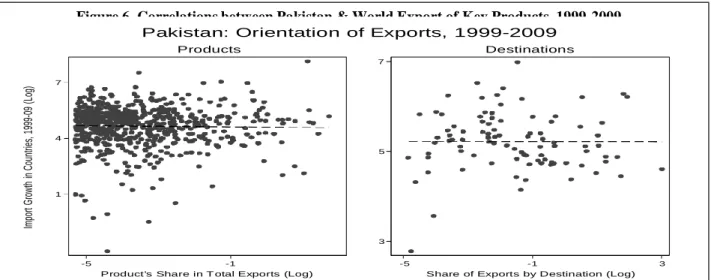
Figure 6. Correlations between Pakistan & World Export of Key Products, 1999-2009 . 26 Figure 7. Intensive and Extensive Margin in Proudcts and Markets, 1998-2008 ... 27
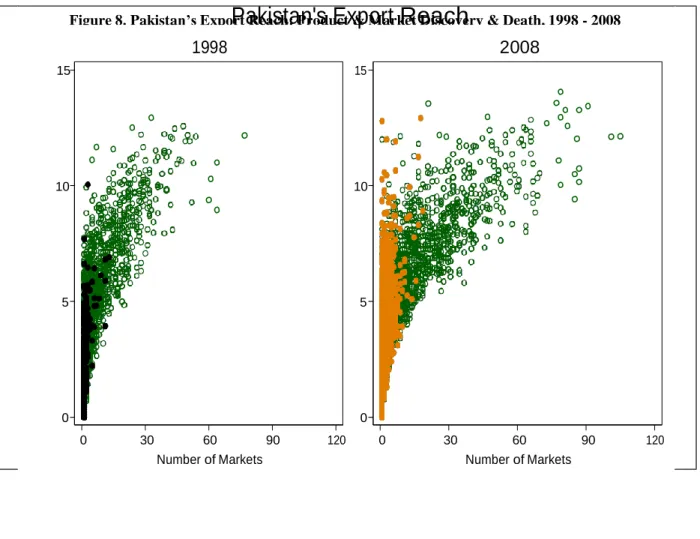
Figure 8. Pakistan’s Export Reach: Product & Market Discovery & Death, 1998-2008 . 27 Figure 9. Export of Services, 2000-2009 ... 28
Figure 10. Service Exports in Pakistan by Type, 1997-2009 ... 28
Figure 11. Technological content of exports, 1982 - 2008 ... 29
Figure 12. Relative Unit Values for Pakistan Exports, 2000-2010... 31
Figure 13. Export Sophistication Change, 1988-2006... 31
Figure 14. Pakistan revealed factor intensity (RFI) of exports ... 33
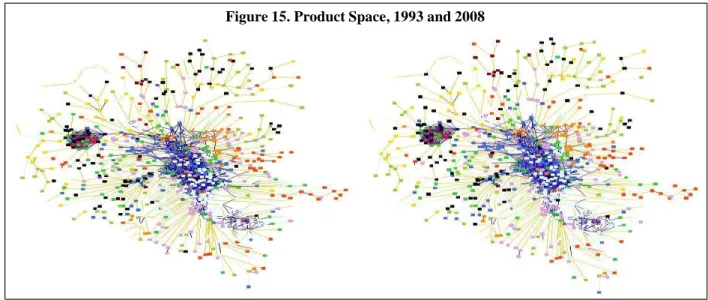
Figure 15. Product Space, 1993 and 2008 ... 34
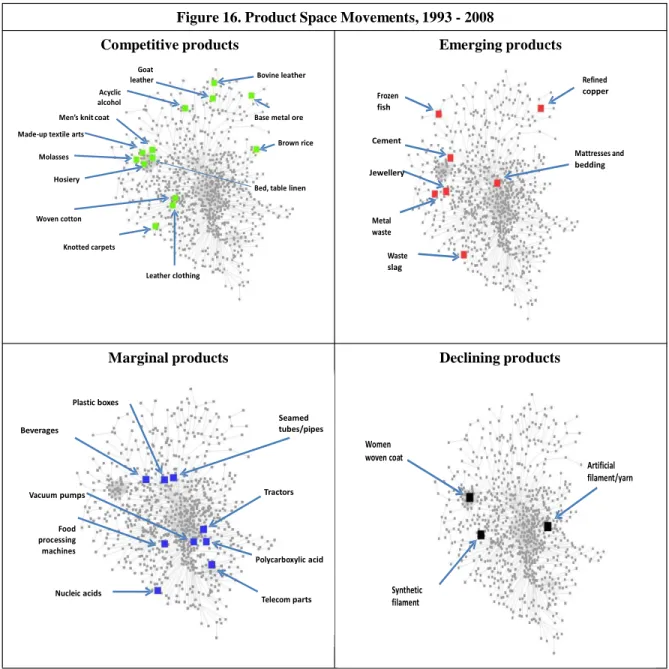
Figure 16. Product Space Movements, 1993 - 2008 ... 35
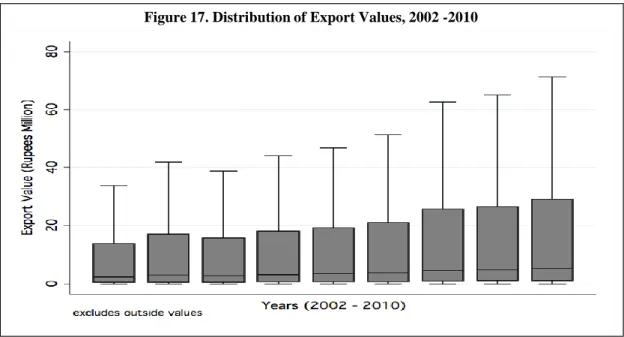
Figure 17. Distribution of Export Values, 2002 -2010 ... 36
Figure 18. Herfindahl index and Top Exporters Share, 2004-2009... 37
Figure 19. Average and Median Export Value per Firm, 2004-2009 ... 38
Figure 21. Product vs. geographical portfolios, 2004 - 2009... 40
Figure 22. Entry and exit rates in Pakistan and Peer Countries, 2004-2009 ... 41
Figure 23. Destination popularity and Export Values, 2002 ... 42
Figure 24. Products and Exporters, 2002... 42
Figure 25. Entry and Exit, by Firm Size, 2002-2003... 42
Figure 26. Entry and Exit, by Destination Popularity, 2002-2003 ... 43
Figure 27. Entry and Exit, by Product Popularity, (2002-2003 ... 43
Figure 28. Distribution of Export Values by Years of Experience, 2010 ... 45
Figure 29. Survival rates after 1 year of export activity, 2004-2008 ... 45
Figure 30. The Margins of Export, Annual Export Growth, 2002-2010 ... 46
Figure 31. Pakistan’s MFN Unweighted Average, 1982-2009... 53
Figure 32. Distribution of Tariff Rates, by Frequency,2009-2010 ... 55
Figure 33. Effective Tariff, including Regulatory Duties, 2009-2010 ... 55
Figure 34. Decomposition of Tariff Variation ... 58
Figure 35. Tariffs by Export Intensity, 2005 -2010 ... 58
Figure 36. Position of Pakistan's OTRI with respect to other countries, 2010 ... 60
Figure 37. ERP and Value Added ... 62
Figure 38. RP and Export Performance ... 62
Figure 39. Normal and Real Effective Exchange Rates, 1999-2009 ... 64
Figure 40. Anti-Export Bias in Exchange Rate, 2006 - 2010 ... 64
Figure 41. Comparative Price Levels for Selected Products ... 71
Figure 42. Trade Policy Formulation in Pakistan ... 73
Figure 43. Logistics Performance, 2010 ... 90
Figure 44. Pakistan’s Comparative ... 90
Figure 45. Logistics Performance Index, 2010 ... 90
Figure 46. Container Throughput, 2000-2010 ... 92
Figure 47 . Air Cargo Volumes, 2000-2009 ... 94
Figure 48. Pakistan Passenger/Cargo Network Structure, 2011 ... 94
Figure 50. Pakistan Railways, 1955 -2010 ... 97
Figure 51. Cargo Volume through Dry Ports, 1993 -2010 ... 99
Figure 52. Evolution of Logistics Systems ... 100
Figure 54. Pakistan’s Preferential Exports... 113
Figure 55. Change in Pakistan’s total imports, 2009 -2010... 114
Figure 56. Trade diversion under different scenarios ... 115
Figure 57. Revenue Loss and Welfare Gains From Tariff Change ... 116
Figure 58. Import change, percent 2009 total imports ... 116
Figure 59. Tariff revenue losses (US$ million) ... 117
Figure 60. Welfare gains (US$ million) ... 117
Figure 61. Pakistan’s predicted vs. actual exports ... 122
Figure 62. India’s predicted vs. actual exports ... 123
Figure 63. Determinants of export growth and diversification ... 125
Tables
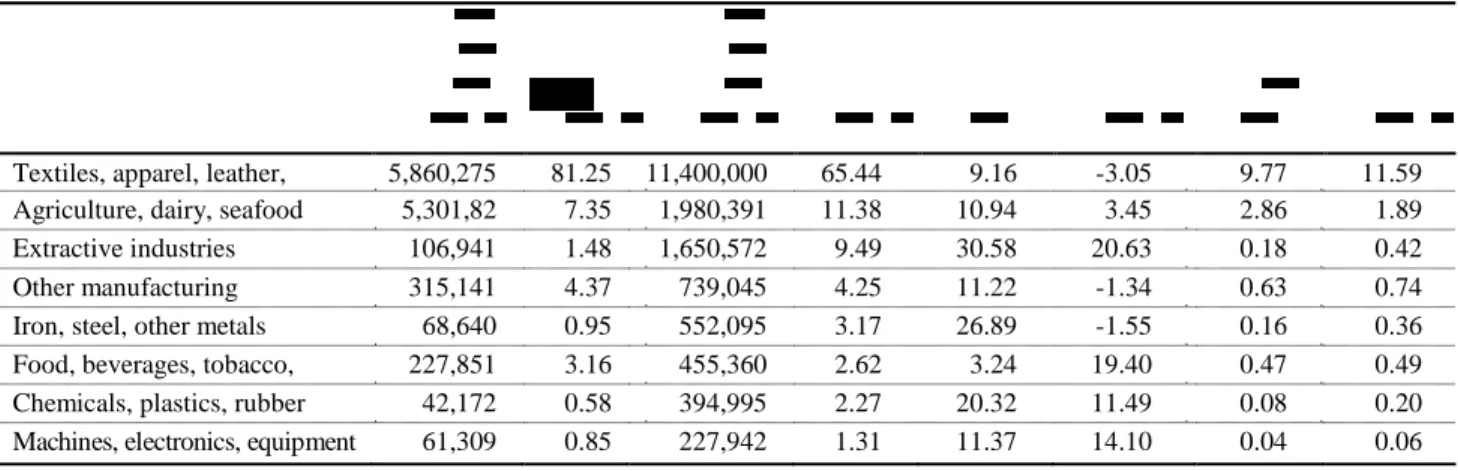
Table 1. Composition and Growth of Exports by Sector, 1997-99 and 2007-09 ... 22
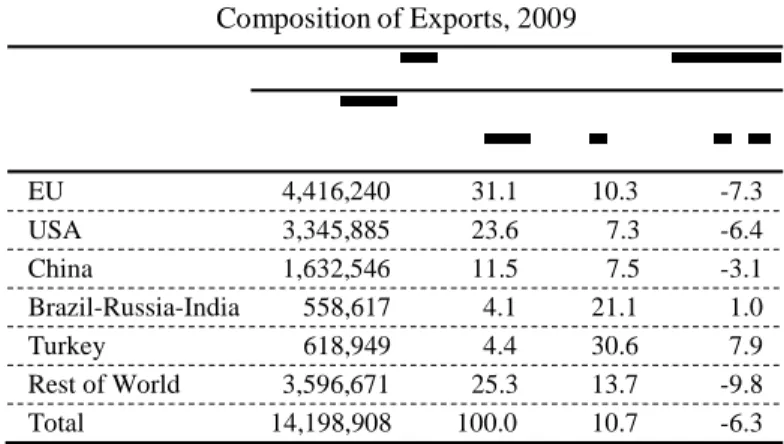
Table 2. Selected Economies Market Composition of Exports, 2009 ... 23
Table 3. Service Exports Share of Commercial Service Exports (%) ... 28
Table 4. FDI Inflows, 2005-2009 ... 29
Table 5. Unit Values for Products, 2000- 2010 ... 30
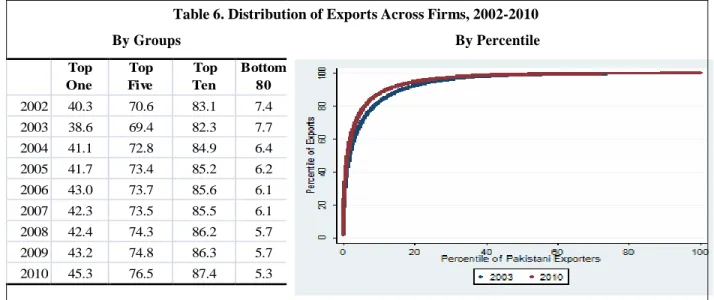
Table 6. Distribution of Exports across Firms, 2002-2010... 37
Table 7. Destinations, Sector and Products, 2002 - 2010 ... 38
Table 8. Export Behavior: Countries & Products, (2002) ... 40
Table 9. Export Entry and Exit, 2003-2010 ... 41
Table 10. Survival Rates by Cohort, 2003 -2010... 44
Table 11. The Margins of Export, Annual Export Growth, 2002-2010 ... 46
Table 12 Trade Outcomes Assessment Summary of key findings ... 50
Table 13. Evolution of Tariff Protection, 1997-2010 ... 52
Table 14. Simple Average Tariffs, Cross Country Ranking, 2008 ... 54
Table 15. Tariff Schedule by Stage of Processing, 2010 ... 54
Table 16. The Statutory & Effective Duty Regime (Customs Transactions, 2009/2010) 56 Table 17.. Average and Dispersions of Statutory and Applied Rates by Sector, 2010 .... 57
Table 18. Structure of Pakistan's Protection, 2010 ... 61
Table 19. An illustrative sample of firm level ERPs, 2010 ... 63
Table 20. Applied Sales and Federal excise tax on Imports, 2009/10 ... 67
Table 21. Key Components of the National Trade Corridor in Pakistan ... 92
Table 22. Comparative Cargo Volumes... 93
Table 23. Transshipment Hubs for Pakistan Ports ... 93
Table 24. Dry Ports in Pakistan ... 98
Table 25. Distribution of Forwarding Agents in Pakistan, 2011 ... 103
Table 26. Market Share of Forwarding Agents, by Size... 103
Table 27. Major International Trade Facilitation Instruments ... 110
Table 28. List of Pakistan’s multilateral and preferential trade agreements ... 111
Table 29. Partners In Pakistan’s Trade, 003 - 2010 ... 112
Table 30. Preferential Trade Regime for Exports to Top 20 Markets ... 113
Table 31. Bilateral imports from main partners as a result of PTAs, 2009-2010 ... 114
Table 32. Changes in Revenue and Welfare from PTA... 115
Table 33. Changes in bilateral imports from main partners as a result of PTAs ... 117
Table 34. Changes in tariff revenue and welfare as a result of proposed FTAs ... 118
Table 35. Policy Areas Covered by PTAs ... 118
Table 36. Provisions in Pakistan’s PTAs with SAFTA partners and China ... 119
Table 37. Pakistan Bilateral Investment Agreements ... 120
PAKISTAN EXPORT DIVERSIFICATION AND TRADE POLICY EXECUTIVE SUMMARY
Introduction
1. Pakistan’s trade indicators reflect low outward orientation, concentration on low value added activities and an undiversified product mix which out of line with the fastest growing areas of world demand. The export share of Gross Domestic Product (GDP) has remained low and falling—from 13 to 11 percent in 2010, while 45 products account for around 83 percent of exports, with 10—
mostly from the textiles and garment sector—representing more than half. As a result, textiles and garments share of exports has been consistently exceeded 60 percent while food and leather accounted for an additional 17 percent and engineering, barely 2 percent. On the other hand, the engineering share of world trade has grown to 60 percent from rising export powers in East Asia and Latin America, while the world’s textile shares have remained at stagnant 6 percent, but even here, strengthening competitors is South Asia, new competitors in South East Asia are competing for a stagnant 6 percent of world trade, making competition even more fierce in the commodities in which Pakistan’s traditionally specializes.
2. There have been many good signs in Pakistan’s trade performance in recent years which provides a strong basis to build upon, as the policy mix considers the role of trade in Pakistan’s growth agenda. While, there have been periods of low growth, usually in response to recession in developed countries, when the world grows and Pakistan’s policies are conducive to trade orientation, a strong supply response is witnessed. Greater diversification occurred during the 2000s with the share of exports going to textiles falling from 68 percent in 2003-04 to 55 percent in 2007- 08 to 52 percent in 2010-2011. The rising share of note during this period was food (from 10 to 14 percent) and other manufactures (from 16 to 20 percent), but there was considerable attempts at export diversification – both new products and new markets—at low levels, often unsustainable levels of activity.
3. Pakistan currently faces a difficult challenge of stabilizing, reforming and growing, all under difficult conditions of commodity price volatility, tight finance and dampened world demand. The persistent deterioration in the global economy has certainly created difficult external conditions for developing countries to transform, strengthen and diversify their own economies through export led strategies. For countries like Pakistan which export to the markets experiencing the largest contraction, renewed demand for their exports will require additional time to enable excess labor and unbalanced fiscal positions to be accommodated, possibly forestalling high demand conditions for some years to come.
4. Still, both in spite of, as well as because of the most difficult world and home market conditions in recent memory, Pakistan faces little choice but to reduce exporting biases and position
its business sector to look outward for prosperity, once markets revive. The ability to expand, diversify and upgrade production requires imported capital goods and intermediates as part of the global supply chain process. Increased exports are needed to offset the shrinking invisible account surplus as well, thereby providing scare balance of payments financing. Most importantly however, export growth remains an outcome of productive, innovative and sophisticated firms. As such, attention to success in exporting—along with its many behind-the-border, at-the-border and other- side-of-border success factors—has been, and continues to be, a central theme and policy goal in economic management in recent months and for years to come.
Pakistan’s Starting Conditions
5. Crises have indeed also been important features of Pakistan’s history. Several of these have had profound consequences for the shape of the economy, the structure of its political system, and the way the country’s citizens look at the world outside. In dealing with them, the policymakers of the day adopted approaches that left their mark on the development of the country. Crises were caused by different sets of circumstances, and have numbered into the double digits, depending on how one characterizes crises. Four crises are highlighted due to their very strong impact on the economic structure today.
Dividing Society: Before Pakistan emerged as an independent Muslim state, colonial rulers in British India became concerned that the economic system was putting the Muslims under considerable economic pressures, particularly in Muslim dominated areas. While the laws that were put on the books to protect the Muslim peasantry achieved the objective, there were unintended consequences of exacerbating the Muslim-non-Muslim divide and contributed to the mass movement of people in the months around the time of the carving out of a new Muslim state. Resettling refugees and social divide has become an enduring challenge for realizing the benefits of economic integration—nationally, regionally and internationally.
A Difficult Neighborhood: In the years immediately following the partition of India and the creation of Pakistan, the creation of a predominantly Muslim Pakistan and a predominately non-Muslim India led to potential conflict that surfaced the moment Pakistan was born. There was the perception among the first generations of Pakistani leaders that first administration in India was attempting to undo partition and fold back the newly created Muslim state into India. This perception was to become the basis of public policymaking in Pakistan for decades and led to a series of crises related to the emerging conflict with India—deeply affect the structure, direction and performance Pakistan’s economy ever since.
State Dominance of the Economy: The ideological underpinnings of the administration in power was more important as the source of crises in India than was the case for Pakistan as for almost four decades, the Indian state was put on the commanding heights of the economy.
However, in Pakistan two administrations devised and implemented economic policies based on ideology: socialism in the case of Prime Minister Zulfikar Ali Bhutto (1971-77) and Islam in the case of President Ziaul Haq (1977-88). While the changes were less substantive in the latter case, in the former case, the policies adopted had lasting adverse consequences.
Impact of Poor Governance: Two periods in Pakistan’s history are relevant: the first in the decade following the birth of the country when there was enormous jockeying for power, no institutions to intermediate between contending political forces and the resulting political chaos and economic confusion. Pakistan was placed under military rule and a new economic model due to the differences among the newly empowered political forces.1 Neither he nor his program survived and he was forced to resign. Poor governance of a similar type reappeared in 2008-12, causing an already bad economy to turn to crisis.
6. Despite and because of these crises, Pakistan’s position in world trade has changed little over the past three decades. As Pakistan’s market share in the world has been declining during the last several years, those of Malaysia, Mexico and Thailand have doubled, and China’s has tripled.
Pakistan’s average trade-to-GDP ratio in the late 2000s was roughly the same as a decade earlier and has been declining in recent years. Along with this declining export share, two markets - the United States (US) and the European Union (EU) - absorb two thirds of Pakistan’s total exports while the export bundle’s reliance on a few commodities making it highly susceptible to global market volatility of type which has become commonplace.
7. Meanwhile, aided by large reductions in trade barriers and technological advancements, export oriented countries led by China and India and other emerging markets have become major drivers of global trade in goods and services, respectively. Moreover, world trade has undergone a dramatic transformation toward the global fragmentation of production, resulting in greater trade flows, particularly within supply chains, and an increased the variety in the types of traded goods and services—a trend that has largely eluded Pakistan.2
8. This evolving trade landscape is likely to exact more pressure on firms in other developing economies to improve productivity through better industrial organization, in order to enhance its
“trade competitiveness” and benefit from the growing opportunities for new entrants on the international market. However, growth and competitiveness requires more than abstract formulation carried out in isolation. Increasingly, competitive countries are taking aggressive steps to enhance domestic competitiveness in order to measures up to competitors who are doing the same.
9. Pakistan’s current and potential competitors, even those with similar endowments of skill and technological capacities at present have become relatively more open and more integrated in world trade, and as a result recorded large gains in the amount or exporting firms were successfully recording. Successful performers are not restricted to China and East Asia’s “new Tigers” like Indonesia, Malaysia, Thailand, the Philippines and Vietnam but also include Turkey, Costa Rica, Chile, and Mauritius.
10. In most countries a significant reduction in anti-export bias was achieved as result of maintaining relatively low tariffs and a competitive exchange rate, supplemented by effective regulatory regimes. The result has been to reduce forced idleness of resources, eliminating or
1 Muhammad Ayub Khan, Friends not Masters: A Political Autobiography, London, Oxford University Press, 1967.
2 World Bank, 2010.
reducing allocative and ‘X-inefficiency enabling gains in total factor productivity (TFP) which are key in enhancing trade competitiveness. 3
11. The need for trade for reform, and the scope and pace of reform, need to be considered from both a wider competitiveness dimension than just a physical distance to competitors and peers. The investment climate, trade policy, infrastructure and knowledge as well as the incentive structure and the institutions to facilitate are important elements of a trade and competitiveness strategy. Export diversification will follow a flexible, dynamic and open set of factor and product markets – with product markets by all means encompassing both the domestic market and international markets – particularly since Pakistan’s competitors, are paying the price to remain at its door to exert pressure on its firms, and are more competitive in Pakistan’s export markets. The complexity of the new trade landscape calls for a more integrated approach to achieving Pakistan’s declared goals for trade and industrial development in order to create an incentive environment conducing to trade competitiveness and export diversification.
A Conceptual Framework for Trade Competitiveness
12. Studies on competitiveness have made it clear that the determinants of competitiveness are many and complex. There is now little doubt that, in the long run, economies more open to trade show stronger economic growth and overall development performance, including export growth. 4 The arguments for investment in physical capital and infrastructure, coupled with appropriate macro, micro and governance fundamentals so that resources naturally flow into the right sectors, and within those sectors, to the right firms. Further human and social capital, soft infrastructure, support for technology related innovation, business friendly environments, sound markets, property rights regimes, were all complementary areas for the public sector contribute, in order to maintain the productivity and operational efficiency achieved from inter-firm and inter-industry linkages.
13. A good practice export competitiveness initiative underscores several of the above issues and draws on the myriad of policy tools and approaches employed around the world on trade, macroeconomic policy, customs and logistics, and direct enterprise support. It emphasizes the importance of global integration in achieving competitiveness – be it through new technologies, market-integrating economic policies. The policy agenda that typically emerges from a competitiveness analysis relates to three or four core areas with Education and health often considered a fourth distinct core area.
Macro fundamentals (e.g., removal of economic biases having to do with tariff and non-tariff barriers, real exchange rate misalignment, distortive tax regime, overall fiscal health of the
3 Amiti and Kronin, 2007, Jayanthakumaran 2004.In particular, see Jayanthakumaran (2004) for a survey of literature discussing trade liberalization and trade growth linking to TFP growth.
4 Dollar, D. and A. Kraay (2004). “Trade, Growth, and Poverty”, Economic Journal (2004); Dollar, D. and A. Kraay (2002). “Growth is Good for the Poor”, Journal of Economic Growth; Michaely, M., D. Papageorgiou, and A.
Choksi (1991). Liberalizing Foreign Trade: Lessons of Experience in the Developing World (Oxford: Basil Blackwell); Winters, L. Alan, N. McCulloch, and A. McKay (2004). “Trade Liberalization and Poverty: The Evidence So Far”, Journal of Economic Literature, Vol, XLII (March).
economy, product and factor market conditions, property right protection, effective regulation, case of firm entry and exit).
Services and costs (e.g., infrastructure, customs and trade logistics, the costs of doing business including compliance cost of regulation).
Proactive measures that try to correct market failures and develop public goods (e.g., technology creation and adaptation, product standards and certifications, export promotion, environmental and social standards, social safety nets).
Education and health (e.g., primary and higher education, vocational and on-the-job training, basic health care).
Pro Forma Analytical Framework for Trade Competitiveness
Public Sector Private Sector Civil Society &
Academia
Policy Fundementals
- Macroeconomic Stability - Product & Factor Markets - Property Right Protection - Effective Regulation - Ease of Entry& Exit
Services &
Costs
- Infrastructure - Trade Logistics - Compliance Cost of
Regulation
Market Failure &
Public Goods
- Environmental & Social Standards
- Technology Creation &
Adaptation - Social Safety Nets
Education &
Health
- Primary & Higher Education - Vocational & OTJ
Training - Basic Health Care
Economy Wide Sector Specific Firm Level
14. The focus of the report is to reinforcing the arguments embodied in this analytical framework for trade competitiveness, focusing on the principal areas facing Pakistan’s policy makers, first by analyzing Pakistan’s historical underpinning of its initial conditions, trade outcomes, and policy issues and analytical needs related to improving trade competitiveness.
Competitiveness through Trade Outcomes
15. Export Competitiveness is defined as the ability of the economy to adjust to changes and continue selling its products. From a country’s perspective this would involve expansion at the extensive and intensive margins, but the two mean the same in terms of export receipts. However, in terms of specifics, where are the jobs, the foreign exchange inflow, the income, etc.
16. The analysis of trade outcomes show mixed results, from both the short and longer term perspective. At the heart of the long term issue is that Pakistan’s trade orientation is very low and its traded products are at the unsophisticated end of the technology spectrum. Both facts have been dominant characteristics of Pakistan’s trade outcomes for some time. In terms of more immediate challenges of growth what Pakistan exports, there have been large growth spurts in the past, but these have tempered dramatically in recent years, and the over all trend is a declining one.
17. On the positive side, the level of diversification is higher than implied by the top sectors or product s share of exports, indicating, low level product exports. There are also positive signs at the firm level which indicting entry and exit dynamics that are promising in terms of future competitiveness, once these firms achieve success and are able to scale up. There is significant churning at the country margin and some healthy creative destruction at the firm margin. The product/sector margin has been less dynamic.
18. Three outcomes speak the how well the economy is showing the appropriate dynamics, resource allocation and creative destruction needed to maintain competitiveness.
The first dimension is about static outcomes, reflecting the initial conditions described in Chapter Three outcomes are examined: (i) Trade orientation and export growth, (ii) product and market diversification and (iii) process upgrading
The second dimensions is about breaking down changes in trade flows into separate and analyzable components, including extensive margins(how well is performance in new products and markets) and intensive margins(how well is performance in existing products and markets).
The third dimensions is to examine what is happening at the firm level, in terms of firm entry and exit, introduction of new products/ sector, and penetration into new markets, to understand how the dynamics seen at the product level is being reflected in firm level performance.
19. Recent trade patterns in Pakistan are viewed from two perspectives: trade flows by products (irrespective of the firms which originate them), and export activity by firms (according to the products they produce). The perspective is to examine, to the extent possible, dynamic forces at work behind the trade flows to so how, the country’s systems for allocating resources is leading to positive trade outcomes.
20. Trade orientation in goods is low and decreasing, goods are low tech, and trading partners are dominated by a few developed economies. Specifically,
The trade orientation here is described in terms of outward looking of the economy – trade to GDP, which as 32 percent is half of what it should be. Other countries have reached that China and India but Pakistan has stayed constant and even fell a decade ago.
From a sector point of view, Pakistan’s exports are dominated by labor-intensive light manufacturing -- like textiles, clothing, footwear, leather and agri-foods. This group’s share in exports in 2007-09 was 65 percent. The second most important export sector was the agrifood sector with slightly more than 11 percent of total exports.
The technological content of exports in Pakistan is low. High-tech exports constituted less than 2 percent in 2008, a share broadly unchanged in the past 25 years.5
The low level of export sophistication in Pakistan. Pakistan’s increase in export sophistication is modest. In 1986, the sophistication of its export basket was higher than that of Vietnam. In past 20 years, Pakistan export basket has not undergone an improvement as its Asian peers.
The US and European markets6 absorb 31 percent and 23 percent of Pakistan’s total exports, respectively with China represents the third most important destination, with a 11.5 percent.
Gulf (UAE, Afghanistan, Oman) destinations are important re-export destinations.
21. Trade in Services has been a potential bright spot as a nice set of products spurred by considerable technology transfer from foreign direct investment in telecoms and banking. Both types of FDI have since ebbed due to security considerations, but the service exports from the past FDI is currently showing some pay off. Specifically,
Trade in services, although only partially seen in official statistics, has acquired momentum, possibly because it can override tangible, physical constraints faced by the goods sector.
Increasingly, services trade became an important source of export diversification in Pakistan but less so that its peer countries: Bangladesh, China, Egypt, India, Malaysia, and Turkey.
Outside Bangladesh, Pakistan has the lowest share of services in GDP among its peers.
Between 2000 and 2007, exports of commercial services grew at a compound annual rate of nearly 15 percent, which is just below the average rate of peer countries.
5For example, Vietnam’s share of high-tech exports went from 0.7 percent to 3.8 percent of total in the same period whereas India’s increased from 2.8 percent to 6.2 percent. Moreover, while the majority of the country’s exports (around 54 percent) was classified as low-tech already in 1985, this share further increased over time, to reach close to 80 percent in 2006.]
6The principal countries are United Kingdom (7.1%), Germany (6.5%), France (4.4%) and Italy (4.1%).
Transport and information communication technologies services] are, respectively, the most important types of services exported have been becoming more sophisticated since 2003.
Potential for financial services, professional services, etc.
Until the financial crisis, 2008-09, Pakistan had had a steady rising inflow of FDI, as a percentage of gross fixed capital formation. Inflows were relatively sizeable compared to other FDI has mainly come into the largely non-tradable sectors of banking and telecom.
22. Export Growth has been a mixed picture but below potential given the low trade to GDP ratio. Specifically,
Pakistan exports have grown slightly above world’s exports growth but much below that of exports of South Asian peers. In 30 years, Pakistan’s exports grew 10 fold as compared to the 25 fold increase for the rest of South Asia.
In terms of export volumes (Intensive Margin-IM), performance has been irregular. Some years of very good performance have combined with a few years of low export growth, possibly reflecting developments in the macro-economic environment and in foreign demand
Export growth spurts occurred like other sectors in Pakistan’s experience growth spurts at the end of the 1980s coinciding with crises induced reforms in the early part of the 2000s.
Recent suppressed demand has affected all sectors but food and agriculture has maintained a positive terms of trade impact.
Growth has been highest in the extractive industries, metals, and chemicals machinery, and through the down turn, electronics and transportation equipment were buoyant as were extractive industries and food, beverages.
23. Diversification of exports across markets and products reduces the vulnerability of the country’s export portfolio to partner-specific shocks and to extreme volatility in export prices. The recent global crisis has highlighted the critical importance of diversification in reducing the risks of volatility in global demand and explains why this topic is rising in the agenda of low-and middle- income countries.
Geographically, the US and European market shares for Pakistan’s exports fell by 9 percentage points (from 61 percent in 2000 to 54 percent in 2009) while there is a small increase in exports to the emerging bloc of Brazil, Russia, India and China (BRIC) as did Gulf countries. Gravity Model says Pakistan is under-exporting with the large and fast growing economies of the 21st century including Japan, Brazil, Russia, and of course India.
In terms of products Pakistan is mildly diversified, more concentrated than China and Turkey, but less concentrated than other middle-low income countries. More worrisome, however, is that in almost a decade, the period 2000-2008, there was an increase in product concentration in many countries, including China, Malaysia, Bangladesh and Turkey, whereas Pakistan’s index not only did not decrease but slightly increased.
24. Overall, Pakistan is broadly moving toward new products and markets; but the pace in terms of new products is slower than those of potential competitors.
In terms of products, Pakistan’s share of exports in products that the rest of the world also exports has declined slightly over the last ten years, but it appears to be moving towards new exports that are economically significant.
In terms of market destinations, Pakistan’s export share in countries it currently exports to has reduced slightly, but it has increased its reach to markets that cumulatively are larger relative to the world in 2008 than in 1998.
25. As in most other countries worldwide, Pakistan’s exports are concentrated in the hands of a few large exporters. The bottom 80 percent of exporters accounted for only 5.3 percent of total export value in 2010, down from 7.7 percent in 2003. Specifically,
Export entry and exit rates are lower than in peer countries but new entrants more than offset the loss in exports by exiting firms. Each year, anywhere between 16 and 37 percent of firms exit and another 19 to 37 percent enter. While at first sight there seems to be significant destruction and creation of exporters in the data, entry and exit rates are lower than in other middle-low income countries). Moreover, the net effect on the number of exporters seems to be marginal. This suggests that the number of exporters is not expanding any significantly over time. Yet, new exporters seem more effective than sunset exporters.
Churning along the destination-country margin also generated positive export growth. By contrast, there is a more anaemic performance in terms of sector and product differentiation.
Again, taking 2002/03 as the base year over the 2002-2010 period, existing firms were instrumental in exporting to new countries, and even while there was evidence of exits, the net effect on the export growth rate was positive.
Sector and product churning over the 2002-2010 period, was overall not very significant, and it seems that on average exits outweighed entries.
Usually a higher positive contribution to export growth along the sector/ product margins should be expected that along the firm margin, due to the higher fixed costs of entry into export than for expanding the product range. In Pakistan, the sector/ product margin of growth is underperforming.
The rates of survival in Pakistan are not low, at least compared to a group of middle -low income countries, for which customs data at the firm level are also available. For instance, in one year, 43 percent of firms exit, and by year 7 only 24 percent survives. Still, compared with other countries Pakistan is more effective in keeping exporting firms in the market – at least in the short run.
Dynamism was significantly reduced after 2004 and has still not recovered. On average, fewer firms entered and exited the export market since 2004. Similarly incumbent exporters
became more conservative over time in terms of export markets, sector and product experimentation. In short, entries and exits by new firms, existing firms in new countries, sectors and products, all fell over the second half of the past decade.
Box 1
Determinants of Export Growth Econometric Results
Firm level information has allowed, the OLS correlation between export growth and some key outcomes analyzed in through the papers. The Fist is that r Pakistan can maximize its chances of exporting by eliminating barriers to trade and by using trade policy to create the conditions that foster firm dynamism, experimentation and quality upgrading of their products.
Diversification is good for export growth. Diversification, be it in terms of firms, products or destinations is positively correlated to export growth, with an effect that is sizeable and significant.
Pakistan has been quite successful in increasing its exports by having more firms starting exporting and by having more exporters entering new markets. The performance in terms of helping firms breaking into new sectors and products has however been less satisfactory.
Tariff Structure Complexity in destination markets is an obstacle to export growth. A 1% increase in tariff “complexity” in the destination country leads to a 13.2% decrease in export growth by Pakistani firms. We measure tariff complexity as the standard deviation at the (HS-4 digit) sector level of individual HS-6 digit MFN and applied tariffs.
Firm level exports are constrained by fixed costs associated with entering in the exporting activity.
Econometric analysis on firm level export growth shows, for example, that a 1% change in the amount of impediments at the border implies a 16.7% change in a firm’s export growth Trade impediments at the border have a sizeable and statistically negative effect on all the extensive margins of trade and as a result, mpede resources to flow to the most productive firms, sectors and products.
Fluctuations in export growth are linked to developments in the global demand. Largely determined by external and market conditions, demand can explain an important share of fluctuations and cyclical patterns in the export performance. Amidst very uncertain and volatile conditions for global demand.
Pakistan Policy Framework - Trade Policy
26. Chapter III examines Pakistan’s trade policy, one of the key contributors to trade orientation and export growth. For the past two decade, uses as the primary tool for policy objectives, use of tariffs - statutory and regulatory, and exemptions of such, along with various types of export subsidies – in terms of finance, fiscal tax exemptions, as opposed to the more opaque quantitative restrictions and explicit licensing requirements. Clearly, periods of simplification and liberalization at the end of the 1980s and again at the end of the 1990s, have coincided with the soon to follow, growth spurts in trade, both in terms of the extensive as well as the intensive margin.
27. Beginning in the mid-1990, Pakistan embarked on period of multilateral and unilateral trade liberalization program that was noteworthy for its depth and coverage. The program reduced government intervention, lowered and simplified tariffs and abolished remaining quantitative
restrictions. This along with favorable macro-economic environment and complementary reforms contributed to the export and growth spurt, which continued through until the mid 2000s.
28. However, during the last seven years, Pakistan’s policy framework has seen major policy reversal. With a limited, but effective bias toward policies of indigenization programs, Pakistan’s trade policy became increasingly complex as it was now more susceptible to input from vested interests.
29. Complementing the policy reversal from Pakistan’s open trade regime was an external and internal deterioration in the business environment, in part due to deficient economic governance and infrastructure services. New import substitution policies started being implemented; with the pace accelerating since the crisis in 2008 Trade policies have become increasingly oriented to provide extra protection to the processing margins of determined local products and producers.
30. Pakistan is now ranked as the sixth most protected economy in the world according to the Overall Trade Restrictiveness Index (OTRI). While the OTRI of Pakistan is still not higher than India at the 88th percentile of countries, it reflects an increased complexity of trade policy and the reversal of some of the early progress towards reforms. Pakistan’s protection of the domestic market is the main determinant of the high OTRI.
31. Pakistan’s institutional system of trade policy application now contains a strong administrative protections system. For example, the “Strategic Trade Policy Framework 2009-12” by the Ministry of Commerce, the National Tariff Commission (NTC, )the websites of the Engineering Development Board (EDB) he Ministry of Industry,-suggest that protection of domestic industries along with infant industry arguments through tariffs and other measures are integral parts of the Government’s economic strategy. The Planning Commission’s recent document envisions a system without such an approach to industrialization. The Planning Commission Government of Pakistan (2011) recommends that the way forward should include the re-establishment of the unilateral trade liberalization program.7
32. Reconciling the protectionist objectives with ad-hoc interventions while also aiming at streamlining its trade policy and pursuing greater openness, it is worth recalling that “customized”
domestic protection entails important costs and risks.
Public support will be distortive, going to industries with high costs and low productivity at the expense of more efficient industries.
Schemes that grant protection increase scope for smuggling and under-invoicing. The cascading principle, evoked by many governmental documents, makes this likely especially for final goods.
7Tthe Planning Commission Government of Pakistan (2011) the immediate abolishment of the present system of distortive duties; the maintenance of a neutral real exchange rate policy; the re-establishment of normal trade relations with India, and acceleration of already signed free trade agreements, notably with China and Malaysia. See Planning Commission Government of Pakistan (2011) “Pakistan: Framework for Economic Growth”, pag.74.
Domestic market protection achieved through tariff protection generates an anti-export bias.
Since exporting firms do not have any benefit from domestic tariff policies.
Protection increases the complexity of the tariff regime and associated information costs.
33. In particular, the ensuing approach of pursuing very precisely targeted protection measures have given rise to an increase in tariff complexity as the applied levels of protection have now diverged dramatically from customs duty rates for many products, given the range of untrackable exemptions plus the addition of regulatory duties (Box 2).
Box 2
Trade Policy in Pakistan Increased Tariff Complexity
The deviation of applied tariff rates from official rates is based on an increasingly complex structure of tariffs, exemptions and refunds. Duty drawback and/or concessions due to free trade and other arrangements are to be expected and are featured in many countries’ tariff policy. However, the contrast between MFN ad valorem rates and effective duties observed in Pakistan are even more dramatic than most.
The official schedule in 2009/2010 suggests that custom tariffs have 14 slabs or bands, ranging between 0 and 150 percent with 40 percent of tariffs at 5 percent or less in ad valorem terms.
Transportation (automotive sector) attracts the highest tariff levels, as high as 60 percent in some cases with peaks above 90 percent for a few products (19 at HS 6-digit level). A large segment of agricultural goods are taxed at 35 percent,1 but the official MFN schedule-based average is much lower, i.e. around 15.9 percent. Meanwhile, the average tariff for industrial sector is around 13.2 Finally, about 45 percent of the official schedule displays low tariffs, ranging from 0 to 5 percent.
The applied schedule using customs data at the transactions level for 2009/2010 at the 8-digit level shows that Pakistan applied some 40 different rates.
Over 50 percent of the effective tariffs are either 5 percent or less in ad valorem terms, with more bands appearing at the upper end of the scale, creating a higher level of dispersion. In addition, at least 2 percent of transactions appear to levy a rate between zero and less than 2 percent ad-valorem, tantamount to “nuisance taxes”. Nuisance taxes, while adding to the cost of business, increase the administrative burden of collecting them potentially outweighing the benefit to the government from marginal revenues.
34. Since 2007, protection doubled for many products, while others went down to zero for certain importers while in 2008, almost 400 products were subject to regulatory duties on top of customary duties. At the same time, tariffs were reduced in the inputs not produced by Pakistan which enhanced the escalation in the tariff regime and created a very heterogeneous system of effective protection.
This complexity unweighted averages of MFN tariffs a poor benchmark for assessing Pakistani trade policy, particular as this statistic has been decreasing over time. Some specific characteristics of Pakistan’s trade policy on the import tariff side.
Official custom schedule suggests a systematic escalation of tariffs by stages of processing.
Raw materials and inputs attract low tariffs while consumer goods are taxed higher - twice as high in many cases. This pattern is more prominent and dramatic in consumer durable goods.
Tariff dispersion is exploded through duties and exemptions covering half of tariff lines.
Local content requirements were dropped in 2006 for WTO compliance, in favor of a complex mix of regulatory duties and partial exemptions for inputs (see Box 3).
Transparency and predictability were the other casualties of this approach. Regulatory duties and special duties issued by Statutory Regulatory Orders (SROs) are notified in the official Gazette, but not consolidated in any published format nor included in the tariff schedule.
Regulatory duties climbed to as high as 100 percent, while special duties up to 35 percent, mostly applied to finished goods and consumer durable goods.
Box 3
SRO Exemptions As A Trade Tool
Exemptions and partial exemptions provided for industries under SRO regimes are a key source of deviation from MFN rates and a serious distortion in incentives since they are exemptions for inputs for specified firms or groups of firms.
Analysis of the level and structure of Pakistan’s tariffs is complicated by SRO based exemptions and partial exemptions to tariffs, sales and other domestic taxes. Though provided on the FBR website, the complexity the SRO itself make it difficult to discern the applicable taxes and other measures imposed on individual tariff items, particularly when multiple SROs apply.
The most prominent set of SROs are 565(1)2006, 567(1) 2007 and 575(1) 2007, accounting for 23 percent of Pakistan’s imports in 2009/2010). On average, firms or industries under these three SRO provisions received concessions up to about 11 percentage points from the statutory rates, applied non-uniformly across industries The exemptions under SRO (565, 567 and 575) cover several sectors, including chemicals, automotive, rubber and plastic industries as well as the agricultural sector.
Almost half (44 percent) of all SROs provided exemptions to the machinery and appliances sector, which also accounted for a quarter of all regulatory duties (22 percent) - selectively applied to the finished goods segment of this sector. There is an additional scheme of exemptions for the automotive sector that discriminates by Original Equipment Manufacturer (OEM) versus After Sales part and is implemented under SRO 655 (1) and 656 (1) 2006, and SRO 693 (1) 2006.
A common feature of all SROs is that their within sector incidence varies considerably distorting the incentive structure and complicating an already complex tariff system. (e.g. optical photography and related products with a high technological and capital intensity content enjoy low effective protection while footwear and head gear have high effective protection rate)s. Accounting for preferential agreements, about 18 percent of applied tariff variability is caused by the use of exemptions, of which 11 percent are detected at the firm level.
35. Tariff escalation and schedule complexity results in effective rates of protection (ERP) are far greater than nominal rates. By taking into account protection on both outputs and inputs, ERPs provide a more accurate the representation of incentives protection of “value added.” Showing the expected amplification of the escalation and reinforce the earlier assertion about the escalatory tariff