Research Collection
Journal Article
Active distribution networks or microgrids? Optimal design of resilient and flexible distribution grids with energy service provision
Author(s):
Wu, Raphael; Sansavini, Giovanni Publication Date:
2021-06
Permanent Link:
https://doi.org/10.3929/ethz-b-000475935
Originally published in:
Sustainable Energy, Grids and Networks 26, http://doi.org/10.1016/j.segan.2021.100461
Rights / License:
Creative Commons Attribution 4.0 International
This page was generated automatically upon download from the ETH Zurich Research Collection. For more information please consult the Terms of use.
ETH Library
Sustainable Energy, Grids and Networks 26 (2021) 100461
Contents lists available atScienceDirect
Sustainable Energy, Grids and Networks
journal homepage:www.elsevier.com/locate/segan
Active distribution networks or microgrids? Optimal design of resilient and flexible distribution grids with energy service provision
Raphael Wu, Giovanni Sansavini
∗Reliability and Risk Engineering Laboratory, Institute of Energy and Process Engineering, Department of Mechanical and Process Engineering, ETH Zurich, Leonhardstrasse 21, 8092 Zurich, Switzerland
a r t i c l e i n f o
Article history:
Received 14 December 2020
Received in revised form 1 March 2021 Accepted 8 March 2021
Available online 16 March 2021 Keywords:
Power distribution planning Resilience
Optimization
Energy system transition Islanding
Flexibility
a b s t r a c t
Ensuring the continuity of service in electricity distribution grids at minimum costs is a key challenge in many countries, as extreme weather events and fluctuating renewable energy increase. New grid concepts such as active distribution networks with distributed energy resources, or microgrids that can operate in islanded mode, offer opportunities to improve the reliability and resilience of distribution grids. This paper presents an active distribution network design optimization with the option to transition into a microgrid, quantifying reliability and resilience improvements, and considering faults within the network as well as unexpected islanding events, which require fast-ramping distributed energy resources. Flexibility, both of loads and distributed energy resources, is used to provide energy services to the surrounding grid with a detailed and general model. Solving the resulting mixed-integer linear program with Column and Constraint Generation and Surrogate Absolute Value Lagrangian Relaxation decreases the computational time significantly. Case studies and sensitivity analyses provide general results for the reliability and resilience targets entailing the optimum transition to microgrids, and quantify the contribution of energy service provision to reduce overall costs.
©2021 The Authors. Published by Elsevier Ltd. This is an open access article under the CC BY license (http://creativecommons.org/licenses/by/4.0/).
1. Introduction
The proliferation of distributed generators (DG), storage, com- munication and control enables distribution grids to transition from passive to active distribution networks (ADNs) [1]. This transition aims at increasing efficiency and renewable energy, using demand flexibility, and speeding up outage recovery [1].
Furthermore, ADNs are able to offer ancillary or other energy services (ES) [2]. Microgrids (MGs), with their islanding ability [3], are a further step in this transition, adding resilience to distribu- tion grids. Within this paper, resilience is defined as the ability to anticipate, absorb and recover from large disturbances by islanding, whereas reliability is the ability to withstand random faults within the ADN [4].
Transitioning from an ADN to a MG can be a significant trans- formation, depending on parameters such as the amount of dis- tributed energy resources (DER) already installed, reliability and resilience targets, as well as the costs of additional DER, commu- nication, control and protection to enable islanding [3]. Therefore, the decision between a MG and other ADN options should be made carefully, considering all issues and opportunities listed above.
This paper investigates the following research questions:
∗ Corresponding author.
E-mail address: sansavig@ethz.ch(G. Sansavini).
(1) How do reliability and resilience goals influence the opti- mal DER mix and the decision between ADNs or MGs?
(2) How much can ES contribute to incentivize DER invest- ments in today’s markets?
1.1. Microgrid transition: Enabling islanding in ADNs
The vast majority of MG design optimization literature as- sumes that the decision to create a MG is already made [5].
Two exceptions are [6], which evaluates the economic viability of a MG, and papers on partitioning feeders into MGs, which may not be connected to any substation [7], or can island if sufficient DER are already present [8]. None of the papers above consider that adequate DER capacity is not enough to ensure successful islanding. In case of an unexpected external blackout, DER must ramp up within tens of milliseconds [9] to seconds [10]
to prevent a voltage and frequency collapse, depending on control strategies, DER and load types. Droop control and virtual inertia [11] improve ramp-up times to 0.1–1s, which can be achieved with batteries [12] or supercapacitors [13]. Reactive power must also be ramped quickly to ensure successful islanding [14].
In addition to adequate and fast-ramping DER, a prospective MG needs communication, control and protection hardware and software to island [3]. As DER and line investment, communica- tion, control and protection are usually separately planned for ADN [15], most MG planning optimizations consider a subset of
https://doi.org/10.1016/j.segan.2021.100461
2352-4677/©2021 The Authors. Published by Elsevier Ltd. This is an open access article under the CC BY license (http://creativecommons.org/licenses/by/4.0/).
these tasks. In [16], communication hardware and reconfigura- tion switches are co-optimized, but without sizing DER. The cost of protection devices for islanding is considered in [17], albeit without power flow.
Due to the complexity of designing a MG including DER, lines, communication, control and protection, there is no optimization method in literature to design an ADN with the option to transi- tion to a MG. This paper is a first step towards filling this gap, by modeling the decision, technical requirements and cost of transforming an ADN into a MG.
1.2. Energy services
As MGs mostly island during rare disturbances [4], their DER can be used to generate additional revenue by offering ES [18].
Providing ancillary services and reliability reserves is found to be synergistic and improve the business case for MGs [19]. How- ever, [19] neglects power flow. Furthermore, the modeled UK ancillary market does not include energy payments and ES can only be called once per day. MG operation is optimized in [2]
by bidding in day-ahead energy, spinning reserve and flexibility ramping markets, considering payments for ES energy as well as uncertainty in market prices and renewable generation. However, the only constraints on storage are that there should be enough energy to maintain the committed power during a single hour. If the ES gets called for several hours, the storage could be emptied, rendering the MG unable to deliver the service. This problem is addressed in [20], where the available ES capacity is the minimum surplus that can be maintained over 24 h of operation. As [20]
only assesses the capability of MGs to provide ES, payments for ES energy and capacity are not considered.
1.3. Contributions
The key contribution of this paper is to propose a method to enhance the reliability, resilience and economic performance of distribution grids by optimizing the transition from ADNs to MGs. DER are optimally sized and participate in ES, as DER backup power is rarely needed. The following method advancements are achieved:
(1) the decision of transforming an ADN into a MG is modeled within the design optimization, considering the costs of additional equipment, and resilience implications;
(2) successful, unanticipated islanding is ensured by introduc- ing ramping constraints for active and reactive power, with potential shedding of low priority loads;
(3) constraints on established quality indices, i.e. SAIFI and SAIDI, are introduced, and we show that they can quan- tify reliability and resilience. Target values can be met by installing lines, investing in DER and creating a MG;
(4) a general framework to model ancillary and reliability ser- vices to the surrounding grid is introduced. ES are modeled with power flow, capacity and energy payments, ensuring sufficient stored energy even if the ES can be called during several time intervals per day;
(5) an efficient solving method based on Surrogate Absolute- Value Lagrangian Relaxation (SAVLR [21]) is developed.
1.4. Optimal MG design
Table 1summarizes the MG model [22] upon which the de- veloped models for energy services, for demand flexibility and for reliability and resilience build. To facilitate the understanding, decision variables, constraints and objective function contribu- tions are split into 4 levels containing the optimal design (1)
and operation (2), resilience (islanding events (3)), and reliability (faults within the MG (4)). Despite the hierarchical structure, all variables, constraints and objective contributions are solved in a single optimization problem.
The investment level (1) contains DER installed capacitiesSmaxDER and binary investment variables,yDERInv for DER andylfor lines. DER investment costs are approximated as affine functions CInDERv = cDERInv,0yDERInv +cInDERv,SSmaxDER, with fixed (cInDERv,0) and capacity-dependent costs (cInDERv,S). The rated PCC power has a cost ofCCapPCC =cCapPCCSmaxPCC. The total investment and operation costs are
CInv=∑
DER
CInDERv +∑
l
Cl,Inv+CCapPCC (1)
COp=
T
∑
t=1
wt
(
COpPCC,t+∑
DER
COpDER,t+∑
RG
CCurtRG,t )
(2)
DER operation in level (2) is modeled with the activePtDER and reactive power QtDER produced. Storage includes stored energy variablesEStrt , and constraints on charging, discharging and aging.
Power flow is modeled with linearized DistFlow and radiality constraints [22], power balances at each bus and capacity limits.
To reduce the computational effort, a representative day method [22] is used. In the operations cost (2), wt is the number of represented days per year.
Stochastic islanding events in level (3) are modeled as separate scenarios, beginning at each time step t. All constraints and variables of level (2) are repeated for each islanding scenarioi.
The power exchanged at the PCC is set to zero, and storages are initialized at the energy level before islanding.
Faults within the MG in level (4) are modeled using line failure ratesλl and repair durationsτl. The outage frequencyλDmdFl and expected durationUFlDmdat each demand busDmdare calculated using binary variablesyDmdl andyDmdl , which are constrained to be 1 for the path between the PCC and each demand bus [22]. SAIFI and SAIDI are calculated using binary variables y˜Dmd
NS,t and y˙Dmd
NS,t, indicating the time steps during which demand exceeds supply at every bus:
λDmdFl =λDmd+∑
l
(yDmdl +yDmdl )
λl ∀Dmd (3)
UFlDmd=λDmdτDmd+∑
l
(yDmdl +yDmdl )
λlτl ∀Dmd (4)
SAIDI= (
∑
Dmd
nDmdCustUFlDmd∑
t
y˜DmdNS,t/T )
/∑
Dmd
nDmdCust (5)
SAIFI= (
∑
Dmd
nDmdCustλDmdFl ∑
t
˙yDmdNS,t/T )
/∑
Dmd
nDmdCust (6)
wherenDmdCust is the number of customers per bus.
The remainder of this paper is organized as follows: Sections2 and3introduce the proposed ADN and MG design optimization and the solution method. Section4introduces the case study. Sec- tion5discusses the resulting optimal ADN and MG designs and highlights the improvements of the proposed approach compared to literature. Section6concludes.
2. Proposed optimization model
The proposed ADN design optimization model including the investment and operation of DER and lines, considering reliability, demand flexibility, ES as well as the option to transform the ADN into a MG, is presented in the problemP1:
P1:O1=minCInv+COp+CDF+yMGInvcMGInv −IES (7) s.t. the constraints inTable 1,(1)–(2),(5)–(6),(8)–(44)
2
R. Wu and G. Sansavini Sustainable Energy, Grids and Networks 26 (2021) 100461
Table 1
Summary of the 4-level MG optimization model in [22], which is expanded in this paper.
Model level Decision variables Constraints Objective contribution
(1) Investment - DER capacitiesSmaxDER,EmaxStr - Binary investmentyl,yDERInv - PCC capacitySPCCmax
- Discrete investment options (lines) - Fixed cost constraints
- Line investment costCl,Inv - DER investment costCInDERv (2) Operation - DER powerPtDER,QtDER
- Storage charging/ discharging powerPchStr,t,PStrdi,t - Stored energyEtStr
- Power flows, voltagesPl,t,Ql,t,Vb2,t
- PCC importPtPCC,QtPCC
- DER, PCC and line capacity limits - Minimum part loads (DG) - Available energy (RG) - Energy balances (Str) - Str Cycling limits - DistFlow equations - Radiality constraints
- Nodal power balances with demandsStDmd
- DER Operations costCOpDER,t - RG curtailment penaltyCCurtRG,t - PCC import costCOpPCC,t
(3) Resilience - DER powerPtDER,QtDER
- Storage charging/ discharging powerPchStr,t,PStrdi,t - Stored energyEtStr
- Power flows, voltagesPl,t,Ql,t,Vb2,t
- PCC importPtPCC,QtPCC
- Zero PCC power - Str energy continuity
- Cost of redispatchCRes
(4) Reliability - Path variablesyDmdl ,yDmdl
- Net demandPnetDmd,t
- Indicators that Dmd cannot supply itselfy˜DmdNS,t,y˙DmdNS,t
- Path modeling between Dmd and PCC - Active and apparent power limits on DER supplying their bus
- Cost of demand not suppliedCRel
P1 minimizes the equivalent annual cost [22] of investment CInvand operationCOpof lines, DER, and PCC electricity, the cost of activating demand flexibilityCDF and the cost of transforming the ADN to a MG, expressed by a binary variableyMGInvand the costcInMGv. AsP1 is a minimization, the ES incomeIEShas a negative sign. The modeling and objective contributions of ES, demand flexibility and the microgrid transition are described in Sections2.1,2.2and 2.3, respectively.
2.1. Energy services
To capture reliability services [19] as well as ancillary service markets [23], the following general ES framework is modeled: For each market time intervaltES, the ADN offers a capacity to absorb or provide power. The effectively provided power is uncertain, as dispatch decisions are made externally, e.g. by the transmission system operator (TSO). To ensure that the ADN can provide the offered power, the maximum ramp up (ESU) and ramp down (ESD) ES cases are modeled as separate scenarios, subject to all constraints inTable 1, level (2). The resulting PCC import power, PESUPCC,t for the ESU and PESDPCC,t for ESD, is used to determine the available ES capacity:
PESU
tES ≤PtPCC−PESUPCC,t ∀tES,t∈tES (8) PtESDES ≤PESDPCC,t−PtPCC∀tES,t∈tES (9) wherePESU
tES andPESD
tES are the available capacities for ESU and ESD respectively. In(8), the offered ES capacity is the minimum differ- ence between the originally planned importPtPCCand the reduced ESU power importPESUPCC,t. As ES dispatch can empty or fill storages completely, the available ES capacities can become negative, thus the ADN should not offer ES during that time. Therefore, binary variables yESU
tES and yESD
tES are introduced, indicating that the ADN is offering ES. The following constraints ensure that ES are only offered if the available capacity is nonnegative, and model the ADN incomeIESU
P,tES and IESD
P,tES for offering ES capacity with prices cESU
P,tESfor ESU andcESD
P,tES for ESD:
IESU
P,tES=cESU
P,tESPESU
tESyESU
tES ∀tES (10)
IESD
P,tES=cESD
P,tESPESD
tESyESD
tES ∀tES (11)
IPESU,tES,IPESD,tES≥0∀tES (12) ES energy is priced atcEnESU,t andcEnESD,t. As the dispatch is uncer- tain, energy payments can range between zero and the maximum
dispatchcEnESU,t(
PtPCC−PESUPCC,t)
for ESU. For a conservative estimate, the energy costCESU
En,tES are constrained as:
CESU
En,tES≥0∀tES (13)
CESD
En,tES≥0∀tES (14)
CEnESU,tES≥∑
t∈tES
(
∑
DER
(COpDER,ESU,t−COpDER,t)
−cEnESU,t∗(
PtPCC−PESUPCC,t) )
−M(1−yESU
tES)∀tES (15)
CEnESD,tES≥∑
t∈tES
(
∑
DER
(COpDER,ESU,t−COpDER,t)
−cEnESD,t∗(
PtPCC−PESDPCC,t) )
−M( 1−yESD
tES
) ∀tES (16)
If the TSO requires no ESU,(13)is binding. The cost for maximum ESU dispatch in (15) is the difference in DER operations cost
∑
DER
(COpDER,ESU,t−COpDER,t)
, from which the energy payment for ES is subtracted. If the ADN is not offering ES, (15) is relaxed by
−M(1−yESU
tES) with a sufficiently large M [24]. The ESD case is treated analogously in(14),(16).
The total ES incomeIES consists of the capacity and energy related costs and revenues, considering the time step weight of each ES market time intervalwtES.
IES=∑
tES
wtES
( IESU
P,tES+IESD
P,tES−CESU
En,tES−CESD
En,tES
)
(17)
This general ES model can be adapted to different ancillary service markets and products, such as frequency containment reserve and frequency restoration reserve in Europe [25], or reg- ulation and reserve services in the USA [26]. The general model allows for asymmetric service provision (PESU
tES ̸=PESD
tES), however, symmetric provision for specific markets [25] can be enforced with the additional constraint PESU
tES yESU
tES = PESD
tES yESD
tES. While an- cillary services are provided during normal operation, ADNs can offer the flexible capacity to neighboring distribution networks in case of a local blackout [19]. The same ES model(8)–(17)can, therefore, be used to model reliability services.
2.2. Demand flexibility
Flexible demands are modeled using the approach in [27], where a predefined fractionfADFvl,t of the apparent demandSDmdt can be shifted within a time windowtDF:
0≤SDFfr,t≤fADFvl,tStDmd∀Dmd,t (18)
3
0≤StoDF,t ∀Dmd,t (19)
∑
τ∈tDF
fEnDF,τSfrDF,τ−SDFto,τ =0∀Dmd,tDF (20)
SDFmax≥SfrDF,t ∀Dmd,t (21)
CDF =∑
Dmd
cDFSmaxDF (22)
where SfrDF,t is the demand shifted from time t, and SDFto,t is the demand shifted to timet. The net demand shifted to timet is denoted asStDF =StoDF,t−SfrDF,t. The demandStDmd in all constraints in Table 1 is replaced by (StDmd +StDF), which is the demand including flexibility. The cost of activating demand flexibilityCDF in(22)is proportional to the maximum demandSmaxDF shifted away from any time. This cost can model situations where the ADN planner invests in devices to control flexibility at each demand bus [27], or reflect existing demand response markets where flexible demands are paid for the offered capacity [28].
2.3. Microgrid transition, reliability and resilience
To model the transformation of an ADN into a MG, two deci- sions are modeled: First, a binary variableyMGInv indicates whether the necessary control, communication and protection equipment for islanding is installed. Second, there might be priority de- mandsDmdPr which should always be supplied during islanding, whereas other loads can be shed. Therefore, a binary variableyDmdSh is introduced, and constrained to be 1 if the demandDmdis shed while islanding:
yDmdSh ≥1−yMGInv ∀Dmd (23)
yDmdSh =1−yMGInv ∀DmdPr (24)
While(23)ensures that all demands are shed during islanding if the MG is not built (yMGInv =0),(24)indicates that if the MG is built, demandsDmdPr must not be shed when islanding. Using yDmdSh , constraints(3)and(4)are replaced by:
λDmdFl =λIslyDmdSh +λDmd+∑
l
(yDmdl +yDmdl )
λl∀Dmd (25)
UFlDmd=UIslyDmdSh +λDmdτDmd+∑
l
(yDmdl +yDmdl )
λlτl∀Dmd
(26) whereλIslis the rate andUIslis the expected duration of islanding events. Including islanding in the nodal outage rate and duration enables buses with DER to self-supply, irrespective of the fault location and whether a MG is built or not. Load shedding while islanding is only enabled ifyDmdSh =1:
SDmdNS,i,t ≤MtDmdyDmdSh ∀Dmd,i,t (27) where SDmdNS,i,t is the demand not supplied during islanding, and MtDmd≥StDmd+StDF is a sufficiently large parameter (Big-M [24]).
The combination of(24)and (27)sets the demand not supplied to zero for all priority loads when a MG is built, whereas(25)–
(27)ensure that if a load is shed (SNSDmd,i,t >0, thusyDmdSh =1), the corresponding contribution from islanding events is added to the nodal outage rate and duration.
This model is advantageous because targetsSAIFImax,SAIDImax on total SAIDI and SAIFI can be imposed, whether the faults occur inside or outside the ADN or MG:
SAIFI≤SAIFImax (28)
SAIDI≤SAIDImax (29)
2.3.1. DER ramping for islanding transitions
To prevent a blackout when islanding unexpectedly, there must be sufficient fast-ramping DER in a MG. The DER ramping capability is modeled using the variablesPRUDER,t,PRDDER,t,QRUDER,t,QRDDER,t, with active and reactive ramp-up (RU) and ramp-down (RD) capacities. Ramping power is limited by:
PRUDER,t,PRDDER,t,QRUDER,t,QRDDER,t ≥0∀DER,t (30) PrDER,t ≤fPDER,r SmaxDER ∀DER,t, r∈ {RU,RD} (31) QrDER,t ≤fQDER,rSmaxDER ∀DER,t, r∈ {RU,RD} (32)
(PtDER+PRUDER,t)2
+(
QtDER+QRUDER,t)2
≤( SmaxDER)2
∀DER,t (33) (PtDER+PRUDER,t)2
+(
QtDER−QRDDER,t)2
≤( SmaxDER)2
∀DER,t (34) PrDER,t ≤MyDEROp,t ∀DER,t, r∈ {RU,RD} (35) QrDER,t ≤MyDEROp,t ∀DER,t, r∈ {RU,RD} (36) All ramping powers are nonnegative (30), and are limited by each DER’s fast ramping capability, which is proportional to the installed capacitySmaxDERwith factors fPDER,r ,fQDER,r ∈ [0,1]. Apparent power limits(33)–(34)must be respected when the DER power changes toPtDER+PRUDER,t,QtDER+QRUDER,t,PtDER−PRDDER,torQtDER−QRDDER,t after islanding. As the active power of most DER is nonnegative, PRDDER,tis omitted in(33)–(34), because it can only reduce the appar- ent power magnitude. DER which are not permanently online can only contribute to ramping if they are already operating (yDEROp,t = 1), which is enforced with the Big-M constraints(35)–(36)[24].
Storage ramping is additionally constrained by:
(PtStr−PRDStr,t)2
+(
QtStr+QRUStr,t)2
≤( SmaxStr)2
∀Str,t (37) (PtStr−PRDStr,t)2
+(
QtStr−QRDStr,t)2
≤( SmaxStr)2
∀Str,t (38) PRDStr,t≤(
EmaxStr −EStrt )
/(ηchTRDStr)+PdiStr,t ∀Str,t (39) PRUStr,t≤(
EtStr−(
1−DODStrmax) EStrmax)
ηdi/TRUStr+PchStr,t ∀Str,t (40) The storage powerPtStr=PdiStr,t−PchStr,tis positive when discharg- ing. As storage can have negative active power, PRDStr,t has to be considered in the apparent power limits(37)–(38). Furthermore, the storage ramping power is limited by energy limits(39)–(40).
According to(39), the storage output power can be reduced if the storage is currently discharging (PdiStr,t >0), or if there is enough energy capacity left to charge the storage during the ramping timeTRDStr.(
EStrmax−EStrt )
/ηchis the remaining energy which can be charged, considering the charging efficiencyηch. Eq.(40)enables the storage to ramp up whenever it is charging (PchStr,t > 0), and if there is enough energy left without discharging beyond the maximum depth of dischargeDODStrmax, considering the discharge efficiencyηdi. The impact of ramping events on storage energy levels in subsequent time steps is neglected, as ramping events are very short compared to the operating time step lengths.
With all DER ramping capabilities defined, the MG ramping requirements are expressed as(41)–(44):
fP,RUPtPCC≤∑
DER
PRUDER,t+∑
Dmd
yDmdSh (PtDmd+PtDF)+M(1−yMgInv)∀t
(41) fQ,RUQtPCC ≤∑
DER
QRUDER,t+ ∑
Dmd|QtDmd>0
yDmdSh (QtDmd+QtDF)
+M(1−yMgInv)∀t (42) fP,RDPtPCC≥ −∑
DER
PRDDER,t−M(1−yMgInv)∀t (43)
fQ,RDQtPCC ≥ −∑
DER
QRDDER,t− ∑
Dmd|QtDmd<0
yDmdSh (QtDmd+QtDF)
4
R. Wu and G. Sansavini Sustainable Energy, Grids and Networks 26 (2021) 100461
−M(1−yMgInv)∀t (44) Eq.(41)ensures that if the MG is importing power (PtPCC >0) and an unexpected islanding transition happens, the MG can cover its power importPtPCC with sufficient ramp-up power∑
DERPRUDER,t including a safety factorfP,RU≥1, while shedding all low priority loads∑
DmdyDmdSh (PtDmd+PtDF). If no MG is built, the termM(1−yMgInv) relaxes the PCC ramping requirement. Eq. (42) is the reactive power equivalent of(41), while(43)and (44)model the ramp- down requirements when the MG is exporting (PtPCC,QtPCC <0).
As the active power demand (PtDmd+PtDF) is nonnegative, shedding loads would not help if the MG is exporting power, thus the load shedding term is omitted in(43).
The safety factors fP,RU, fP,RD, fQ,RU and fQ,RD are greater or equal to 1 and depend on the load types [9], and the load and RG uncertainty [29]. If there is a succession of DER ramping up at different times, several sets of constraints (30)–(44) are used, each modeling a different time window during the islanding transition.
3. Solution method 3.1. Linearization
The optimization problem P1 in (7) contains two kinds of nonlinearities, which are removed to transformP1 into a Mixed Integer Linear Program (MILP). The products of a binary variable yand a continuous variablexin(5),(6),(10),(11),(41)and(42) are replaced by exact linear reformulations [30]:
x−u(1−y)≤z≤x−l(1−y) (45)
ly≤z≤uy (46)
where l is a lower bound on x, u is an upper bound on x, and z is a continuous variable constrained to be equal to the product xy by (45)–(46). Quadratic capacity limits of the form P2+Q2≤S2in(33)–(34),(37)–(38)are replaced by a polygonal inner approximation [22]:
Pcos ((
n−1 2
)2π N
) +Qsin
((
n−1 2
)2π N
)
+ ≤Scos(π N )
∀n∈ {1,2, . . . ,N} (47)
where N is the number of sides of the polygon.
3.2. SAVLR-CCG solution
The overall linearized ADN and MG optimization problemP1 in (7) is a stochastic MILP, which becomes prohibitively large to solve. The Column-and-Constraint Generation (CCG) approach in [22] is insufficient to solveP1: State-of-the-art solvers CPLEX and Gurobi [31] reduce the MIP gap to 7%–12% within 4 h for the case study in Section 4, but achieve only 3.5%–8% within 120 h. This lack in progress is related to ES and storage, as the removal of each enables solving P1 to 1% MIP gap in 2 h.
Therefore, a Lagrangian decomposition method is developed. A subproblem without ES calledP2 in(48)–(49), and a subproblem without reliability and resilience calledP3 in(50)–(53)are solved iteratively:
P2:O2=minCInv+COp+yMGInvcMGInv +λTg( xDes,xDesP3
)+c∑
j
qj
(48) s.t.the constraints inTable 1
(1)–(2),(5)–(6),(18)–(44)
−qj≤g(
xDes,xDesP3)
≤qj (49)
P3:O3=minCInv+COp−IES+λTg(
xDesP2,xDes) +c∑
j
rj (50)
s.t.Constraints of Levels1and2inTable 1 (1)–(2),(8)–(22),
−rj≤g(
xDesP2,xDes)
≤rj (51)
∑
DER
SmaxDER≥∑
DER
SDERmax,P2 (52)
f1SDERmax,P2≥SmaxDER≥f2SmaxDER,P2∀DER (53) The additional objective terms and additional constraints [21,32]
ensure that P2 and P3 converge to an identical and optimal design: A ‘‘copy-constraint’’ [32] is introduced by setting the functiong(
xDesP2,xDesP3
)in (54)to zero, indicating that the design variables for DER and linesxDes=[
SmaxDER EmaxStr SmaxPCC yl]T
inP2 andP3 must be equal:
g( xDesP2,xDesP3
)=xDesP2 −xDesP3 (54) Using the SAVLR method [21], the violation ofg(
xDesP2,xDesP3
)= 0 is added to the objective functions of P2 and P3, with La- grange multipliersλ. To speed up convergence, the violations of g(
xDesP2,xDesP3)
= 0,qj in(49)andrjin(51), are penalized with a weightc≥0.
The ES income inP3 does not usually lead to sufficient DER investment to ensure the reliability and resilience required inP2.
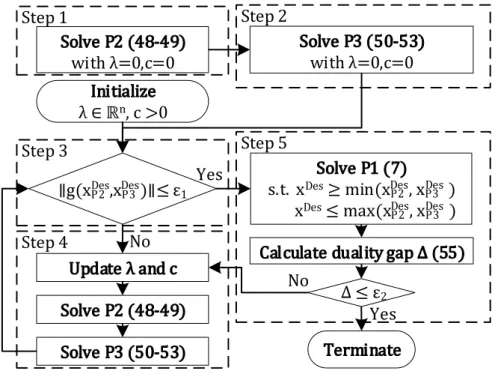
Therefore, adding the surrogate constraints(52)–(53)reduces the number of iterations needed to find a consensus on DER invest- ments betweenP2 andP3. Sufficient DER capacity is guaranteed by(52), whereSmaxDER,P2is the installed DER capacity inP2 in the most recent iteration. Withf1>1 and 0≤f2<1,(53)improves the solver time by limiting the DER capacity changes compared toP2, and by bounding the feasible set ofP3 [33]. To ensure that (52)–(53)do not exclude any optimal solutions,P3 is resolved with increasedf1, or decreasedf2as soon as anySmaxDERreaches one of the limits. The solution procedure is shown inFig. 1.
(1) Solve P2 without the additional objective terms (λ = 0, c=0) to determine the design variablesxDesP2. The necessary DER capacitiesSmaxDER,P2to fulfill the reliability and resilience constraints are saved for the next step.
(2) SolveP3 withλ=0,c=0.
(3) Check the convergence. If
g(xDesP2,xDesP3)
is small enough, go to Step 5, otherwise go to Step 4.
(4) Updateλandc[21]. SolveP2 with the latestλ,c,xDesP3. Then solveP3 with the latestλ,c,xDesP2. Go to Step 3.
(5) Find a feasible solution to the full problem by solvingP1 while constrainingxDesto be within the range of the latest xDesP2 and xDesP3. Calculate the duality gap ∆with(55)[21].
Stop if the gap is sufficiently small. Otherwise return to Step 3.
The duality gap is calculated as the relative difference between the objective function value ofP1 and the combined objectives of P2 andP3:
∆= O1−(
O2+O3−max{
CInv,P2,CInv,P3}
−max{
COp,P2,COp,P3}) O1
(55) WhereO1,O2andO3are the optimal objective function values ofP1,P2 andP3.O1is an upper bound on the optimal objective and the rest of the numerator is the lower bound. Because the sumO2+O3contains the investment and operations costs twice, the conservative lower bound in(55)is calculated by subtracting the highest investment and operations costs amongP2 andP3.
5