The Greening of Jobs
Empirical Studies on the Relationship between Environmental Sustainability and the Labor Market
Dissertation
zur Erlangung des Grades
„Doctor rerum politicarum (Dr. rer. pol.)“
vorgelegt von M a r k u s J a n s e r
bei
P r o f e s s o r D r . U w e B l i e n Lehrstuhl für Soziologie,
insbesondere Arbeitsmarkt- und Regionalforschung Fakultät Sozial- und Wirtschaftswissenschaften
Otto-Friedrich-Universität Bamberg am
5. November 2018
Mitglieder der Promotionskommission Erstbetreuer und Sprecher:
Weitere Mitglieder:
Datum der Abschlussprüfung:
Professor Dr. Uwe Blien
Otto-Friedrich-Universität Bamberg Professor Dr. Jens Horbach Hochschule Augsburg
Professor Dr. Olaf Struck
Otto-Friedrich-Universität Bamberg 08.05.2019
URN: urn:nbn:de:bvb:473-opus4-548223 DOI: https://doi.org/10.20378/irbo-54822
Acknowledgements
First of all, I would like to thank my supervisors Uwe Blien and Jens Horbach for their continuous support and helpful comments during the entire period I spent developing this dissertation. I am particularly grateful to Uwe Blien for giving me the opportunity to join his research department as a lateral entrant. I also thank Jens Horbach for co-authoring a paper that has been incorporated into this dissertation. I learnt a great deal from him and enjoyed the collaboration very much.
If Florian Lehmer and Manfred Antoni had not joined my first research project, I might not have taken up and switched to research at all. The paper resulting from that project is also a chapter of this dissertation. I am thus incredibly grateful to them for their trust and for the passion that they brought into our collaboration. I was so lucky to find colleagues in my very first project whose common values, research interests and individual strengths match so perfectly. Though never explicitly expressed, since that time Florian has been both my closest mentor and a good friend. This dissertation would not have been possible without his encouragement and our collegial exchange. So thank you so much for everything, Florian!
Furthermore, I would like to thank the entire team of the research department “Regional Labor Markets” for their constant helpfulness and cooperation. Thanks also to Joachim Möller and his “Research Group of the Director” as well as to Britta Matthes and her
“Research Group of Occupational Labor Markets” for their continuous exchange of research ideas and insights. I am also very grateful to Ulrich Wenzel for encouraging and supporting my move towards research, even in the very early stages. The IAB is a great place to work and learn. There are so many helpful colleagues in both research and service departments that it is not possible to name them individually here. However, I would like to mention just a few colleagues who have repeatedly helped me considerably through their support, feedback and discussions: Linda Borrs, Udo Brixy, Wolfgang Dauth, Katharina Dengler, Johann Eppelsheimer, Anette Haas, Peter Haller, Steffen Kaimer, Wolfgang Lorenz, Hans Ludsteck, Cerstin Rauscher, Michael Stops and Katja Wolf. I am deeply indebted to all of you and of course to all of those not mentioned by name.
No doctoral thesis can be written without a supportive private setting. Therefore, I thank Steffi so much, for her love, companion and for all the tasks she has taken on for me during this intensive time. I very much hope that I will be able to return the favor in the coming years. Many thanks also to my mother Helga and my sister Claudia for their empathy and support. Thank you also to my father Helmut, whose love and trust I can still feel today even though he passed away a long time ago. I am also very grateful to the
“Coach Club”, i.e., Reiner Dörr, David Pragst, and Markus Einsiedler for their encouragement and friendship, and to the team of Bayern2-Nachtmix and Stefan Wagner (Radio Z) who provided the soundtrack to this work throughout the years.
My biggest thanks go to my beloved sons Fabian and Jonathan for always reminding me that the most important things in life take place outside of work. Without them, I would probably never have finished this dissertation.
“One problem today is that people think protecting the environment will be so costly and so hard that they want to ignore the problem and pretend it doesn’t exist.
Humans are capable of amazing accomplishments if we set our minds to it.”
Paul Romer
American Economist, co-recipient of the 2018 Nobel Memorial Prize in Economic Sciences.
Quote at a press conference after the 2018 Nobel Memorial Prize in Economics announcement (Appelbaum 2018).
Table of contents
Table of contents ... V List of abbreviations ... VIII List of tables ... IX List of figures ... XI Abstract ... XII
1 Introduction ... 13
1.1 Motivation ... 13
1.2 Synopsis / Outline ... 14
2 Labor market relations of environmental sustainability—basic concepts and identification .... 16
2.1 Sustainability and sustainable development ... 17
2.1.1 Origin and definition ... 17
2.1.2 The three dimensions of sustainability ... 18
2.1.3 Weak vs. strong sustainability ... 21
2.1.4 Sustainable development – a multi-level framework for the political implementation of sustainability ... 24
2.2 “Green” economic paradigms aimed at environmental sustainability ... 26
2.2.1 The green economy and green growth paradigms ... 26
2.2.2 The circular economy paradigm ... 28
2.2.3 Growth-critical perspectives: the degrowth paradigm and related concepts ... 28
2.3 Key levers for a transition towards environmental sustainability ... 30
2.3.1 Eco-innovation: innovation for environmental sustainability ... 30
2.3.2 Environmental regulation ... 32
2.3.3 Green consumption—change in consumption behaviors ... 33
2.4 The labor market dimensions of sustainability ... 33
2.5 The relationships between environmental sustainability and the labor market ... 35
2.5.1 Definitions of green jobs ... 35
2.5.2 Environmental regulation, eco-innovation and the demand for labor ... 39
2.6 The green jobs framework ... 41
3 The hidden winners of renewable energy promotion: insights into sector-specific wage differentials ... 42
3.1 Introduction ... 42
3.2 Methods ... 44
3.2.1 Theoretical background and hypotheses ... 44
3.2.2 Data and sample selection ... 47
3.2.3 Estimation of the wage differential ... 52
3.3 Results and discussion ... 54
3.3.1 Characteristics of RE and non-RE establishments ... 54
3.3.2 Determinants of wage differentials between RE and non-RE establishments ... 62
3.4 Conclusions and Policy Implications ... 70
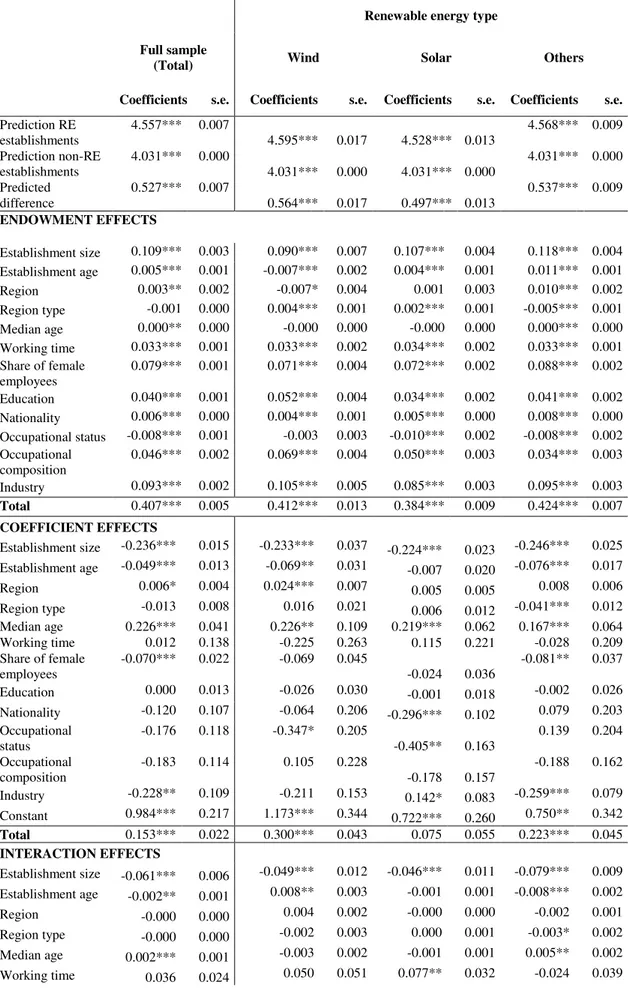
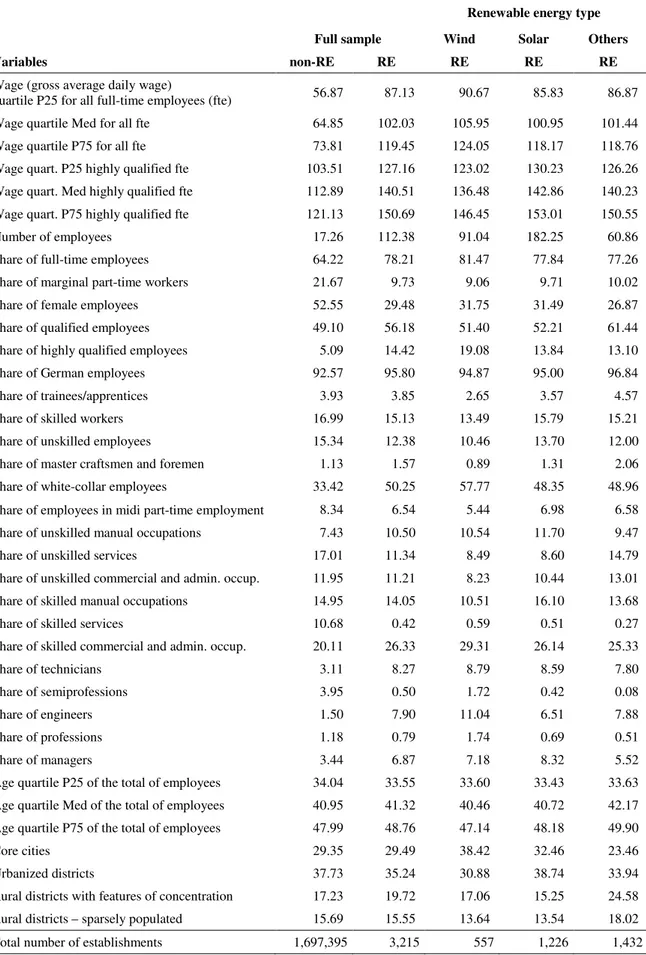
3.5 Appendix of chapter 3 ... 72
3.5.1 Appendix A.1—Sensitivity analyses ... 72
3.5.2 Appendix A.2—Tables ... 75
3.5.3 Appendix A.3—Figures ... 78
4 The role of innovation and agglomeration for employment growth in the environmental sector ... 79
4.1 Introduction ... 79
4.2 Employment development in the environmental sector: theoretical background and hypotheses 81 4.2.1 The environmental sector ... 81
4.2.2 Determinants of employment growth ... 82
4.3 Empirical analysis of employment growth in the environmental sector ... 85
4.3.1 Data ... 85
4.3.2 Descriptive analysis ... 88
4.3.3 Econometric analysis ... 91
4.4 Summary and conclusions ... 98
4.5 Appendix of chapter 4 ... 100
5 The Greenness-of-Jobs Index (GOJI): measuring the greening of jobs by a text-mining based index and employment statistics data... 103
5.1 Introduction ... 103
5.2 Data ... 104
5.2.1 Occupational BERUFENET data for basic index development ... 104
5.2.2 Statistical data to aggregate at occupational, sectoral and regional level ... 106
5.3 The Greenness-of-Jobs Index (GOJI) ... 107
5.3.1 Identification of green tasks by text mining ... 107
5.3.2 From green tasks to the weighted Greenness-of-Jobs Index GOJI ... 109
5.4 Descriptive analysis ... 115
5.4.1 The Greenness-of-Jobs Index at individual occupation level ... 115
5.4.2 The employment-weighted distribution of the greenness of jobs ... 125
5.5 Summary and conclusions ... 132
5.6 Appendix of chapter 5 ... 134
5.6.1 Appendix A.1—Text mining ... 134
5.6.2 Appendix A.2—Descriptives ... 140
6 The greening of jobs and labor market outcomes: first evidence from the GOJI and employment register data ... 155
6.1 Introduction ... 156
6.2 Literature review and conceptual framework ... 159
6.2.1 Previous descriptive findings on the greenness and greening of jobs ... 159
6.2.2 Previous analytical findings and theoretical framework ... 162
6.3 Data ... 164
6.3.1 Overview ... 164
6.3.2 Administrative micro data for econometric analyses ... 165
6.4 Econometric analysis ... 166
6.4.1 Empirical approach... 166
6.4.2 The sample for econometric analysis ... 168
6.4.3 Estimation results ... 174
6.5 Conclusions ... 177
6.6 Appendix of chapter 6 ... 178
7 Summary and conclusions ... 186
References ... 190
Erklärung ... 213
List of abbreviations
BA Bundesagentur für Arbeit (German Federal Employment Agency)
BeH Beschäftigten-Historik (Employment History: Administrative employee-microdata of the IAB), see also Antoni et al. (2016).
BHP Betriebs-Historik-Panel (Establishment History Panel: Administrative employer-microdata of the IAB), see also Gruhl et al. (2012).
BLS U.S. Bureau of Labor Statistics
BMBF Bundesministerium für Bildung und Forschung (German Federal Ministry of Education and Research)
BMU Bundesministerium für Umwelt, Naturschutz und nukleare Sicherheit (German Federal Ministry of the Environment, Nature Conservation and Nuclear Safety)
BMWI Bundesministerium für Wirtschaft und Energie (German Federal Ministry for Economic Affairs and Energy)
Cedefop European Centre for the Development of Vocational Training Destatis Statistisches Bundesamt (Federal Statistical Office of Germany) DOC United States Department of Commerce
DOL United States Department of Labor
EC European Commission
EEG Erneuerbare-Energien-Gesetz (German Renewable Energy Sources Act) EGSS Environmental Goods and Services Sector
EU European Union
Eurostat Statistical Office of the European Union
FAO Food and Agriculture Organization of the United Nations
FDZ Forschungsdatenzentrum (Research Data Center of the BA at the IAB) GIZ Deutsche Gesellschaft für Internationale Zusammenarbeit (GIZ) GmbH GOJI Greenness-of-Jobs Index
IAB Institut für Arbeitsmarktforschung der Bundesagentur für Arbeit (Institute for Employment Research of the German Federal Employment Agency)
IFAD International Fund for Agricultural Development of the United Nations IMF International Monetary Fund
KldB2010 Klassifikation der Berufe, Ausgabe 2010 (German Classification of Occupations, Edition 2010), see also BA (2015a)
OECD Organisation for Economic Co-operation and Development
RE Renewable Energy
RNE Rat für Nachhaltige Entwicklung (German Council for Sustainable Development) SCBD Secretariat of the Convention on Biological Diversity (SCBD)
SDGs Sustainable Development Goals of the United Nations’ Agenda 2030
SIAB Sample of Integrated Labor Market Biographies, see also Antoni et al. (2006).
UBA Umweltbundesamt (German Federal Environmental Agency) UCLG United Cities and Local Governments
UN United Nations
UNEP United Nations Environment Programme
UNESCAP United Nations Economic and Social Commission for Asia and the Pacific UNICEF United Nations International Children's Emergency Fund
WFP World Food Programme
WHO World Health Organization
WZ 2008 Klassifikation der Wirtschaftszweige, Ausgabe 2008 (German Classification of Economic Activities, Edition 2008), see also Destatis (2008)
List of tables
Table 2-1: The Sustainable Development Goals (SDGs) of the United Nations ... 24
Table 3-1: Number of renewable energy observations in 2009 ... 51
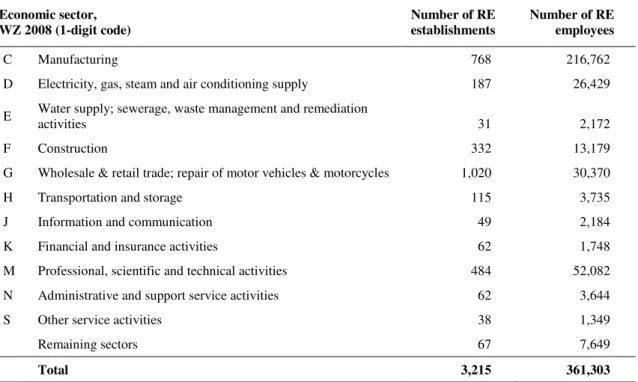
Table 3-2: Full-sample of RE establishments and RE employees in 2009 by economic sectors, WZ 2008 (1-digit level) ... 51
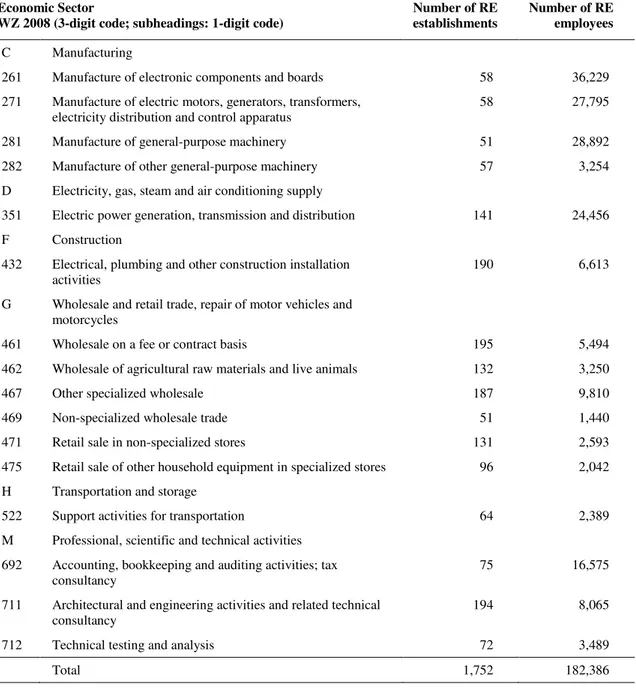
Table 3-3: Extract from full-sample of RE establishments and RE employees in 2009 by economic sectors, WZ 2008 (3-digit level) ... 52
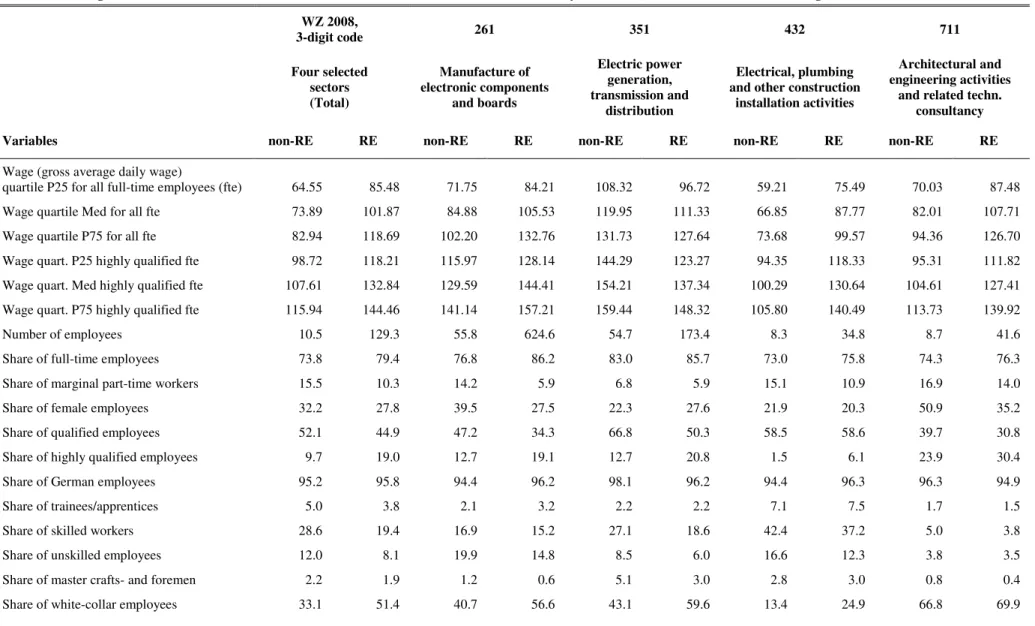
Table 3-4: Average characteristics of RE establishments and non-RE establishments in the year 2009 (four selected sectors at 3-digit level) ... 57
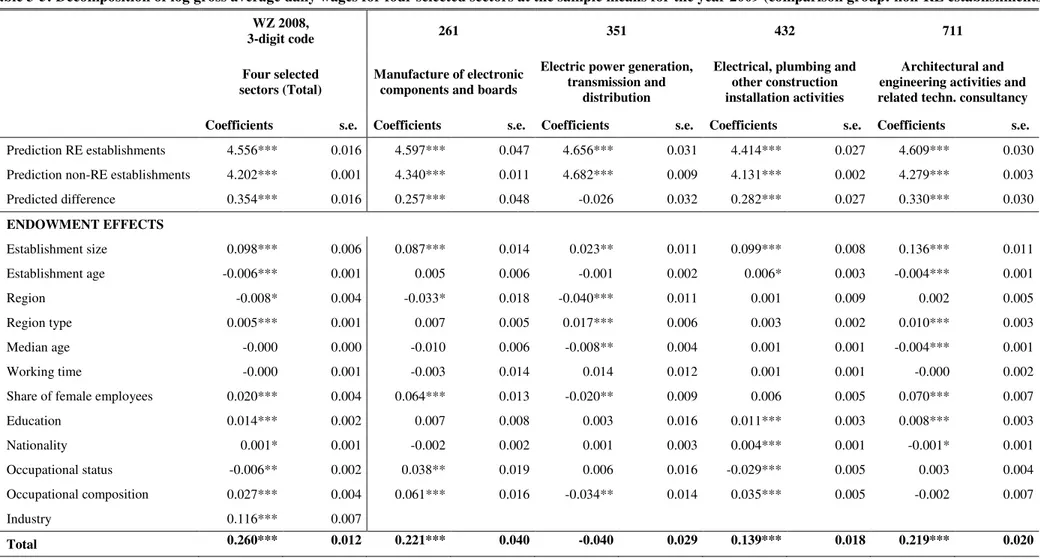
Table 3-5: Decomposition of log gross average daily wages for four selected sectors at the sample means for the year 2009 (comparison group: non-RE establishments) ... 59
Table 3-6: Decomposition of log gross average daily wages for the full sample at sample means (comparison group: non-RE establishments) by RE type for the year 2009 ... 66
Table 3-7: Decomposition of log gross average daily wages for selected sectors at the sample means (comparison group: non-RE establishments) for the year 2009; selection criterion: sectors with the highest number of RE establishments ... 67
Table 3-8: Extract from full-sample of RE establishments and RE employees in 2009 by economic sectors, WZ 2008 (2-digit level) ... 75
Table 3-9: Average characteristics of RE establishments and non-RE establishments in the year 2009 (full sample / sectors) ... 76
Table 3-10: Decomposition of log gross average daily wages for selected RE sectors at the sample means (comparison group: non-RE establishments) for 2009 (2-digit level); selection criterion: sectors with the highest number of RE establishments ... 77
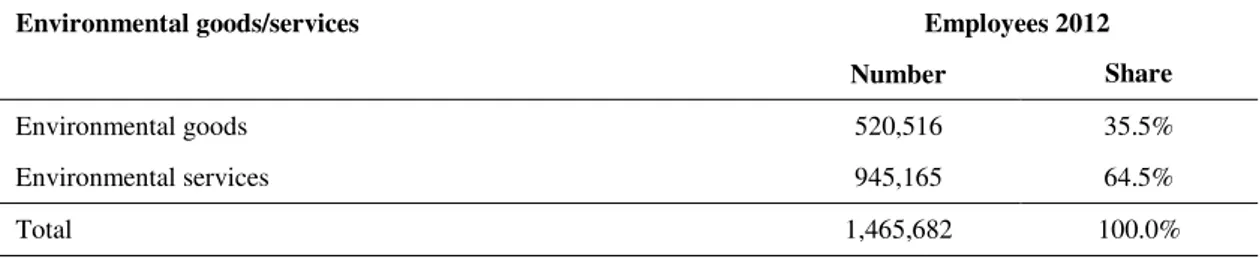
Table 4-1: Employment in the environmental sector in 2012 – number of employees ... 88
Table 4-2: Employment in the environmental sector by different subfields ... 88
Table 4-3: Employment growth from 2009 to 2012 by different subfields compared to non-environmental establishments ... 89
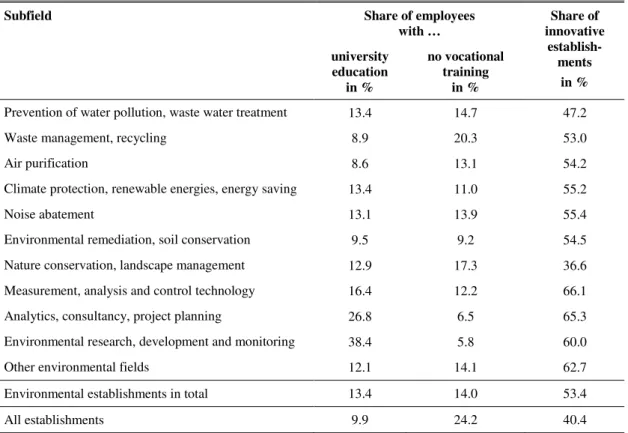
Table 4-4:Qualification level of employees and innovativeness in the German environmental sector in 2011 ... 90
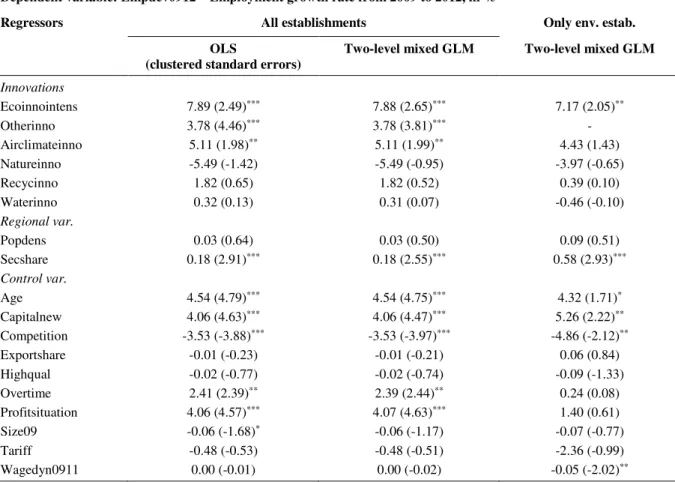
Table 4-5: Determinants of employment growth from 2009 to 2012 ... 93
Table 4-6: Determinants of employment growth from 2011 to 2012 and from 2011 to 2014 ... 94
Table 4-7: Eco-innovation and employment growth from 2009 to 2012 – results of treatment effects models ... 95
Table 4-8: Determinants of employment growth from 2002 to 2012 ... 97
Table 4-9: Descriptive statistics and definitions of the variables ... 100
Table 5-1: GOJI aggregation levels ... 106
Table 5-2: List of keyword categories ... 108
Table 5-3: Example of (unweighted) GOJI: Occupation ‘chimney sweep’ (c.s.) 2016 ... 112
Table 5-4: Aggregation to occupational-type-level (KldB 2010, from 8- to 5-digit level): Example of ‘Occupations in renewable energy technology—complex tasks’ 2014 ... 113
Table 5-5: Aggregation from 8digit to 5digit level: Example of GOJI weighted by employment: Occupation ‘chimney sweep’ ... 114
Table 5-6: Quantity structure of occupations-requirements matrices derived from BERUFENET ... 116
Table 5-7: Frequency table of matches from keywords to green tasks and occupations, 2012/ 2016— differentiating green tasks categories ... 117
Table 5-8: Greenness of jobs: ranking of individual occupations by GOJItotal: Top 5/Medium 5/Last 5
GOJItotal values in 2016 (Kldb2010, 8-digit) ... 120
Table 5-9: Greenness-of-jobs ranking of single occupations grouped by green tasks categories: Examples for top 5 of GOJIgtcat,total values in 2016 (Kldb2010, 8-digit) ... 121
Table 5-10: Greening of jobs: ranking of individual occupations by GOJI— Top/Medium/Last 5 of ∆ GOJItotal 2012-2016 (Kldb2010, 8-digit) ... 122
Table 5-11: Average GOJI values of individual occupations (8-digit level)—a) all occupations and b) GOJI occupations only (with GOJItotal > 0), 2012-2016 ... 124
Table 5-12: The hierarchical structure of the classification of occupations 2010 (KldB 2010) and their number of aggregates with GOJI > 0 ... 125
Table 5-13: Occupational sectors and their greenness of jobs 2012-2016 ... 126
Table 5-14: The employment-weighted GOJI of occupational segments 2012-2016 ... 127
Table 5-15: Employment-weighted GOJI grouped by requirement level ... 128
Table 5-16: The employment-weighted overall GOJI.de (KldB 2010) 2012-2016 ... 128
Table 5-17: Industry sections and their employment-weighted Greenness-of-Jobs Index (ISIC Rev. 4 / WZ 2008, 1-digit level), 2012-2016 ... 129
Table 5-18: Frequency table of matches from keywords to requirements 2006, 2011-2016 ... 136
Table 5-19: Frequency table of matches from green tasks to occupations 2006, 2011-2016 ... 136
Table 5-20: Number of single occupations with GOJI > 0 (2012-2016, 8-digit level KldB2010) ... 140
Table 5-21: Average GOJI values of single occupations (8-digit level)— a) all occupations and b) GOJI occupations only (with GOJItotal > 0) (2012-2016) ... 140
Table 5-22: The employment-weighted overall GOJI.de (KldB 2010) 2012-2016 ... 141
Table 5-23: Occupational areas and their greenness of jobs (1-digit level of KldB2010, 2012-2016) .... 141
Table 5-24: Occupational main groups and their greenness of jobs (2-digit level of KldB2010, 2012-2016) ... 142
Table 5-25: Occupational groups and their greenness of jobs (3-digit level of KldB2010, 2012-2016) . 143 Table 5-26: Greenness index grouped by a combination of occupational main group and requirements level (in percent, weighted) ... - 149 -
Table 6-1: Sample groups—Number of occupations with GOJItotal = 0 (Non-green) or GOJItotal > 0 (Green) in 2012 ... 169
Table 6-2: Sample description: sample size, number of employees, and sample means ... 172
Table 6-3: GOJI and employment growth: Estimation results ... 175
Table 6-4: GOJI and wage growth: Estimation results ... 176
Table 6-5: Extension for sample description: Sectoral composition and regional composition of non-green occupations and green occupations 2012 and 2016 ... 178
Table 6-6: GOJI and employment growth: Full estimation results ... 180
Table 6-7: GOJI and wage growth: Full estimation results ... 183
List of figures
Figure 2-1: Aggregates of economic and environmental capital ... 20
Figure 2-2: The framework: research dimensions and labor market outcomes ... 41
Figure 3-1: RE share in Germany’s gross final energy consumption ... 78
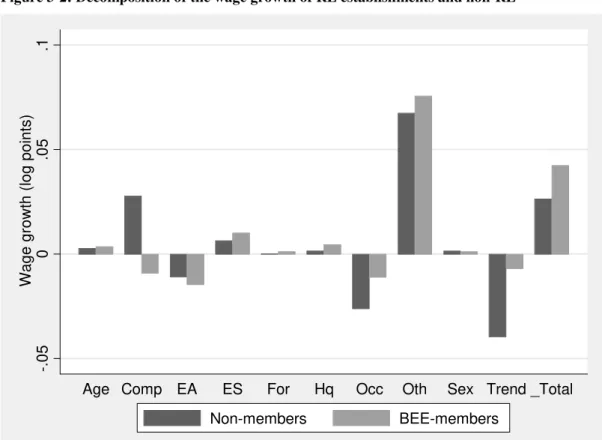
Figure 3-2: Decomposition of the wage growth of RE establishments and non-RE ... 78
Figure 4-1: Data sources ... 86
Figure 5-1: Number of green tasks and occupations in BERUFENET 2012-2016 ... 118
Figure 5-2: Green-task occupations 2012-2016, grouped by green task categories ... 119
Figure 5-3: Average GOJI of occupations (2012-2016, 8-digit level KldB2010) ... 122
Figure 5-4: Number of occupations with GOJI > 0 (8-digit level KldB2010) ... 123
Figure 5-5: Share of occupations (8-digit level) with GOJItotal > 0 in 2012 and 2016 ... 124
Figure 5-6: GOJIcore2014 at federal state level (NUTS 1), weighted by employment ... 131
Figure 5-7: GOJIcore 2014 at county level (NUTS 3), weighted by employment ... 131
Figure 5-8: Word cloud 2016 (detailed view, including all keyword matches) ... 137
Figure 5-9: Word clouds 2006 and 2012-2106 (time series) ... 138
Figure 5-10: Word clouds 2016 (grouped by green tasks categories) ... 139
Figure 6-1: The project dataset ... 165
Abstract
Along the debate about necessary actions for environmental and climate protection, there is an ongoing discussion whether this transition towards environmental sustainability is linked to negative or positive labor market outcomes. So far, however, most studies on the relationship between environmental sustainability and the labor market have used either aggregated statistical data or only survey data. For in-depth analyses, there is a lack of appropriate microdata. This doctoral thesis presents different approaches to fill this gap by introducing new methods to identify green jobs or the greenness of jobs in administrative microdata. Based on innovative data sources, I contribute new insights on the associations between environmental protection and direct labor market outcomes.
Besides a comprehensive literature review and the conceptual framework, the thesis presents four empirical studies, examining sector-specific wage differentials in renewable energy value chains, the role of innovation and agglomeration for employment growth in the environmental sector, the measurement of the greenness and greening of jobs, and the labor market outcomes linked to the greenness and greening of jobs. The studies are based on German administrative employment data at micro-level, survey data of the IAB Establishment panel and text-mining results. The empirical strategies applied prove their usefulness to identify and analyze the associations between environmental sustainability and the labor market.
1 Introduction
1.1 MotivationToday’s global community is facing a number of serious environmental problems, such as anthropogenic climate change (Stern 2008; IPCC 2014; Dunlap/Brulle 2015; IPCC 2018), regional food and water crises (FAO et al. 2018; UNICEF et al. 2018; FAO et al.
2017; Wheeler/Braun 2013), loss of biodiversity and shortages of natural resources (SCBD2014). To mitigate these problems, national and international institutions have launched manifold initiatives and programs with more or less binding goals.
In recent decades, most of these approaches have been discussed together under the common normative concept of “sustainability” or, to be more precise, “environmental sustainability”. Several practical approaches have been developed to implement the principles of sustainability in the economic context. The most prominent examples are the concepts of the green economy, the green growth, and the circular economy. At the same time growth-critical concepts such as the degrowth paradigm have emerged. The approaches differ, in some cases quite considerably, with regard to their values and agendas, but they share the common vision of establishing a low-carbon economy that is environment-friendly and conserves the natural resources for future generations.
One of the most prominent aspects of these transitions towards environmental sustainability and a “greener” economy is their current and future impact on employment and occupations. For example, the International Labor Organization (ILO) estimates that the transition to a greener economy affects about 1.5 billion people, i.e., half of the global workforce (ILO 2012). So-called “green jobs” play a crucial role in this debate. They are expected to help solving current environmental problems and mitigate climate change while – depending on the precise definition of green jobs – increasing international competitiveness and creating decent jobs. Current research also addresses these phenomena (e.g., Consoli et al. 2016; Gagliardi et al. 2016; Cecere/Mazzanti 2017;
Horbach/Jacob 2018; Vona et al. 2018; Bowen/Kuralbayeva 2018). Yet, the underlying subject is not new at all: since the 1970s many papers have been published about the relationship between environmental protection and the labor market (e.g., Paelinck 1976;
Sprenger/Britschkat 1979; Meißner 1979; Kabelitz 1980).
Despite decades of work on this research topic, there are still major gaps with regard to the relationships between environmental sustainability and the labor market. There is an ongoing scientific debate about whether environmental protection, especially when supported by statutory regulation, is linked to negative or positive labor market outcomes in terms of employment and wages.
Closely linked to this question is the methodological question of how environmental protection activities and related actors or occupational changes can be identified in administrative labor market data. A particular challenge is that the relevant actors in the
“environmental goods and services sector” (EGSS) or—even more broadly—the "green
economy" cannot be identified directly in statistical classifications. Due to their cross- sectional nature, they cannot be directly assigned to individual economic activities or occupational classes. For example, ball bearing manufacturers can sell their goods for the construction of both wind turbines and fossil fuel power plants. Or, to give an example in the occupational context, chimney sweeps now perform numerous environmental protection tasks in addition to classic chimney-sweeping and fire-protection tasks. It is even more difficult to measure the level and growth of “greenness” of jobs over time.
1.2 Synopsis / Outline
To tackle these challenges, the thesis contributes new empirical evidence to the discussion about the associations of environmental sustainability and the labor market. As a prerequisite for this, the thesis also explores innovative approaches to identify the transitions towards environmental sustainability in administrative labor market data.
The two key questions of this thesis are: What are the associations between transitions towards environmental sustainability and labor market outcomes and, how can these transitions be identified in administrative labor market data? To answer these questions, I start with a bird’s eye view, providing a detailed literature review, followed by four essays addressing exemplary subjects in the context of the associations between environmental sustainability and the labor market. In the first essay, I start with only one but very essential subfield of the EGSS, the renewable energies, focusing on sector- specific wage differentials. The second essay covers the entire EGSS, analyzing the role of innovation and agglomeration for employment growth in the EGSS. The third and fourth essay deal with the economy as a whole and examine the greening of occupations and its relationships to employment and wages. The data sources used vary widely, ranging from administrative labor market data from the German Establishment History Panel and the German Employment History, to survey data from the IAB Establishment Panel and text mining results derived from the occupational expert database BERUFENET. Within these studies, I present three different approaches, all of which facilitate the identification of environment-related establishments and occupations in administrative labor market data: the data-linkage with external firm-level data (chapter 3), the analysis of EGSS-specific survey data (chapter 4), and the development of the text- mining based Greenness-of-Jobs Index (GOJI) (chapters 5 and 6).
The four chapters can be outlined as follows:
The hidden winners of renewable energy promotion: insights into sector-specific wage differentials
In the context of Germany’s energy turnaround efforts, this chapter examines differences between renewable energy establishments and their sector peers in terms of their employment structures and wage differentials. The chapter is based on an article that was written together with Manfred Antoni and Florian Lehmer, in which my co-authors and I answer the following research questions: do wages differ between renewable energy (RE)
establishments and others? If so, what are the determinants of these wage differentials and how do they differ between sectors? Do these wage differentials merely reflect differences in establishment characteristics or do they reflect other external influences, such as the promotion of RE sources? To tackle these questions, we developed a novel data set by linking company-level information from the German Renewable Energy Federation with administrative establishment-level data from the Institute for Employment Research. The descriptive evidence shows significant differences between renewable energy establishments and their sector peers with regard to wages and several other characteristics. Our estimates provide evidence that the wage differential between manufacturers and energy providers is mainly explained by human capital and other establishment-level characteristics. However, we find a persistent “renewable energy wage premium” of more than ten percent in construction/installation activities and architectural/engineering services. We interpret this premium as a positive indirect effect of the promotion of renewable energies that benefits employees in renewable energy establishments within these two sectors.
The role of innovation and agglomeration for employment growth in the environmental sector
The environmental sector is supposed to yield a dual benefit: its goods and services are intended to tackle environmental challenges while its establishments should create new jobs. However, it is still unclear in empirical terms whether that really is the case.
Neoclassical approaches predict rather negative employment effects due to increasing costs for environmental protection activities. On the other hand, several scholars such as Porter/Van der Linde (1995) stress the potentials for establishments to improve their competitiveness—and thus their economic performance in general—due to innovation induced by environmental regulation.
In this chapter, based on an article published together with Jens Horbach, we investigate the extent to which employment growth in establishments with green products and services is higher compared to other establishments. Furthermore, we analyze the main factors determining labor demand in this field. The analysis is based on linked employment and regional data for Germany. The descriptive results show that the environmental sector is characterized by disproportionately high employment growth.
The application of a generalized linear mixed model reveals that especially innovation and industry agglomeration foster employment growth in establishments in the environmental sector. Establishments without green products and services show a smaller increase in employment, even if they are also innovative.
The Greenness-of-Jobs Index (GOJI): measuring the greening of jobs by a text mining based index and employment statistics data
The transition towards a greener, less carbon-intensive economy is supposed to lead to a greening of jobs, i.e., to an increasing percentage of environmentally friendly requirements within occupations and to a rising demand for labor in these occupations.
Thus far, to what extent the greening of occupations is occurring and how it is distributed over occupational aggregates, sectors and regions remain open questions. To measure the greening of jobs, the paper introduces the new task-based Greenness-of-Jobs Index (GOJI) and provides first descriptive statistics. I derive the GOJI by performing text- mining algorithms on yearly data from 2011 to 2016 of BERUFENET, an occupational database provided by the German Federal Employment Agency. Using employment statistics data, the descriptive results show a notable greening of jobs, which varies greatly between occupational aggregates, sectors and regions.
The greening of jobs and its labor market impacts: first evidence from a text-mining based index and employment register data
In the last years, the percentage of environmentally friendly requirements within occupations has increased considerably. In many countries, the ongoing strive towards environmental sustainability is supposed to lead to a rising demand for labor in these green or greening occupations. But is there really an increasing demand for these occupations? It is not clear yet, whether the greenness and greening of occupations affects employment and wages within these occupations. To fill this gap, the chapter analyzes the level and growth of the greenness of jobs and its relationship with employment and wage growth. The key element of this analysis is the new task-based GOJI, presented in the previous chapter. The econometric analysis is based on employment register data from 2011 to 2016. The estimation results reveal that the overall level of greenness of occupations is positively correlated with employment growth. Furthermore, the increase of greenness is related to a slight increase in wage growth.
The remainder of the thesis is organized as follows: Chapter 2 introduces the overall topic of “Environmental sustainability and the labor market” including a detailed literature overview. Chapters 3 to 5 comprise the four essays introduced above with different perspectives on the general subject: while chapter 3 examines sector-specific wage differentials in the context of renewable energy value chains, chapter 4 addresses the entire field of the environmental goods and services sector (EGSS) and analyzes the role of innovation and agglomeration for employment growth in this sector. Chapters 5 and 6 cover the economy as a whole. Chapter 5 introduces the GOJI, a new index to measure the greenness of jobs. Chapter 6 analyzes the relationships between the level and growth of the GOJI and labor market outcomes. Chapter 7 summarizes the main findings of this thesis, shows interrelationships between them and discusses possible policy implications.
2 Labor market relations of environmental sustainability—
basic concepts and identification
This chapter aims to provide an overview of the conceptual framework of the dissertation and to place the specific research topics of the subsequent chapters in the overall context.
The main questions addressed in this chapter are: What are the basic concepts that should be taken into account when analyzing the relationship between environmental
sustainability and the labor market? What approaches are currently used to measure green jobs? Consequently, this chapter does not deal with all aspects of indirect labor market effects and net employment effects. This very important topic goes beyond the scope of my dissertation. There is already a great deal of literature on this subject. See Jacob et al.
(2015) for a comprehensive literature review.
The chapter begins with an introduction to the main guiding principle of sustainability and the political framework of sustainable development. The second subsection presents major green economic paradigms aimed at environmental sustainability. An overview of the environmental challenges as well as key drivers of environmental sustainability is provided in the third subsection, while the fourth subsection discusses literature about (direct) labor market effects of environmental sustainability. The fifth subsection reviews approaches to identify and measure impacts of environmental sustainability on the labor market. The sixth and final subsection concludes with a schematic illustration connecting the conceptual framework with the empirical studies presented in the subsequent chapters.
2.1 Sustainability and sustainable development
2.1.1 Origin and definition
The notions of sustainability and sustainable development have become widely popular since their introduction in the so called “Brundtland Report” (Brundtland Commission 1987). In the light of the discussion surrounding the limits of growth and resources (e.g., Meadows et al. 1972), the Brundtland Commission defines sustainable development as
“… development that meets the needs of the present without compromising the ability of future generations to meet their own needs.” (Brundtland Commission 1987: 46). Hence, the normative basis of sustainability is the striving for justice for present and future generations (von Hauff/Kleine 2009). Whereas sustainability is the normative foundation, sustainable development deals with the strategies and policy measures necessary to achieve the desired state of sustainability.
The term "sustainability" comes from the Latin term "sustinere" (sus: up; tenere: to hold).
According to current dictionaries, the primary meaning of "to sustain" is “to support”, “to bear” or “to endure”.1 The underlying concept of sustainability is not new: it has long been used in the field of forestry. For instance, the early German adjective for sustainable,
“nachhaltend”, was already used in the context of forestry about three hundred years ago by von Carlowitz (1713: 105-106; see also Grober 2010).2 The general idea of sustainability in forestry is that there should be a balance between deforestation and
1 See also http://www.dictionary.com/browse/sustain (last accessed on Oct 31, 2018).
2 „Wird derhalben die größte Kunst/Wissenschaft/Fleiß und Einrichtung hiesiger Lande darinnen beruhen/
wie eine sothane Conservation und Anbau des Holtzes anzustellen / daß es eine continuierliche beständige und nachhaltende Nutzung gebe / weiln es eine unentberliche Sache ist / ohne welche das Land in seinem Esse nicht bleiben mag“ (Carlowitz, 1713: 105-106; marked in bold by the author).
reforestation, or, to put it simply, no more trees may be felled than have been newly planted in the same period (Grober 2010). An important achievement of the Brundtland Report was to transfer the principle of sustainable forestry sustainability to general topics of global development. (Brundtland Commission 1987).
The Brundtland Report paved the way for the UN Conference on Environment and Development in Rio de Janeiro 1992. This conference is considered historic, as it was the first time that several agreements for a global environment and development partnership were adopted under the guiding principle of sustainability. The definition of sustainable development used in the Brundtland report comprises two essential concepts of generational justice. “It [sustainable development] contains within it two key concepts:
the concept of 'needs', in particular the essential needs of the world's poor, to which overriding priority should be given; and the idea of limitations imposed by the state of technology and social organization on the environment's ability to meet present and future needs.”(Brundtland Commission 1987: 46). Both concepts are clearly anthropocentric (von Hauff/Kleine 2009). The first concept is known as intragenerational justice, i.e., striving for a more equal distribution of material and immaterial resources and development opportunities within and between nations (Glotzbach/Baumgärtner 2012;
Baumgärtner/Quaas 2010; Barry 1997; Brundtland Commission 1987). The second concept is referred to as intergenerational justice, i.e., conserving natural and/or human- made capital to facilitate the fulfilment of needs of future generations (Solow 1974;
Hartwick 1977, 1978a, 1978b; Solow 1986).
2.1.2 The three dimensions of sustainability Pillars vs. dimensions
Since the Brundtland Report was published, the scope of sustainable development has become more and more differentiated. Whereas the initial report focused mostly on sustainability in general (Brundtland Commission 1987), the follow-up documents often refer to three or more dimensions of sustainability. The most commonly used distinction in terms of the dimensions of sustainability is that based on the three-pillar principle comprising environmental, economic and social sustainability. (e.g., Enquete- Kommission 1998; Barbier 1987). Some authors criticize the term “pillar” as evoking a too rigid image of topics that cannot relate to each other. This might be a reason why the word “pillar” is replaced by “dimension” in several publications (e.g., Krajnc/Glavič 2005; Labuschagne et al 2005; Singh et al 2012). In the remainder of this dissertation I use the notion of “dimensions of sustainability”, because I would like to emphasize the potential overlaps within the concept of sustainability.
Equal priorities vs. primacy of environmental sustainability
In contrast to the basic concept of three dimensions with equal priority, the ecologically dominated concept distinctly emphasizes the environmental dimension of sustainability.
Proponents of this approach argue that ecosystems are the basis of life and economic
activity and thus play an overriding role. In this sense, economic and social sustainability are based on environmental sustainability and must be subordinated in cases of conflicting interests (von Hauff/Kleine 2009).
Excursus: Ecological, economic and social capital in the context of sustainability I follow the approach of von Hauff/Kleine (2009) and use the capital-based distinction to explain the three dimensions of sustainability. The following sections shed some light on these three dimensions and also examine their correlations with labor and employment.
But prior to that, I present a short excursus on the relationship between sustainability and capital, which is an important distinction when defining the dimensions of sustainability.
Hediger (2000) introduces a welfare function that integrates “principles of basic human needs (‘critical economic capital’), integrity of the ecosystem (‘critical ecological capital’) and the socio-cultural system (‘critical social capital’)” and describes the restrictions of the social opportunity space in which sustainable development can be achieved. He uses the adjective “critical” as the minimum level of cohesion beyond which the economic, ecological or social system is at risk of collapsing.
In the context of sustainability, Hediger (2000: 485) defines social welfare U “as an increasing function of aggregate income Y, macroeconomic stability M, social capital S, and ecological capital Q (footnote: UY and UYY etc. denote the first-order and second- order derivatives of U with respect to Y, etc.)”:
Socio-ecological-economic value function according to Hediger (2000):
U = UY, M, S, Q with U, U, U, U > 0,U, U, U, U≤ 0 (2.1) According to the sustainability-related literature (Hediger 2000; von Hauff/Kleine 2009), social capital comprises health, literacy, life expectancy, cultural and social integrity, and social cohesion. These features are in line with current publications from political science, which call for a social capital approach that aims to satisfy basic needs, to promote social integration and to facilitate the further development of society (von Hauff/Kleine 2009, Empacher/Wehling 2002).
Ecological capital—or ecosystem capital—comprises “the total of renewable resource stocks (both used and non-used in economic production), semi-natural and natural land areas, as well as ecological factors, such as nutrient cycles, climatic conditions, and the resilience of ecosystems. This is the part of natural capital which determines the overall quality of the ecosystem.” (Hediger 2000: 483). This notion is closely related to natural capital (or environmental capital) which the author defines as “the natural resource base of a geographic area. It consists of the ecological capital and stocks of non-renewable resources” (Hediger 2000: 483). As Figure 2-1 shows, Hediger (1999: 1124) also includes the land use of built area (human living space) as an element of natural / environmental capital.
Furthermore, Hediger (2000: 483) defines economic capital as “as an economy’s generalized productive capacity; that is, the potential to generate income. It consists of
manufactured capital (machines and buildings), immaterial assets (knowledge and knowhow, social organization, institutions, and the state of technology), and natural resources (including non-renewable resources, renewable resources, and land) that are harvested or developed for use in economic transformation processes. Correspondingly, economic capital does not include ecological assets that are not directly used, but that are essential for the functioning of the ecosystem.”
In the following figure, Hediger (1999: 1124) illustrates the aggregates of economic and environmental capital:
Figure 2-1: Aggregates of economic and environmental capital
Source: Hediger (1999: 1124; Part of Figure 1)
Environmental sustainability
According to von Hauff/Kleine (2009), ecological sustainability aims to preserve the ecological system, or the ecological capital stock, as the basis of human life.
The authors use the notion of ecological sustainability and consequently refer to the definition of ecological capital as formulated by Hediger (1999). In the literature, environmental sustainability and ecological sustainability are mostly treated as synonyms in the literature. Transferring the approaches of Hediger (1999, 2000) and Hauff/Kleine (2009) to the field of environmental capital and environmental sustainability, yields the following definition of environmental sustainability, which I use for the remainder of this work:
Environmental sustainability aims to preserve the natural resource base of a geographic area, including the ecological capital and stocks of non-renewable resources and the land use of built area (human living space) (von Hauff/Kleine 2009; Hediger 1999, 2000: 483, 1124).
2.1.3 Weak vs. strong sustainability
To define sustainability properly, another important distinction has to be drawn: the distinction between weak and strong sustainability. In the academic fields of neoclassical environmental economics and ecological economics, there is a long-standing controversy about weak versus strong sustainability.
The concept of “weak sustainability” assumes that non-renewable natural capital and human-made capital is fully substitutable. In the sense of this definition, an economy fulfils the requirements of (weak) sustainability as long as it replaces the non-renewable resources it has consumed with man-made capital, such as buildings, roads, etc. (von Hauff/Kleine 2009; Neumayer 2003). This paradigm is mainly based on the neoclassical growth theory, particularly on the works of Solow (1974, 1986, 1993) and Hartwick (1977, 1978a, 1978b). The concept of “strong sustainability”, on the other hand, assumes that the types of capital are complimentary to each other. Accordingly, an economy fulfils the requirements of (strong) sustainability if each type of capital increases or does not decrease, respectively. The focus here is in particular on (non-renewable) ecological capital (von Hauff/Kleine 2009; Neumayer 2003). Neumayer therefore also refers to weak sustainability as a "substitutability paradigm" (2003: 1) and strong sustainability as a
"non-substitutability paradigm" (Neumayer, reference as before).
The neoclassical, utility-oriented concept of weak sustainability was significantly shaped at the Symposium on the Economics of Exhaustible Resources (e.g., Heal 1974;
Dasgupta/Heal 1974). In this context, the social welfare function was transferred to exhaustible resources. Therefore, theories of weak sustainability are mainly based on the social welfare function as introduced by Bergson (1938) and further developed by Samuelson (1947). In its basic form the social welfare function represents welfare (to be maximized) as the sum of all individual benefits , weighted by :
Max! = ∑ ∗
Transferred to the case of the consumption of exhaustible resources and intergenerational justice, von Hauff/Kleine (2009) summarize the resulting model as follows:
= ×∗
where W is welfare, Ct is the consumption of generation t and ∑ × is the discounting term for the weighting of time-shifted benefits. In this context, consumption is treated as the utility of a generation:
= ,
where U is utility, and consumption Ct is the function of (human-made) capital K and (natural) resources R.
One of the main decisive questions between the concepts of weak and strong sustainability is, as to how substitutable different types of capital (e.g., human-made capital) and natural resources are. In the context of weak sustainability, Dasgupta/Heal (1974) state the following equation to estimate the optimal level of consumption from the total discounted benefit for all generations:
! ∑ ×∗ ∗ − ; , ∈ 0%, 100%; + = 100%
∗ − = ,
where ∑ × is the discounting term and is the Ct represents the consumption possibilities of generation t, which consist of (human made) capital K and natural ressources R, reduced by stock reduction .
The equation is based on a standard Cobb-Douglas production function which assumes a full substitutability with a fixed substitution relationship and is thus a special case of a CES (Constant Elasticity of Substitution) production function, which was initally introduced by (Solow 1956). This assumption of the extent to which (human-made) capital and natural resources are substitutable is one of the main differences between the concepts of weak and strong sustainability.
Georgescu-Roegen (1971, 1986) critizes Solow’s concept of full substitutability as
“viewing the economic process not as a thermodynamic transformation, but as a mechanical system. Indeed, in a mechanical system absolutely nothing happens besides changes of place, which is not the essence of economic life” (Georgescu-Roegen 1986:
11). Solow himself stated, “… it takes economics as well as the entropy law” (Solow 1974:11) to look at the economic process. However, Georgescu-Roegen (1986) argues that Solow does not apply this insight in his works, because he bases essential parts of his work on the view that production factors such as labor and reproducible capital can fully substitute natural resources (Solow 1974). Referring to the laws of thermodynamics, Georgescu-Roegen (1986: 12) answers, “capital cannot be reproduced without an additional supply of natural resources.” Applying thermodynamics principles to resource economics rather corresponds to the principles of strong sustainability (e.g., Berry et al.
1978; Bryant 1982; Young 1991; Daly 1992; Binswanger 1993; Sollner 1997; Krysiak 2006). One possible limitation of the entropy concept is the strong assumption of the world as an “isolated system”. For example, one could argue that technologies of solar energy might enable the world population to go beyond the limits of the earth as a closed system.
Von Hauff/Kleine (2009) explain this difference by the elasticity σ of substitution between human-made capital and natural resources: weak sustainability assumes an elasticity of substitution σ = 1, whereas strong sustainability questions the substitutability of human-made capital and natural capital in principle and assumes an elasticity of substitution σ = 0. In the case of σ = 1, Hartwick (1977) uses a Cobb-Douglas production function to show that declining natural resources can be substituted if there is a
sufficiently rapid accumulation of human-made capital and if the partial production elasticity of human-made capital in relation to natural capital is stronger. However, cases have been documented, in which the elasticity of substitution is σ < 1 (e.g., Markandya/Pedroso-Galinato 2006) or where the model of full substitution fails in real life (e.g., the example of phosphate mining on Nauru Island, documented by Gowdy/Mc Daniel 1999). The proponents of strong sustainability favor the concept of complementarity instead of substitutability. Daly underpins the concept of complementarity with some illustrative examples: “The complementarity of manmade and natural capital is made obvious at a concrete and commonsense level by asking: what good is a saw-mill without a forest; a fishing boat without populations of fish; a refinery without petroleum deposits; an irrigated farm without an aquifer or river?”(Daly 1995:
51).
The concept of “weak” sustainability is rejected by the supporters of “strong”
sustainability—especially from the ecological economics community. They refer to natural scientific laws and point out that natural capital is not fully replaceable by human- made capital and thus cannot be completely represented and controlled by a price.
Representatives of strong sustainability advocate a complementary relationship between natural and physical capital (e.g., Pearce/Atkinson 1993; Gowdy/McDaniel 1999;
Rennings/Wiggering 1997; Ayres et al. 2001; Costanza et al. 2016). On the other hand, the concept of strong sustainability is criticized for being too dualistic and for mixing the concepts of substitutability and complementarity (Beckerman 1995). Another critique is the fuzzy definition of capital, because in some models production capital and labor are mixed, which restricts the analytical precision.
The discussion concerning weak and strong sustainability is still ongoing. For example, this differentiation has been used to compare green-economy concepts in terms of their impact on strong and weak sustainability (Loiseau et al. 2016). Nevertheless, some alternative approaches try to combine or balance the two controversial concepts of weak and strong sustainability (e.g., Toman 1994; Hediger 1999; see also von Hauff/Kleine 2009: 32-40).
Meadows et al. (1972), presents the limits of growth due to the limitations of natural resources and thus challenges the substitutability paradigm of weak sustainability.
However, Stiglitz states three factors that Meadows et al. do not properly take into account: “technical change, the substitution of man-made factors of production (capital) for natural resources, and returns to scale” (Stiglitz 1974: 123). Stiglitz concludes that these factors enable future generations to have at least the same level of utility as current generations.3 The role of technological change can be related to the theory expounded by
3 This view does not necessarily contradict the approval of economic approaches concerning climate policy.
At least Stiglitz writes in a recent article (2016: 45): “Imposing a carbon price, reflecting the social cost of emissions, would significantly stimulate investment. To ensure a level playing field, we might have to
Grossman/Helpman (1994), who introduce a model of long-term growth which is based on endogenous technological progress. In line with Romer (1990), they develop a formal model that presents industrial innovation as the engine of endogenous growth, which is seen as one approach to combine economic growth with environmental sustainability (Bovenberg/Smulders 1995; Smulders 1995; Pittel 2002; Smulders/De Nooij 2003).
2.1.4 Sustainable development – a multi-level framework for the political implementation of sustainability
Since the 1990s, the notion of “sustainable development” has covered the policy making and implementation processes of sustainability principles. Sustainable development has evolved into a multi-level framework for the policy implementation of sustainability.
From a German perspective, one can mainly differentiate between sustainable development processes at international, European, national and regional level.
International level (the global framework)
As a consequence of the report entitled “Our Common Future” by the Brundtland Commission (1987) and the United Nations Conference on Environment and Development ("Earth Summit") in Rio de Janeiro in 1992, the UN General Assembly established the United Nations Commission on Sustainable Development (CSD) in 1992.
The aim of this commission was to implement principles of sustainability worldwide.
Twenty years later, it was replaced by a high-level political forum in 2013, which developed and prepared the so called "2030 Agenda for Sustainable Development"
(hereafter the "2030 Agenda”). The main aim of the Agenda is to provide everyone with ecologically compatible, socially just and economically fair living conditions by 2030.
The agenda was adopted by the United Nations General Assembly in 2015 as the follow- up to the Millennium Development Goals (UNSD 2008). In contrast to its predecessors, the global sustainability agenda applies equally to industrialized and developing countries. The 2030 Agenda comprises 17 Sustainable Development Goals (SDGs), operationalized in 169 specific targets (UN 2015). As a further operationalization, the UN defined 232 indicators that are linked to the SDGs and targets and are continuously refined (UN 2017, 2018). Table 2-1 provides an overview of the 17 SDGs.
Table 2-1: The Sustainable Development Goals (SDGs) of the United Nations SDG 1: End poverty in all its forms everywhere
SDG 2: End hunger, achieve food security and improved nutrition and promote sustainable agriculture SDG 3: Ensure healthy lives and promote well-being for all at all ages
SDG 4: Ensure inclusive and equitable quality education and promote lifelong learning opportunities for all SDG 5: Achieve gender equality and empower all women and girls
SDG 6: Ensure availability and sustainable management of water and sanitation for all
impose cross-border adjustments. A carbon tax would simultaneously raise substantial revenues needed to finance the public investments described elsewhere in this paper.”
SDG 7: Ensure access to affordable, reliable, sustainable and modern energy for all
SDG 8: Promote sustained, inclusive and sustainable economic growth, full and productive employment and decent work for all
SDG 9: Build resilient infrastructure, promote inclusive and sustainable industrialization and foster innovation
SDG 10: Reduce inequality within and among countries
SDG 11: Make cities and human settlements inclusive, safe, resilient and sustainable SDG 12: Ensure sustainable consumption and production patterns
SDG 13: Take urgent action to combat climate change and its impacts*
SDG 14: Conserve and sustainably use the oceans, seas and marine resources for sustainable development SDG 15: Protect, restore and promote sustainable use of terrestrial ecosystems, sustainably manage forests,
combat desertification, and halt and reverse land degradation and halt biodiversity loss
SDG 16: Promote peaceful and inclusive societies for sustainable development, provide access to justice for all and build effective, accountable and inclusive institutions at all levels
SDG 17: Strengthen the means of implementation and revitalize the global partnership for sustainable development
Source: UN (2015, 2018)
The broad range is both a strength and a weakness of this approach. On the one hand, it covers all three pillars of sustainability, but on the other hand the interaction between goals introduces a complexity that is difficult to handle. Nilsson et al. 2016 provide an example of this, pointing out that “…using coal to improve energy access (goal 7) in Asian nations, say, would accelerate climate change and acidify the oceans (undermining goals 13 and 14), as well as exacerbating other problems such as damage to health from air pollution (disrupting goal 3)” (Nilsson et al. 2016: 320). The authors recommend mapping the interactions between the SDGs by rating these relationships to make them visible for policy-making decisions.
European level
In the context of the Treaty of Amsterdam in 1997, sustainable development was included for the first time as an overarching objective of European Union policy. In the following years, it was integrated into EU policy, inter alia through the EU Sustainable Development Strategy (EC 2001) and the Europe 2020 Strategy (EC 2010).
In 2016 the European Commission released a communication (EC 2016a) describing the implementation of the SDGs in the target system of the European Union, the EU 2020 strategy and the 10 commission priorities for 2015-2019. Eurostat (2016a) subsequently took up this communication and published an implementation concept to integrate the SDGs into the Sustainable Development monitoring process of the European Union and to link them with existing targets set out in the Europe 2020 strategy. Since 2017, Eurostat has published an annual EU SDG Monitoring Report (e.g., Eurostat 2016b, 2018a/b).
Furthermore, the SDGs are also covered in the monitoring report regarding the Europe 2020 strategy (e.g., Eurostat 2018c).
National level – The case of Germany
The German government first adopted a national sustainability strategy in 2002, which was updated several times in the following years. The largest adjustment was made in 2016/2017, when the government aligned the German sustainable development strategy with the SDGs of the UN Agenda 2030 (German Federal Government 2017).
Consequently, the indicator set for monitoring sustainable development in Germany was revised, too (Destatis 2017). Every country has to report on a regular basis about the state of the SDG implementation at national level. For example, Germany reported in 2016 and will report again in 2021 (RNE 2017). The German Council for Sustainable Development (Rat für Nachhaltige Entwicklung, RNE) is an advisory board of the German government and plays an important role in the processes of developing, discussing and evaluating the German sustainable development strategy. The RNE was established in 2001. Its 15 members are appointed by the German chancellor for three years, whereby a reappointment is possible (RNE 2018).
Regional level
Since the beginning of the discussion about sustainable development, the regional level has played a major role, because the implementation of real sustainable behavior depends mainly on the actions at local level. Initiated at the Rio conference in 1972 the bottom-up concept of local agenda 21, there was a global movement of municipalities that took up the initiative and set up local agendas 21. (Lafferty/Eckerberg 2013).
Agenda 2030, with its global framework of SDGs, also emphasizes the importance of the local level. However, the challenge of operationalizing standardized global goals at the local level seems to demand more central impulses. There are several international and national efforts to help local actors translate SDGs into their local unit (Rudd et al. 2018;
UCLG 2014; UN Habitat 2016; Nrg4SD et al. 2018; Bertelsmann Stiftung et al. 2018).
2.2 “Green” economic paradigms aimed at environmental sustainability
2.2.1 The green economy and green growth paradigms
In 2008 the concept of “green economy” was introduced at the international level as a potential solution for improving the environmental sustainability of the global economy.
The first official step was taken in October 2008 when the United Nations Environment Programme (UNEP) launched the Green Economy Initiative. The aim of this initiative was to foster investments in environmental goods and services as well as to transform conventional, “non-green” sectors into more environment-friendly business outputs and processes (UNEP 2008). Based on this initiative the UNEP published a common working definition of green economy in 2010, defining it: Green economy is defined as “…a system of economic activities related to the production, distribution and consumption of goods and services that result in improved human well-being over the long term, while