IHS Economics Series Working Paper 163
November 2004
Employment and Growth in an Aging Society: A Simulation Study for Austria
Josef Baumgartner
Helmut Hofer
Serguei Kaniovski
Ulrich Schuh
Thomas Url
Impressum Author(s):
Josef Baumgartner, Helmut Hofer, Serguei Kaniovski, Ulrich Schuh, Thomas Url Title:
Employment and Growth in an Aging Society: A Simulation Study for Austria ISSN: Unspecified
2004 Institut für Höhere Studien - Institute for Advanced Studies (IHS) Josefstädter Straße 39, A-1080 Wien
E-Mail: o ce@ihs.ac.at ffi Web: ww w .ihs.ac. a t
All IHS Working Papers are available online: http://irihs. ihs. ac.at/view/ihs_series/
This paper is available for download without charge at:
https://irihs.ihs.ac.at/id/eprint/1602/
163 Reihe Ökonomie Economics Series
Employment and Growth in an Aging Society:
A Simulation Study for Austria
Josef Baumgartner, Helmut Hofer, Serguei Kaniovski,
Ulrich Schuh, Thomas Url
163 Reihe Ökonomie Economics Series
Employment and Growth in an Aging Society
A Simulation Study for Austria
Josef Baumgartner, Helmut Hofer, Serguei Kaniovski, Ulrich Schuh, Thomas Url November 2004
Institut für Höhere Studien (IHS), Wien
Institute for Advanced Studies, Vienna
Contact:
Josef Baumgartner
Austrian Institute of Economic Research (WIFO) Helmut Hofer
Department of Economics and Finance Institute for Advanced Studies (IHS) Stumpergasse 56, 1060 Vienna : +43/1/59991-251
fax: +43/1/59991-163 email: hofer@ihs.ac.at Serguei Kaniovski
Austrian Institute of Economic Research (WIFO) Ulrich Schuh
Institute for Advanced Studies (IHS) email: schuh@ihs.ac.at
Thomas Url
Austrian Institute of Economic Research (WIFO) P.O. Box 91
A-1103 Vienna, Austria : +43/1/798 26 01-279 fax: +43/1/798 93 86
email: Thomas.Url@wifo.ac.at.
Founded in 1963 by two prominent Austrians living in exile – the sociologist Paul F. Lazarsfeld and the economist Oskar Morgenstern – with the financial support from the Ford Foundation, the Austrian Federal Ministry of Education and the City of Vienna, the Institute for Advanced Studies (IHS) is the first institution for postgraduate education and research in economics and the social sciences in Austria.
The
Economics Series presents research done at the Department of Economics and Finance andaims to share “work in progress” in a timely way before formal publication. As usual, authors bear full responsibility for the content of their contributions.
Das Institut für Höhere Studien (IHS) wurde im Jahr 1963 von zwei prominenten Exilösterreichern –
dem Soziologen Paul F. Lazarsfeld und dem Ökonomen Oskar Morgenstern – mit Hilfe der Ford-
Stiftung, des Österreichischen Bundesministeriums für Unterricht und der Stadt Wien gegründet und ist
somit die erste nachuniversitäre Lehr- und Forschungsstätte für die Sozial- und Wirtschafts-
wissenschaften in Österreich. Die Reihe Ökonomie bietet Einblick in die Forschungsarbeit der
Abteilung für Ökonomie und Finanzwirtschaft und verfolgt das Ziel, abteilungsinterne
Diskussionsbeiträge einer breiteren fachinternen Öffentlichkeit zugänglich zu machen. Die inhaltliche
Verantwortung für die veröffentlichten Beiträge liegt bei den Autoren und Autorinnen.
Abstract
In this study we use a long run macroeconomic model for Austria to simulate the effects of aging on employment, output growth, and the solvency of the social security system. By disaggregating the population into six age cohorts and modelling sex specific participation rates for each cohort, we are able to account for the future demographic trends. Apart from a baseline scenario, we perform three alternative simulations that highlight the effects of aging from different perspectives. These include (1) purely demographic developments, (2) increasing labour market imperfections, and (3) higher economic growth due to a productivity shock.
Keywords
Economic growth, aging, Austria
JEL Classification
C6, E2, O4
Comments
We would like to thank Werner Roeger, Stephen Hall, Arjan Lejour, Bert Smid, Johann Stefanits, Andreas Wörgötter, Peter Part, and the participants of two modelling workshops hosted by the Institute for Advances Studies (IHS) in Vienna for helpful comments and suggestions. We are particularly indebted to Fritz Breuss and Robert Kunst for valuable discussions during the project. The responsibility for all remaining errors remains entirely with us.
The development of A-LMM has been funded by a research grant from the Austrian Federal Ministry of
Social Security, Generations and Consumer Protection (Grant GZ:21.101/74-8/02). This financial
support is gratefully acknowledged.
Contents
1. Introduction 1
2. A description of the simulation model (A-LMM) 2
3 Simulations 4
3.1 Baseline with main variant of the population projection (scenario 1)... 4
3.2 The effect of low fertility rates (scenario 2)... 5
3.3 The effect of increasing social security contribution rates (scenario 3) ... 6
3.4 A scenario with higher productivity growth (scenario 4) ... 7
4 Conclusions 8
References 10
Tables and Figures 11
– 1 –
1. Introduction
Should the current demographic trends persist, we would expect a profound change in the size and composition of the labour force in Austria. Current demographic projections foresee a decline in the working age population by 700,000 persons or 13 percent between 2002 and 2050 (Hanika et al., 2004). Actual labour supply may be somewhat less affected due to an increase in female participation rates and that of elderly males. The overall effect of the above factors on labour supply is uncertain. Its consequences for the labour market and the long-term production possibilities and economic growth for Austria are the subject of this study.
Of related interest are sustainability of social security systems and public finances. Since the beginning of the nineties, macroeconomic consequences of population aging, especially for public budgets, are a focus of research in the OECD or the IMF (see Leibfritz et al., 1995, Koch − Thiemann, 1997). In the context of the Stability and Growth Pact of the European Union, the budgetary challenges posed by aging populations are heavily debated in the European Union under the headline 'Long-term Sustainability of Public Finances' (see Economic Policy Committee, 2001, 2002, European Commission, 2001, 2002). For an Austrian perspective see Part − Stefanits (2001), Guger − Mayrhuber (2001), and Part (2002). Most of these studies rely on partial equilibrium analysis without considering possible repercussions on the main macroeconomic variables.
The presence of lagged and long lasting effects of population aging and the infeasibility of real world experiments in economics suggest the use of a long-run economic model in which the main determinants and interactions of the Austrian economy are mapped. Different scenarios for the economy could then be developed in a flexible way and set up as simulation experiments contingent on exogenous and policy variables. In Baumgartner et al. (2004) we develop a long-term dynamic growth model, A-LMM, based on the neoclassical theory with an emphasis on disaggregated labour supply and the interaction between the system of social security and the labour market. The model replicates the well-known stylised facts about growing industrialized economies discussed in Solow (2000). The steady state emerges as the result of optimizing behaviour of two types of private agents:
firms and private households and the policy rules governing the public sector.
Following this introduction we briefly discuss the model and present a baseline scenario based on the main variant of the population projection by Statistics Austria by Hanika et al. (2004). Next we discuss the consequences of lower fertility rates. Another point of interest is studying the macroeconomic effects of a balanced fiscal stance of the social security system. Here the balance is brought about by an increase in contribution rates, such that the share of government transfers to the social security system in relation to GDP remain constant. Then we study an increase in total factor productivity growth by 0.5 percentage points. The final section concludes.
– 2 –
2. A description of the simulation model (A-LMM)
A-LMM is a long-run aggregate macroeconomic model for the Austrian economy designed to analyse the macroeconomic impact of long-term issues, to develop long-term scenarios, and to perform simulation studies. The current version is documented in Baumgartner et al. (2004). The model foresees an economic horizon until the year 2070.
Firm behaviour is decisive for the properties of our model. Firms are assumed to produce goods and services using capital and labour as inputs. We use a constant returns to scale Cobb-Douglas aggregate production function with Harrod-neutral technical progress, consistent with the stylized facts of economic growth. The choice of Cobb-Douglass implies constant factor income shares. In the long run, this property cannot be rejected in a study by Englander − Gurney (1994) for the OECD countries and also approximately holds for Austria, especially after taking the labour component of the earning of the self-employed into account. This feature and the stability of Cobb-Douglass specification make it a popular choice for simulation models. The exogenous rate of technical progress is a possible source of shocks to the model.
Factor demand is derived under the assumption of profit maximisation subject to resource constraints and the production technology. Capital accumulation is based on a modified neoclassical investment function with forward looking properties. In particular, the rate of investment depends on the ratio of the market value of new additional investment goods to their replacement costs (Hayashi, 1982). This ratio (Tobin's Q) is influenced by expected future profits net of business taxes. Labour demand is derived from the first order condition of the firms' profit maximisation problem. Since it takes time for firms to adjust to their optimal workforce (Hamermesh, 1993), we assume a partial adjustment process for employment.
Private households' behaviour is derived from intertemporal utility maximisation subject to an intertemporal budget constraint. Within this set-up, decisions about consumption and savings (financial wealth accumulation) are formed in a forward looking manner. Consumption depends on discounted expected future disposable income (human wealth) and financial wealth but also on current disposable income since liquidity constraints are binding for some households.
A special characteristic of A-LMM is the focus on disaggregated labour supply. In general, the labour force can be represented as a product of the size of population and the labour market participation rate. In the model we implement highly disaggregated participation rates (by sex and by six age groups). This gives us the opportunity to account for the different behaviour of males and females (where part-time work is a major difference) and young and elderly employees. For the elderly the stepwise phasing out of early retirement opportunities imposed by the pension reform 2003 (Budgetbegleitgesetz 2003, BGBl. I No. 71/2003 and Sozialversicherungsänderungsgesetz 2003, BGBl. I Nr. 145/2003) comes into consideration. Apart from legal changes and cohort effects, endogenous labour supply depends on the difference between the actual and the reservation wage level.
– 3 –
In modelling wage determination we follow a variant of the theoretical framework of Blanchard − Katz (1999). Wage setting models imply that, given the workers' reservation wage, the tighter the labour market, the higher will be the real wage. The replacement rate of unemployment benefits is one important determinant of the reservation wage. Another determinant of the reservation wage is the utility of leisure that includes home production and earning opportunities in the informal sector. If we assume that increases in productivity in home production and in the informal sector are closely related to those in the formal sector, then the reservation wage would depend on productivity. Furthermore, the condition that technological progress does not lead to a persistent trend in unemployment implies that the reservation wage is homogeneous of degree one in the real wage and productivity in the long run.
The labour market equilibrium is characterised by a time varying natural rate of unemployment. Here we use the concept of Non-Accelerating Wage Rate of Unemployment (NAWRU). According to this concept, the long term equilibrium rate of unemployment is influenced by the productivity of labour and wage push factors such as the tax wedge and the gross replacement rate of unemployment benefits.
We use estimates of the impact of the tax wedge and the gross replacement rate on the unemployment rate reported in Nickell et al. (2002). In the baseline we assume a long run equilibrium rate of unemployment of 4.5 percent.
The public sector does not optimize social welfare. Instead, we assume a constant legal and institutional framework for the whole forecast period. For simplicity, we assume constant elasticities of public revenues with respect to the tax base. On the expenditure side, the government is constrained by the balanced budget requirement of the Stability and Growth Pact. In the model this is accomplished by an aggregate spending rule. Although, individual branches of the public sector may run permanent deficits, for the public sector as a whole, the long-run balanced-budget condition is imposed. In the social security sector we explicitly model the expenditure and revenue side for the pension, health, accident, and unemployment insurance, respectively. The model for the pension insurance already incorporates the measures implemented by the pension reform 2003. Additionally, expenditures on long term care are modelled. All other expenditures are adjusted to achieve the overall fiscal balance.
A-LMM as a long run model is supply side driven. The demand side adjusts in each period to secure equilibrium in the goods market. The adjustment mechanism runs via disequilibria in the trade balance. Prices and financial markets are not modelled explicitly; rather we view Austria as a small open economy. Consequently, the real interest and inflation rates coincide with their foreign counterparts. We impose that domestic excess savings correspond to the income balance in the current account. The resulting deficit or surplus in the current account changes the net foreign asset position of private households and consequently their current and permanent income and the path of consumption. This provides a feedback mechanism for converging towards the steady state.
Because of the long simulation horizon and a comparatively short record of sensible economic data for Austria, the parameterisation of the model draws extensively on economic theory and stability properties of growth models. As a consequence, many model parameters are either calibrated or
– 4 –
estimated under theory-based constraints. For consistency A-LMM relies on the European System of National Accounts (ESA 1995).
3 Simulations
3.1 Baseline with main variant of the population projection (scenario 1)
The baseline scenario documents simulation results with the main variant of the population forecast for Austria (Hanika et al., 2004). There, the working age population (15-64) increases until 2012 reaching a peak value of 5.61 million persons. Afterwards, it abates with a slightly negative rate of change between 2002 and 2070 (table 1). The old age dependency ratio (population aged 65+ over labour force) increases from the current value of 23 to the peak value of 52.5 percent in 2062.
Despite the decline in the size of the working age population from 2012 onwards, the labour force will keep rising until 2015 and shows a weak downward trend until 2070. This lag is due to the increase in the overall participation rate throughout the simulation period by 8 percentage points. Labour market participation rates of women increase in all age cohorts, whereas for males only those of the elderly rise. Despite higher activity rates, the number of economically active persons in full time equivalents decreases on average by 0.1 percent per year, amounting to a cumulated reduction of 200,000 persons until 2070. The gradual decline of unemployment built into the model keeps the number of unemployed rising until 2011. After 2020 unemployment shrinks rapidly towards the assumed level of the natural rate of 4.4 percent.
The investment to GDP ratio converges rapidly towards its long run value of 22.5 percent. This results in a modest increase in the capital to output ratio, which is associated with a gradual decline in the marginal product of capital. We assume a constant rate of growth of total factor productivity of 0.85 percent per year. In the case of a Cobb-Douglas production function with capital elasticity of 0.5 this is equivalent to a labour augmenting technical progress at a rate of 1.7 percent per year. With only a modest degree of capital deepening and lower employment due to the decelerating size of the working age population, the model predicts an average annual growth rate of real GDP of 1.6 percent.
The rate of inflation is set to the long run implicit target of the European Central Bank of 2 percent.
This results in an average annual growth rate of nominal GDP of 3.7 percent. Since the Cobb-Douglas technology implies constant factor shares, the long run annual growth rates of real and nominal labour compensation amount to 1.7 and 3.7 percent, respectively. Per capita real wages grow in tandem with real GDP.
Because all parameters in the revenue equations of the social security block remain unchanged, social contributions in relation to nominal GDP remain almost constant throughout the simulation horizon. Social expenditures, on the other hand, increase by 0.4 percent per year on average, reaching a maximum of 24.2 percent of nominal GDP in 2054. The gap between contributions and expenditures creeps up slowly from around 1 percent of GDP towards 7.4 percent at the maximum.
– 5 –
Despite the measures enacted in the recent pension reform, most of the additional need for financial resources will arise from further spending on pensions.
As we impose the balanced budget constraint on the aggregate public sector, any increase in social expenditures has to be matched by a corresponding reduction in other components of government spending. One important source of additional funds is a direct outcome of the balanced budget rule.
Due to constant government debt at the level of the starting year, interest expenditures on government debt become negligible over time. Starting at 3.6 percent of GDP in 2002, this ratio drops to 0.26 percent of GDP by 2070, thus freeing up resources to finance the deficit in the social security system. Additionally, government spending unrelated to social security and interest payments must be reduced by 2.7 percent of GDP until 2050. The balanced-budget rule keeps government spending in line with GDP-growth.
Domestic savings rise due to a growth differential vis-à-vis the rest of the world, which is assumed to grow at the rate of 2.5 percent in real terms. Excess savings are reflected in the current account surplus. The accumulation of net foreign assets directly increases the net financial wealth of private households, generates a transfer of interest income, and slowly feeds into domestic consumption. In the long run, the ratio of savings to the GDP converges to a higher steady state.
3.2 The effect of low fertility rates (scenario 2)
The second scenario uses the population projections with a lower fertility rate. In the main variant of Statistics Austria the fertility level is kept constant at 1.4 children per female. In this projection the fertility level is reduced to 1.1 children per female after 2015. Accordingly, the population decreases from currently 8 million persons to 7.1 million people by the year 2070.
The working age population decreases from 5.5 million persons in 2002 to 3.9 millions in 2070. In comparison with the baseline, the working age population in 2070 is reduced by 550.000 persons.
Until the year 2020 no big differences to the baseline emerge. Due to the measures of the pension reform, labour supply in 2020 is higher by 160.000 persons as in 2002. In the following decades, labour supply falls due to the smaller size of the cohorts entering the labour market. In 2070, labour supply merely amounts to 3 million persons (3.4 millions in the baseline).
Between 2002 and 2010 the average economic growth of the Austrian economy is slightly above 2 percent (table 2). In the following decades the decrease in the labour force leads to slower growth.
In 2070 the growth rate of the Austrian economy is 1.2 percent. Over the whole simulation period average annual growth is 1.4 percent. After 2020 economic growth is on average 0.2 percentage points slower as in the baseline. In 2070 the real GDP is 11 percent below that in the baseline. This lower growth is mainly caused by the reduction in the working age population, as age specific participation rates react little. The latter can be attributed to the low elasticity of labour supply with respect to the reservation wage of 0.06. Labour productivity and real wages will grow on average with 1.8 percent per year between 2002 and 2070 and, therefore, almost as in the baseline scenario.
– 6 –
The lower fertility rate has severe consequences for the old age dependency ratio. This ratio increases from 22.8 to 30.3 percent in 2020. After 2020 the speed accelerates and the old-age dependency ratio rises up to 59.2 percent in the year 2070.
Social contributions amount to 16.6 percent of nominal GDP in 2020. In the following decades the share of social security contributions in GDP will increase slightly up to 17 percent in 2070. Since social contributions remain constant, the effect on unemployment via the tax wedge is negligible. In contrast, social expenditures (as share of GDP) will grow considerably faster. Between 2002 and 2030 the share of social expenditures in GDP will increase by 4 percentage points. In the year 2060 this share reaches its maximal value of 24.3 percent. In this year the gap between contributions and expenditures amounts to 8.8 percentage points. About 4.5 percentage points will be compensated by a reduction in other government spending as enforced by our spending rule. The remainder can be attributed to lower interest payments on government debt.
The larger growth differential to the rest of the world implies a further increase in domestic savings (4.5 percentage points on average). Excess savings rise by 2.1 percentage points. Financial wealth of private households climbs by 70 percentage points of the GDP.
3.3 The effect of increasing social security contribution rates (scenario 3)
One of the intensively discussed consequences of aging is a severe deterioration in the solvency situation in public health and pension insurance systems. This concern derives from the financial structure of the mandatory public insurance system. Being a pure Pay-as-You-Go system, contributions by the economically active are immediately used to pay medical treatment and pensions.
In the baseline scenario we have already described that the gap between social contributions and expenditures widens within the first decade and reaches its peak shortly after 2050.
This section discusses the effects of additional branch - specific balanced - budget requirements in the public sector, where contribution rates in the social security insurance system are continuously adjusted so that the current government transfers remain constant as a ratio of GDP. This experiment highlights the effects of a steep rise in contribution rates to the social security system on employment and production possibilities. The main channels of transmission are a reduction in labour supply due to lower wages and an expansion in unemployment due to the widening tax wedge.
In A-LMM the evolution of expenditures of the social security sector is driven to a large extent by demographic developments. The higher number of pensions due to the aging of the Austrian population brings about a significant increase in spending relative to GDP. Additionally, demography affects the development of health expenditures. Its impact on pensions and health expenditures results in a marked acceleration of total social security spending relative to nominal GDP.
Revenues of the social security funds depend on the growth rate of the wage bill as well as on contribution rates. In the baseline we assume no policy change so that contribution rates remain unaltered at their 2002 level. Therefore, contributions to the social security system grow proportional to the wage bill. As the labour income share is constant, the ratio of social security contributions to
– 7 –
GDP remains at the same level as well. This leads to a widening gap between revenues and expenditures of the social security funds in the baseline.
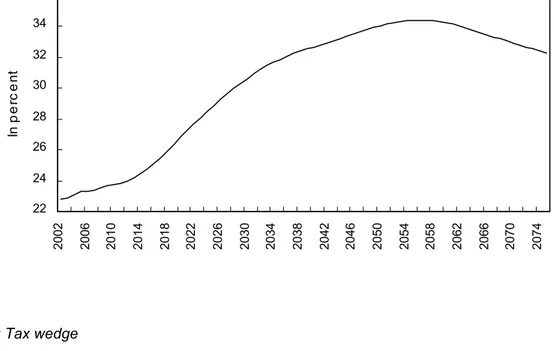
In this scenario we assume, instead, that contribution rates are continuously adjusted in a way such that the balance of the social security sector remains approximately at 2 percent of GDP. This requires a significant increase in contribution rates. As depicted in figure 1, contribution rates in the employees' pension system (ASVG: the sum of employee and employers rates) would have to be increased from currently 22.8 percent of wages up to a maximum rate of 34 percent in 2055. In order to stabilise the fiscal balance of social security funds, total social contributions as a percentage of nominal GDP will have to rise by as much as 6.5 percentage points.
As a consequence, social security contributions affect the outcome of the wage bargaining process via the tax wedge (figure 2). Part of the additional social contributions is shifted into higher wage claims, which in turn lead to a decline in labour demand and higher structural unemployment. The resulting average unemployment rate of 8.4 percent is about 3 percentage points above that obtained in the baseline. Due to the small elasticity of labour supply with respect to the reservation wage, the effect of higher social security contributions on labour supply is comparatively small. The total participation rate is only 0.3 percentage points below the baseline scenario.
Employment and GDP growth are reduced on average by around 0.1 percentage points per year. For the year 2070 this implies that the levels of employment and nominal as well as real GDP are about 5 percent lower than in the baseline. Lower overall growth and depressed net wages reduce the disposable income of private households throughout the simulation period and thus lead to less saving. Compared to the baseline, domestic savings as a share of GDP abate by 1.2 percentage points. Similarly, foreign savings as a share of GDP is 1.3 percentage points lower.
3.4 A scenario with higher productivity growth (scenario 4)
The literature on growth accounting emphasizes the importance of capital accumulation and technical progress for GDP-growth. Bosworth – Collins (2003), for example, analyse a set of 22 industrialized countries over the period 1960 through 2000 and report roughly equal contributions of physical capital accumulation (1.0) and factor productivity growth (0.9) to the growth rate of output per worker in industrialized countries (2.3). The remaining improvement in output per worker can be attributed to investment in human capital (0.3). In A-LMM capital accumulation depends on future cash flows that can be earned by firms. Thus, there is no direct way of increasing physical capital accumulation in the model. The effect of variations in the rate of technical progress, on the other hand, is exogenous and can therefore be manipulated to highlight the effect of an important driving factor of long-term growth on employment and output.
Neoclassical models explain the average growth rate of the economy by changes in either employment, or the capital stock, or total factor productivity. Out of these three factors, we already showed the implication of aging and low fertility on employment and output. In this section we discuss the effects of a higher growth rate in total factor productivity. In the baseline scenario the growth rate
– 8 –
of total factor productivity is set constant at an annual rate of 0.85 percent, which is equivalent to labour augmenting technical progress at the rate of 1.7 percent per year. The alternative scenario assumes a growth rate of total factor productivity of 1.15 percent, i. e. an increase by 0.3 percentage points over the baseline. All other variables correspond to their values in the baseline scenario.
This positive productivity shock generates an impressive stimulus to labour supply. In comparison to the baseline, we expect a total participation rate of 80.1 percent in 2070. This corresponds to a plus of 140,000 full time jobs. Since the employment decision of firms is guided by the marginal product of labour, the higher total factor productivity growth feeds directly into higher real wages. As to be expected from our capital elasticity of 0.5, average growth rate of real wages per employee rises by 0.6 percentage point relative to the baseline.
The resulting growth is higher than in the baseline, although less than would be expected from a TFP- shock of this size. Here the constraint imposed by aging slows down the economy again. The average growth rate of output is 0.1 percentage point below that of per capita variables. Business investment adjusts such that the marginal productivity of capital remains at the starting value and the capital output ratio drops slightly towards a level of 3.6. Despite the lower capital output ratio higher total factor productivity induces capital deepening in our model. Compared to baseline, the capital per full time equivalent worker is 36 percent higher.
By the design of the social security system, we do not expect major changes. Contribution rates are proportional up to the upper earnings threshold, and the upper earnings threshold itself grows in line with nominal wages. The simulation results live up to these expectations. The expenditure side, on the other hand, shows a more pronounced reaction to a high-growth environment. Social expenditures increase less steeply and reach a lower peak value of 22.5 percent of GDP in 2052.
The higher growth rate in GDP is associated with constant tax revenues as a share of GDP. But since we require full balance of the aggregate public budget in each year, lower expenditures on social security allow for an equivalent rise in other government spending.
On interesting characteristic of the model dynamics can be seen in the development of the current account. Due to the reduction in the growth differential vis-à-vis the rest of the world the current account surplus is distinctly lower as compared to the baseline. As a consequence, domestic savings does not change very much over time and the build-up of net foreign assets is less pronounced.
4 Conclusions
In this study we use a long run macroeconomic model for Austria to simulate the effects of aging on employment, output growth, and the solvency of the social security system. By disaggregating the population into six age cohorts and modelling sex specific participation rates for each cohort, we are able to account for the future demographic trends. We are able to single out the effect of aging on the labour force. Although in the model we assume exogenous technical progress, capital accumulation is endogenous.
– 9 –
Apart from a baseline scenario, we perform three alternative simulations that highlight the effects of aging from different perspectives. These include (1) purely demographic developments, (2) increasing labour market imperfections, and (3) higher economic growth due to a productivity shock. Specifically, we study the effect of low fertility rates on labour supply and its consequences for employment and output. We then consider what happens if the government transfers to the social security funds will be freezed at a constant ratio to GDP. The resulting deficit is countered by an increase in social contribution rates.
In the baseline solution we observe the direct effects of tightening labour supply starting from 2015.
On average, labour supply declines by 0.2 percent per year, causing divergence between the aggregate growth and growth per employee. Changes in demographic conditions and policy induced imperfections in the labour market lead only to moderate changes in output, the latter factor, however, affects the rate of unemployment. On the other hand, a permanent productivity shock slightly raises labour supply and employment, but profoundly affects aggregate output.
The consequences of aging on economic growth and employment in Austria can be summarized in terms of growth accounting. Table 5 shows that the model reproduces the empirics of growth accounting recorded for industrialized countries in the past forty years (Bosworth – Collins, 2003).
About a half of growth in output per employee can be attributed to capital deepening, the other half to technical progress. However, in industrial countries one third of the past growth record of 3.5 percent p.a. between 1960 and 2000 can be explained by rising labour supply. Given the current demographic outlook, this contribution will not apply in the future.
– 10 –
References
Baumgartner J., Hofer H., Kaniovski S., Schuh A.U., Url T., "A Long-run Macroeconomic Model of the Austrian Economy (A- LMM)", WIFO Working Paper, 2004.
Blanchard, O., Katz, L.F., "Wage Dynamics: Reconciling Theory and Evidence", AER P&P, 1999, 89, pp. 69-74.+
Bosworth, B.P., Collins S.M., "The Empirics of Growth: an Update", Brookings Papers on Economic Activity, 2003, 2, pp. 113- 179.
Economic Policy Committee, Budgetary challenges posed by aging populations: the impact on public spending on pensions, health and long-term care for the elderly and possible indicators of the long-term sustainability of public finances, EPC/ECFIN/655/01-EN final, Brussels, 24 October 2001.
http://europa.eu.int/comm/economy_finance/epc/documents/ageing_en.pdf
Economic Policy Committee, Reform challenges facing public pension systems: the impact of certain parametric reforms on pension expenditure, EPC/ECFIN/237/02 − final, Brussels, 5 July 2002
http://europa.eu.int/comm/economy_finance/epc/documents/para2002_en.pdf
Englander, A. S., Gurney A., "OECD Productivity Growth: Medium-Term Trends", OECD Economic Studies, 1994, 22, pp. 111- 154.
European Commission, Public Finances in EMU − 2001, European Economy, No. 3, Directorate-General for Economic and Financial Affairs, Brussels, 2001.
European Commission, Public Finances in EMU − 2002, European Economy, No. 3, Directorate-General for Economic and Financial Affairs, Brussels, 2002.
Guger A., Mayrhuber C., "Labour Force Participation and Public Pension System. Changes in the Labour Market and Their Impact on the Pension Dependency Ratio", Austrian Economic Quarterly, 2001, 2, pp. 47-56.
Hamermesh, D.S., Labor Demand, Princeton, 1993.
Hanika, A., Lebhart, G., Marik, S., "Zukünftige Bevölkerungsentwicklung Österreichs bis 2050 (2075)", Statistische Nachrichten, 2004, (1), pp. 18-33.
Hayashi, F., "Tobin's Marginal Q and Average Q: A Neoclassical Interpretation", Econometrica, 1982, 50(1), pp. 213-224.
Koch, M., Thimann, C., "From Generosity to Sustainability: the Austrian Pension System and Options for its Reform", IMF Working Paper, Washington D.C., 1997, (10).
Leibfritz, W., Roseveare, D., Fore, D., Wurzel, E., "Ageing Populations, Pension Systems and Government Budgets − How Do They Affect Saving?", pp. 47-102, in OECD (Ed.), Future global capital shortages: Real threat or pure fiction?, Paris, 1996.
Nickell, S., Nunziata, L., Ochel, W., Quintini, G., "The Beveridge Curve, Unemployment and Wages in the OECD from the 1960s to the 1990s, 2002", forthcoming in Aghion, P., Frydman, R., Stiglitz, J., Woodford, M. (Eds.), Knowledge, Information and Expectations in Modern Macroeconomics, in Honor of Edmund S. Phelps. Princeton University Press, 2003.
Part, P., Finanzielle Auswirkungen der Bevölkerungsalterung, Federal Ministry of Finance, Working Papers, Vienna, 2002, (8).
Part, P., Stefanits, H., Austria: Public Pension Projections 2000-2050, Federal Ministry of Finance, Working Papers, Vienna, 2001, (7).
Solow, R.M., Growth Theory - An Exposition, Oxford University Press, Oxford, 2000.
– 11 –
Ta b le 1: Ba seline sc ena rio with ma in va ria nt of the p op ula tion p rojec tion
2002 2010 2020 2030 2040 2050 2060 2070 Avg. c ha ng e
in p erc ent
Cum. c ha ng e in p erc enta g e
p oints
Working Ag e Pop ula tion (15-64) 5,464.7 5,577.6 5,562.9 5,237.2 4,944.1 4,759.1 4,551.2 4,423.9 -0.3 Ec onomic a lly a c tive p op ula tion (La b our forc e) 3,765.3 3,895.8 3,931.1 3,838.6 3,750.8 3,638.3 3,490.9 3,390.3 -0.2
Pa rtic ip a tion ra te, tota l 68.9 69.8 70.7 73.3 75.9 76.4 76.7 76.6 0.2 7.7
Women 61.1 61.7 62.3 65.6 69.4 70.6 70.9 70.8 0.2 9.7
Men 76.7 77.9 79.0 80.9 82.2 82.2 82.4 82.3 0.1 5.6
Unemp loyment ra te 6.9 7.2 6.9 5.4 4.5 4.4 4.4 4.4 -0.6 -2.4
Old a ge d ep end enc y ra tio 22.8 26.2 30.2 39.6 47.5 50.6 52.4 51.8 1.2 28.9
Rea l GDP p er c a p ita 25.0 28.8 34.0 40.2 47.7 56.3 66.5 79.1 1.7
Rea l wa g e p er emp loyee 34.1 38.7 46.3 55.2 65.7 78.4 93.6 110.8 1.7
Gross d omestic p rod uc t a t c onsta nt 1995 p ric es 1.4 2.1 1.7 1.7 1.6 1.4 1.4 1.4 1.6
Rea l wa g e p er emp loyee 1.3 1.6 1.9 1.7 1.7 1.8 1.7 1.7 1.7
GDP d efla tor 1.4 2.0 2.0 2.0 2.0 2.0 2.0 2.0 2.0
Ma rg ina l p rod uc t of c a p ita l 0.14 0.14 0.13 0.13 0.13 0.13 0.13 0.13 -0.1
Ca p ita l-outp ut-ra tio 3.62 3.62 3.64 3.67 3.70 3.73 3.77 3.78 0.1 0.2
Domestic Sa ving s 8.21 8.95 9.56 10.34 11.09 11.85 12.07 11.97 0.6 3.8
Foreign Sa vings (Current Ac c ount) 0.47 1.78 2.94 4.08 5.23 6.39 6.74 6.64 4.0 6.2
Huma n Wea lth of Priva te Household s - 966.97 978.55 985.20 980.43 975.39 971.22 963.69 0.0 -1.8
Fina nc ia l Wea lth of Priva te Household s - 1,101.64 1,128.59 1,161.83 1,188.59 1,219.89 1,253.47 1,272.73 0.2 179.8
Government exp end itures 51.3 50.6 50.8 50.8 50.8 50.8 50.7 50.6 -0.8
Other government exp end itures 25.5 25.3 24.6 23.6 23.2 22.8 22.9 23.5 -1.9
Soc ia l exp end itures 17.7 19.9 21.3 22.7 23.5 24.1 24.0 23.4 0.4 5.7
Soc ia l c ontrib utions 16.6 16.4 16.6 16.7 16.7 16.8 16.8 16.7 0.0 0.1
1,000 p ersons
In p erc ent
2002/ 2070
In p erc ent of GDP 1,000 €
Perc enta ge c ha ng e a g a inst p revious yea r
Ra tio
– 12 – Ta b le 2: The effec t of low fertility ra tes
2002 2010 2020 2030 2040 2050 2060 2070 Avg. c ha ng e
in p erc ent
Cum. c ha ng e in p erc enta g e
p oints
Working Ag e Pop ula tion (15-64) 5,464.7 5,577.6 5,552.3 5,110.7 4,700.7 4,411.4 4,089.2 3,855.2 -0.5 Ec onomic a lly a c tive p op ula tion (La b our forc e) 3,765.3 3,895.8 3,925.1 3,769.3 3,590.3 3,388.0 3,152.1 2,982.8 -0.3
Pa rtic ip a tion ra te, tota l 68.9 69.8 70.7 73.8 76.4 76.8 77.1 77.4 0.2 8.5
Women 61.1 61.7 62.3 66.0 69.8 70.8 71.1 71.4 0.2 10.3
Men 76.7 77.9 79.0 81.4 82.8 82.7 82.9 83.1 0.1 6.5
Unemp loyment ra te 6.9 7.2 6.9 5.3 4.4 4.4 4.4 4.4 -0.6 -2.4
Old a ge d ep end enc y ra tio 22.8 26.2 30.3 40.5 49.9 54.6 58.4 59.2 1.4 36.4
Rea l GDP p er c a p ita 25.0 28.8 34.0 40.2 47.4 55.3 64.6 76.3 1.7
Rea l wa g e p er emp loyee 34.1 38.7 46.3 55.4 66.4 79.6 95.3 112.9 1.8
Gross d omestic p rod uc t a t c onsta nt 1995 p ric es 1.4 2.1 1.6 1.5 1.3 1.1 1.1 1.2 1.5
Rea l wa g e p er emp loyee 1.3 1.6 2.0 1.8 1.8 1.8 1.8 1.7 1.8
GDP d efla tor 1.4 2.0 2.0 2.0 2.0 2.0 2.0 2.0 2.0
Ma rg ina l p rod uc t of c a p ita l 0.14 0.14 0.14 0.13 0.13 0.13 0.13 0.13 -0.1
Ca p ita l-outp ut-ra tio 3.62 3.62 3.64 3.68 3.73 3.78 3.83 3.85 0.1 0.2
Domestic Sa ving s 8.21 8.96 9.78 10.77 11.75 12.80 13.31 13.36 0.7 5.2
Foreign Sa vings (Current Ac c ount) 0.47 1.81 3.36 4.94 6.50 8.10 8.81 8.76 4.4 8.3
Huma n Wea lth of Priva te Household s - 962.84 969.71 978.49 980.60 982.32 984.87 980.27 0.0 16.5
Fina nc ia l Wea lth of Priva te Household s - 1,104.54 1,128.02 1,166.30 1,205.06 1,251.37 1,304.54 1,340.15 0.3 243.3
Government exp end itures 51.3 50.6 50.8 50.8 50.8 50.8 50.7 50.6 -0.7
Other government exp end itures 25.5 25.3 24.6 23.4 22.5 21.5 21.1 21.5 -3.9
Soc ia l exp end itures 17.7 19.9 21.3 23.0 24.2 25.3 25.8 25.4 0.5 7.7
Soc ia l c ontrib utions 16.6 16.4 16.6 16.7 16.8 16.9 17.0 16.9 0.0 .3
In p erc ent of GDP 1,000 €
Perc enta ge c ha ng e a g a inst p revious yea r
Ra tio 1,000 p ersons
In p erc ent
2002/ 2070
0
– 13 – Ta b le 3: The effec t of inc rea sing soc ia l sec urity c ontrib ution ra tes
2002 2010 2020 2030 2040 2050 2060 2070 Avg. c ha ng e
in p erc ent
Cum. c ha ng e in p erc enta g e
p oints
Working Ag e Pop ula tion (15-64) 5,464.7 5,577.6 5,562.9 5,237.2 4,944.1 4,759.1 4,551.2 4,423.9 -0.3 Ec onomic a lly a c tive p op ula tion (La b our forc e) 3,765.3 3,893.2 3,924.5 3,825.8 3,733.3 3,618.7 3,470.6 3,371.7 -0.2
Pa rtic ip a tion ra te, tota l 68.9 69.8 70.5 73.1 75.5 76.0 76.3 76.2 0.1 7.3
Women 61.1 61.7 62.1 65.4 69.0 70.1 70.4 70.3 0.2 9.3
Men 76.7 77.9 78.9 80.6 81.9 81.8 82.0 81.9 0.1 5.2
Unemp loyment ra te 6.9 8.2 8.8 8.7 8.6 8.8 8.8 8.3 0.3 1.4
Old a ge d ep end enc y ra tio 22.8 26.2 30.2 39.6 47.5 50.6 52.4 51.8 1.2 28.9
Rea l GDP p er c a p ita 25.0 28.5 33.4 38.9 45.7 53.6 63.2 75.4 1.6
Rea l wa g e p er emp loyee 34.1 38.9 46.6 55.6 66.1 78.8 93.8 110.7 1.7
Gross d omestic p rod uc t a t c onsta nt 1995 p ric es 1.4 2.0 1.5 1.5 1.5 1.4 1.4 1.5 1.6
Rea l wa g e p er emp loyee 1.3 1.6 2.0 1.7 1.7 1.7 1.7 1.7 1.7
GDP d efla tor 1.4 2.0 2.0 2.0 2.0 2.0 2.0 2.0 2.0
Ma rg ina l p rod uc t of c a p ita l 0.14 0.14 0.13 0.13 0.13 0.13 0.13 0.13 -0.1
Ca p ita l-outp ut-ra tio 3.62 3.63 3.65 3.70 3.72 3.75 3.78 3.78 0.1 0.2
Domestic Sa ving s 8.21 9.68 10.20 10.36 10.68 10.98 10.84 10.77 0.4 2.6
Foreign Sa vings (Current Ac c ount) 0.47 2.76 3.95 4.47 5.09 5.72 5.55 5.38 3.6 4.9
Huma n Wea lth of Priva te Household s - 895.03 883.84 882.10 879.34 881.74 890.00 893.10 0.0 -16.4
Fina nc ia l Wea lth of Priva te Household s - 1,103.76 1,124.34 1,152.73 1,172.09 1,195.88 1,223.12 1,234.13 0.2 138.8
Government exp end itures 51.3 52.1 53.6 55.2 56.0 56.3 56.1 55.4 4.0
Other government exp end itures 25.5 26.3 26.9 27.2 27.4 27.3 27.4 27.5 2.1
Soc ia l exp end itures 17.7 20.2 21.8 23.5 24.4 25.0 24.9 24.1 0.5 6.4
Soc ia l c ontrib utions 16.6 18.0 19.8 21.7 22.6 23.0 22.8 22.0 0.4 .4
1,000 p ersons
In p erc ent
2002/ 2070
In p erc ent of GDP 1,000 €
Perc enta ge c ha ng e a g a inst p revious yea r
Ra tio
5
– 14 – Ta b le 4: A sc ena rio with hig her p rod uc tivity g rowth
2002 2010 2020 2030 2040 2050 2060 2070 Avg. c ha ng e
in p erc ent
Cum. c ha ng e in p erc enta g e
p oints
Working Ag e Pop ula tion (15-64) 5,464.7 5,577.6 5,562.9 5,237.2 4,944.1 4,759.1 4,551.2 4,423.9 -0.3 Ec onomic a lly a c tive p op ula tion (La b our forc e) 3,765.3 3,908.9 3,966.8 3,899.2 3,837.0 3,749.3 3,624.1 3,544.8 -0.1
Pa rtic ip a tion ra te, tota l 68.9 70.1 71.3 74.5 77.6 78.8 79.6 80.1 0.2 11.2
Women 61.1 62.0 62.9 66.8 71.2 73.0 73.9 74.4 0.3 13.3
Men 76.7 78.1 79.6 82.0 83.9 84.4 85.2 85.7 0.2 9.0
Unemp loyment ra te 6.9 7.2 6.9 5.4 4.5 4.4 4.4 4.4 -0.6 -2.5
Old a ge d ep end enc y ra tio 22.8 26.2 30.2 39.6 47.5 50.6 52.4 51.8 1.2 28.9
Rea l GDP p er c a p ita 25.0 29.8 37.2 46.6 58.7 73.8 93.0 118.0 2.3
Rea l wa g e p er emp loyee 34.1 40.0 50.1 62.9 79.0 99.7 125.9 157.8 2.3
Gross d omestic p rod uc t a t c onsta nt 1995 p ric es 1.4 2.6 2.3 2.3 2.2 2.1 2.0 2.1 2.2
Rea l wa g e p er emp loyee 1.3 2.1 2.4 2.3 2.3 2.3 2.3 2.3 2.3
GDP d efla tor 1.4 2.0 2.0 2.0 2.0 2.0 2.0 2.0 2.0
Ma rg ina l p rod uc t of c a p ita l 0.14 0.14 0.14 0.14 0.14 0.14 0.14 0.14 0.0
Ca p ita l-outp ut-ra tio 3.62 3.56 3.54 3.55 3.55 3.57 3.60 3.60 0.0 0.0
Domestic Sa ving s 8.21 7.65 7.88 8.33 8.82 9.35 9.37 9.14 0.2 0.9
Foreign Sa vings (Current Ac c ount) 0.47 -0.58 -0.14 0.44 1.20 2.02 2.09 1.81 2.0 1.3
Huma n Wea lth of Priva te Household s - 1,021.67 1,031.08 1,033.89 1,024.32 1,014.88 1,007.06 996.16 0.0 -24.3 Fina nc ia l Wea lth of Priva te Household s - 1,086.97 1,090.61 1,100.43 1,104.56 1,114.34 1,127.67 1,130.18 0.0 36.0
Government exp end itures 51.3 50.7 50.9 50.9 50.9 50.9 50.8 50.7 -0.6
Other government exp end itures 25.5 25.6 25.4 24.9 24.8 24.6 25.0 25.8 0.3
Soc ia l exp end itures 17.7 19.6 20.7 21.7 22.1 22.5 22.2 21.4 0.3 3.7
Soc ia l c ontrib utions 16.6 16.4 16.6 16.6 16.7 16.7 16.7 16.6 0.0 0.0
In p erc ent of GDP 1,000 €
Perc enta ge c ha ng e a g a inst p revious yea r
Ra tio 1,000 p ersons
In p erc ent
2002/ 2070
– 15 –
Table 5: Growth accounting for simulation results, 2002 - 2070
Outp ut Outp ut / Emp loyee
Ca p ita l / Emp loyee
TFP
Ba seline 1.60 1.72 0.87 0.85
Low fertility 1.43 1.74 0.90 0.85
Ba la nc ed Soc ia l Sec urity 1.53 1.72 0.87 0.85
Higher Prod uc tivity 2.20 2.24 1.10 1.15
Avera ge c ha nge in p erc ent
– 16 –
Figure 1: Contribution rates in pension insurance - stabilising government transfers
22 24 26 28 30 32 34 36
2002 2006 2010 2014 2018 2022 2026 2030 2034 2038 2042 2046 2050 2054 2058 2062 2066 2070 2074
In percent
Figure 2: Tax wedge
0.6 0.7 0.8 0.9
2002 2006 2010 2014 2018 2022 2026 2030 2034 2038 2042 2046 2050 2054 2058 2062 2066 2070 2074
Baseline St ab le fisc al bala nc e
of soc ial se c urit y