P
olicyR
eseaRchW
oRkingP
aPeR4858
Poverty Decline, Agricultural Wages, and Non-Farm Employment in Rural India
1983–2004
Peter Lanjouw Rinku Murgai
The World Bank
Development Research Group Poverty Team
March 2008
WPS4858
Abstract
The Policy Research Working Paper Series disseminates the findings of work in progress to encourage the exchange of ideas about development issues. An objective of the series is to get the findings out quickly, even if the presentations are less than fully polished. The papers carry the names of the authors and should be cited accordingly. The findings, interpretations, and conclusions expressed in this paper are entirely those of the authors. They do not necessarily represent the views of the International Bank for Reconstruction and Development/World Bank and
Policy ReseaRch WoRking PaPeR 4858
The authors analyze five rounds of National Sample Survey data covering 1983, 1987/8, 1993/4, 1999/0, and 2004/5 to explore the relationship between rural diversification and poverty. Poverty in rural India declined at a modest rate during this period. The authors provide region-level estimates that illustrate considerable geographic heterogeneity in this progress. Poverty estimates correlate well with region-level data on changes in agricultural wage rates. Agricultural labor remains the preserve of the uneducated and also to a large extent of the scheduled castes and scheduled tribes. Although agricultural labor grew as a share of total economic activity over the first four rounds, it had fallen back to the levels observed at the beginning of the survey period by 2004. This all-India trajectory masks widely varying trends across states. During this period, the rural non- farm sector grew modestly, mainly between the last two survey rounds. Regular non-farm employment remains largely associated with education levels and social status
This paper—a product of the Poverty Team, Development Research Group—is part of a larger effort in the department to analyze processes and causes of poverty reduction in the developing world. Policy Research Working Papers are also posted on the Web at http://econ.worldbank.org. The authors may be contacted at rmurgai@worldbank.org and planjouw@
worldbank.org.
that are rare among the poor. However, casual labor and self-employment in the non-farm sector reveal greater involvement by disadvantaged groups in 2004 than in the preceding rounds. The implication for poverty is not immediately clear—the poor may be pushed into low-return casual non-farm activities due to lack of opportunities in the agricultural sector rather than being pulled by high returns offered by the non-farm sector.
Econometric estimates reveal that expansion of the non- farm sector is associated with falling poverty via two routes: a direct impact on poverty that is likely due to a pro-poor marginal incidence of non-farm employment expansion; and an indirect impact attributable to the positive effect of non-farm employment growth on agricultural wages. The analysis also confirms the important contribution to rural poverty reduction from agricultural productivity, availability of land, and consumption levels in proximate urban areas.
Poverty Decline, Agricultural Wages, and Non-Farm Employment in Rural India:
1983-2004
Peter Lanjouw (World Bank) and Rinku Murgai (World Bank)*
* We are grateful to participants of the workshop “Household-Level Linkages Between Farm and Non-farm Rural Income Generation Activities” held at the Food and Agricultural Organization, October 11-12, 2007, and to participants at the Ninth Annual Conference on Indian Economic Policy Reform at Stanford University in June, 2008. Additional thanks are due to two anonymous referees and to Mukesh Eswaran, Subashish Gangopadhyay, Himanshu, Hanan Jacoby, Anjini Kochar, Ashok Kotwal, Aprahajit Mahajan, Martin Ravallion, Abhijit Sen, Forhad Shilpi, TN Srinivasan, Tara Vishwanath, Wilima Wadhwa and Nobuo Yoshida. We thank Pinaki Joddar for research assistance. The views in this paper are those of the authors and should not be taken to reflect those of the World Bank or affiliated institutions. All errors are our own.
I. Introduction
Twenty years ago the common image of India was one of a vast, populous country blessed with a vibrant democracy but afflicted by a highly rigid social structure, low levels of human development, widespread and deep consumption poverty, and doomed to eternal economic underperformance. Recent decades have seen some significant changes to that image. Following economic reforms first introduced during the 1980s and continued in subsequent years, India has raced towards the top of the world league tables in terms of aggregate economic performance. There is little doubt that the newly unleashed Indian economy has settled into a new, more rapid, growth trajectory.
While future crises may unfold and growth may falter, a return to the sclerotic old days seems unlikely. Indeed, on the economic front the country now faces problems that are linked to success: moving to the next generation of reforms to sustain growth and expanding the benefits of rapid growth—across sectors, regions, and people.
Economic growth is only a means, not an end. It is critical that rising incomes and new opportunities ushered in by a reinvigorated economy translate into welfare improvements. Historically, India’s performance in poverty reduction has been rather disappointing. As a share of the population, poverty during the pre-reform decades declined at a pace that was steady, but slow. In the face of ongoing overall population growth it proved very difficult to significantly reduce the total number of people suffering from staggering levels of material deprivation. A question of central importance has thus been whether the newly galvanized Indian economy heralds also a decisive break with the past in the domain of poverty reduction. This question has engaged a large community of researchers and analysts during recent decades.
This paper focuses on rural areas and presents evidence from household surveys to ask whether, and how, rural living standards have improved significantly over time.
Estimates of rural poverty from four large-scale surveys carried out in 1983, 1987/8, 1993/4 and 2004/5 indicate that there has been modest progress but with no suggestion of an acceleration in the pace of poverty reduction in rural India alongside the acceleration of economic growth during this period. There is considerable variation both across and within states which we exploit to explore mechanisms underlying the observed patterns of poverty reduction.
The paper confirms the historically close association between poverty and agricultural wage employment, and finds that there has been no decline – until the most recent period of 1999/00 to 2004/05 – in the share of the adult population with primary occupation in agricultural wage labor. As a result, changes in poverty are found to correlate well with changes in agricultural wages at the region (within state) level. There is little evidence of broad, across the board, acceleration in agricultural wage growth during the 1990s. In a majority of regions, real agricultural wage growth between 1993/4 and 2004/5 is lower than what was observed during the 1980s. The period post-1999 witnessed a sharp deceleration in the growth rate of agricultural wages, and in some regions real wages actually declined.
A sector that is often looked to for impetus in rural poverty reduction is the rural non-farm sector. This sector accounts for nearly half of rural household income in a significant number of states in India. The sector is highly heterogeneous and can be crudely divided into three sub-sectors comprising: regular salaried non-farm employment; casual wage labor in the non-farm sector; and non-agricultural self- employment activities. The former sub-sector is most clearly associated with relatively high and stable incomes, while the latter two are more heterogeneous and can comprise both productive as well as residual activities. NSS data indicate that during the reference period there are signs of modest growth, on aggregate, in the size of the non-farm sector.
While overall employment levels in the non-farm sector remained remarkably stable between 1983 and 1999/0, there is evidence that this has picked up between 1999/0 and 2004/5.
However, throughout this period the poor are hardly represented at all in the regular non-farm sector and are only slightly more involved in non-farm self- employment. Only in the case of casual wage-labor in the non-farm sector do the poor appear to have a somewhat greater involvement in the non-farm sector than do the non- poor.
Despite evidence of only modest poverty reduction or diversification out of agriculture at the national level, National Sample Survey (NSS) data reveal a great deal of heterogeneity in these outcomes at the sub-state region-level. This regional variation can be exploited to study econometrically the relationship between poverty, agricultural
wage labor employment and non-farm employment in rural India. The analysis reveals that poverty is associated in a complex way with the non-farm sector. First the data indicate that, controlling for agricultural wages, agricultural productivity, land availability and consumption levels in nearby urban centers, expansion of non-farm employment is directly associated with poverty decline. We suggest that this is consistent with the idea that while at early levels the non-poor may have been more successful at “capturing” non-farm income earning opportunities, there is some evidence that “marginal incidence” of further expansion of the sub-sector is pro-poor. We show that the pro-poor impact of the non-farm sector is attenuated in settings where education levels are particularly low. Second, the analysis further shows that expansion of the non- farm sector appears to put pressure on wage rates in agriculture (again, less strongly so in settings where education levels are particularly low). Rising agricultural wage rates are, in turn, strongly correlated with rural poverty reduction. Thus, there is some evidence consistent with an important indirect impact of the non-farm sector on rural poverty.
The evidence assembled in this study from the NSS surveys thus offers some empirical support to the view that the period between 1983 and 2004/5 was one of gradual economic diversification out of agriculture and limited poverty reduction in rural areas. But it is important, as well, to acknowledge the limitations to the analysis here.
The analysis stops in 2004/5 and we are unable to say what has happened since that survey year. The analysis is also somewhat partial in its examination of sources of rural livelihoods. Notably, we are not able to carry out a very detailed analysis of the relationship between poverty and agricultural production, or on the evolution of agricultural output over time. This omission is due to lack of detailed data in the NSS surveys on farm production and household incomes.
In the remaining sections of this paper we turn in greater detail to the empirical underpinnings of the basic story outlined above. In Section II we consider the evolution of poverty in India. Section III looks at agricultural labor and agricultural wages.
Section IV documents the size and evolution of the non-farm sector between 1983 and 2004/5, and Section V exploits a region-level panel dataset across three of our four surveys to bring together the arguments of the preceding sections and Section VI offers some concluding comments.
II. Poverty 1983 – 2004/5
Comparable estimates of poverty for the 38th, 43rd, 50th and 61st NSS rounds suggest that at the all-India level, rural poverty declined modestly from 37.2 percent to 28.4 percent between 1993/4 and 2004/5, a rate of less than 1 percentage point per year (Table 1). This is nearly the same as the decline from 46.9 to 37.2 percent that occurred during the preceding 10 years (between 1983 and 1993/4). There is little evidence of a striking acceleration of poverty reduction in rural India alongside the well-documented acceleration of economic growth in India during this period.1
Table 1 also reveals that changes in poverty at the national, and even state, level mask considerable heterogeneity in the evolution of poverty across regions. Indeed, while poverty declined in most regions, it is estimated to have risen between 1993 and 2004/5 in roughly one in six of the regions considered in our analysis.
There has been a great deal of controversy surrounding the pace, and even direction, of poverty reduction during the 1990s due to problems of comparability of the 1999/00 NSS 55th round with earlier surveys.2 In a precursor to this paper, Kijima and Lanjouw (2003 and 2005) proposed a number of adjustments at restoring comparability across the 50th and 55th rounds, and suggested that poverty reduction in rural areas was very modest between 1993/94 and 1999/00, a finding that was also suggested by Sen and Himanshu (2004a and 2004b). Results in these papers suggest that the bulk of poverty reduction between 1993/4 and 2004/5 is likely to have taken place in the latter half of the decade, between 1999/00 and 2004/5. This presents a conundrum, because as shown in the next section, poverty reduction in rural India has historically been closely associated with agricultural wages and the latter half of the decade was witness to a sharp deceleration in agricultural wage growth. It has led some researchers (Himanshu 2007;
Dev and Ravi, 2007) to suggest that the non-farm sector may have be a key factor behind the poverty decline during the 1990s.
1 In a recent contribution, Deaton (2007) suggests that official statistics may be understating the rate of rural inflation during this time period with the implication that the 2004/5 poverty estimates might be understating the true incidence of poverty in that years. His analysis suggests that the rate of poverty decline between 1993/4 and 2004/5 discussed above may thus be overstated by 3 percentage points.
2 See the collection of papers (Deaton, 2003a, Datt, Kozel and Ravallion, 2003, Sundaram and Tendulkar, 2003) in the Economic and Political Weekly (January 25, 2003), and the update in Deaton and Kozel (2006).
We consider in the next section trends in employment in agricultural labor, and in agricultural wages, to see to what extent these provide corroborating evidence to the poverty estimates above.
III. Agricultural Employment and Agricultural Wages
Historically, employment in casual agricultural wage labor has been shown to be strongly correlated with poverty in rural India (Lal, 1976, Singh, 1990, Lanjouw and Stern, 1998, Sharma 2001, Sundaram, 2001, Himanshu, 2004). More recent data suggest that this is still the case. The “odds” of being employed in agricultural wage labor fall monotonically as one rises in the consumption distribution. And there is only slight evidence of this association weakening over time (Table 2). Other dimensions of well- being such as education levels and caste status have also been shown to be strongly and inversely correlated with agricultural wage employment (Kijima and Lanjouw, 2005).
Agricultural wage employment continues to employ over 20% of adult males, and has expanded steadily since 1983, until a recent decline between 1999/00 and 2004/05 (Table 3). For women, although far fewer are judged to be economically active, the importance of agricultural labor employment is even more pronounced. There is considerable heterogeneity among states, with several states with higher agricultural employment shares in 2004/5 than, say, in 1987/8 (Appendix Table 1).
This evidence suggests that agricultural wage employment and agricultural wages in particular, can serve as a valuable window on living standards in rural areas. As suggested by Deaton and Drèze (2002), agricultural wages can be viewed not only as useful proxies of poverty but can also be seen as indicators of poverty in their own right insofar that they capture the reservation wages of the rural labor force.
Trends in state-level daily agricultural wages estimated from NSS data suggest much heterogeneity in levels and trends across states. During the 1980s, in 8 states, real wages declined (Table 4).3 This pattern accords with the widely-held notion that 1987/8
3 Agricultural wage data are available in India from a variety of sources. Himanshu (2004) provides a detailed assessment of the different sources available, and argues that calculation of agricultural wages directly from the NSS surveys is not only feasible, but quite possibly yields more reliable figures than are available from alternative sources. He cautions against the calculation of agricultural wage rates from the 1987/8 NSS round, arguing that the unit record data do not produce wage rates that are readily comparable to wage estimates for that year published by the NSS itself. We have chosen to calculate and report the
was a poor agricultural year. Beyond 1987/8 and until 1990/0, real wages rose in all states. However, between 1999/0 and 2004, there was a significant deceleration in real wage growth, from 2.6 percent per year between 1993/4 and 1999/0 to 1.6 percent per year in the period that followed. In some states real wages actually decline. Only in Assam, Orissa and UP is there evidence of real wages rising more rapidly between 1999/0 and 2004/5 than during the preceding two survey rounds.
This deceleration in wage growth, juxtaposed against potentially more rapid decline in poverty during the 1999/0 to 2004/5 has led to renewed attention to the non- farm sector as a source of poverty reduction. We turn to trends in non-farm employment in the next section.
IV. Non-Farm Employment
As described in Section I, the rural non-farm sector is widely looked to as a source of momentum for rural growth and poverty reduction. Employment patterns in the non-farm sector have been widely scrutinized for evidence of economic dynamism in rural areas. Visaria and Basant (1993) carefully examine National Sample Survey and Census data and document a clear increase in the share of non-agricultural employment in the rural workforce during the 1980s, with the trend more clearly evident among males than among female workers. In addition, the evidence appears to point to a more rapid expansion of tertiary sector employment rather than of secondary sector employment,4 and that the bulk of employment growth is of a casual nature, rather than permanent.
Surprisingly, this expansion appears to have slowed during recent years. Unni and Raveendran (2007) suggest that long-term employment growth in rural areas slowed down substantially between 1993/4-2004/5 relative to 1983-1993.
Fisher, Mahajan and Singha (1997) conclude that 18-25% of rural employment occurred in the non-farm sector at the beginning of the 1990s. An important observation made in this study was that approximately one-fifth of total rural non-farm employment
1987/8 estimates but acknowledge that they may be less reliable than estimates for other survey years. In the econometric analysis in Section V, we do not include the 1987/8 data due to these comparability problems.
4 Secondary sector refers to manufacturing, utilities, construction and mining. The tertiary sector includes activities such as retail trade, hotels and restaurants, financial services, transport and communication, public administration, education, health, and community services.
was estimated to be generated by public sector services, primarily public administration and education (see also Sen, 1996). Other important sectors in terms of employment shares were found to include retail trade, personal services, construction, wood products and furniture, over-land transport, and textiles. While manufacturing activities are often the first that come to mind when discussing the non-farm sector, the study showed that services are easily as important.
A study by Acharya and Mitra (2000) draws on multiple rounds of National Sample Survey data (spanning the period 1984-1997), and also two rounds of the Economic Census (corresponding to 1990 and 1998) to ask whether the positive non-farm employment trends of the 1980s have continued through the 1990s. They find little evidence of further expansion. At the all-rural India level they find that employment in the secondary and tertiary sectors grew from about 22% of the workforce in 1983 to about 25% by 1987-8. They found no evidence of further growth during the 1990s; the last NSS survey they examined (“thin” round for 1997) indicated an employment rate of about 24%. The authors note considerable variation across states in the degree of occupational diversification (with states such as Kerala, Punjab, Haryana, Gujarat and Tamil Nadu clearly more diversified than others), but observe no clear evidence of growth in non-farm employment rates during the 1990s occurring in any state other than Kerala (Acharya and Mitra, 2000).5 Unni and Raveendran (2007) suggest that non-farm self-employment and non-farm casual wage employment sector grew slightly more rapidly between 1993/4-2004/5 than during the preceding decade. However, they point to evidence of a less rapid growth rate in regular non-farm employment during this period.
An important recent paper by Foster and Rosenzweig (2003) provides a theoretical exposition of how the non-farm economy interacts with the farm economy - building on the great heterogeneity of non-farm activities in rural areas, and highlighting the importance of general-equilibrium relationships. The authors argue that a key distinction has to be made between traded and non-traded goods and services, and they emphasize the significance of wage and salary employment in non-farm activities as opposed to the
5 In his exhaustive examination of NSS data between 1977/8 to 1999/0 Vaidyanathan (2001) observes many of the same trends reported here.
self-employment activities that have traditionally been the focus of attention. Foster and Rosenzweig (2003 and 2004) analyze NCAER data from roughly 250 villages covering the period 1971, 1982 and 1999 to study the evolution of the non-farm economy in rural India. These data permit the authors to calculate non-farm incomes, and they show that non-farm income shares have increased significantly during this time period.6 Foster and Rosenzweig suggest that a growing rural based export-oriented manufacturing sector can be expected to have an important pro-poor impact in rural India, possibly more significant than that which can be expected from agriculture-led growth. This follows from their observation that rural diversification tends to be more rapid and extensive in places where agricultural wages are lower and where agricultural productivity growth has been less marked. Although the Foster and Rosenzweig study employs different data definitions and conventions than NSS-based studies (including the present study) their evidence is suggestive of a very significant rise in non-farm employment shares during their study period. They suggest that by 1999 about 44% of males aged 25-44 had primary employment in the non-agricultural sector by 1999. These figures appear higher than what NSS data suggest (although the figures cannot be directly compared as they refer to different age groups and different employment definitions). An important question is whether expansion of the non-farm sector observed by Foster and Rosenzweig occurred steadily during their reference period, or whether it took place in fits and starts.
As others have already suggested, and we shall see further below, NSS data indicate that between 1987/8 and 1999/0 there was little expansion of non-farm employment in rural areas.
A recent study by Eswaran, Kotwal, Ramaswami and Wadhwa (2007) pursues the question of whether expansion of the non-farm sector is likely to influence agricultural wage rates. This could be an important route through which rural non-farm employment influences rural poverty, particularly if, as suggested by Foster and Rosenzweig (2003 and 2004) non-farm enterprises have been establishing themselves in areas where agricultural wages are low (and therefore rural poverty is high). The analysis by Eswaran
6 Foster and Rosenzweigh (2003b) suggest that non-farm income shares grew from just under a third in 1982 to nearly 50% in 1999. A study by Lanjouw and Shariff (2002) based on a different NCAER dataset for 1993 calculated a rural non-farm income share of 37%. This is suggestive of steady growth of the non- farm sector throughout the 1980s and 1990s – a trend which NSS employment data do not appear to corroborate (see below).
et al (2007) draws on NSS data in combination with total factor productivity data from other sources. They find that agricultural wage growth during the period 1983-1999 has been driven for the greatest part by changes in agricultural productivity and that the contribution of the non-farm sector to real wage increase is likely to have been no greater than a quarter.
In Section V below we shall revisit the arguments offered by Foster and Rosenzweig (2003 and 2004) and those by Eswaran et al (2007), regarding the role of agricultural wage labor markets, and the farm versus the non-farm sector, in understanding rural poverty reduction. We turn first to descriptive analysis of NSS data in order to gain a sense of overall dimensions of the non-farm sector.
Non-Farm Employment Shares
Non-farm employment is divided into three categories: regular employment (generally salaried), casual employment (daily wage) and self-employment/own enterprise activities. This distinction is intended to reflect to some extent the very different characteristics of non-farm activities in rural areas – characteristics that are important in terms of defining the desirability of such jobs. A general typology that appears to resonate with findings from many village studies is that regular non-farm employment is typically highly sought-after in rural areas as it is associated not only with high incomes, but crucially also with a degree of stability. Non-farm self-employment activities can be both residual, last resort options as well as high return, productive, activities, but whether they are of the former or latter variant generally depends on the amount of capital resources that can be brought to the activity. Casual non-farm wage employment is generally thought to be less demeaning to a worker than agricultural wage labor, but returns may be only marginally higher and the nature of the work may be both physically demanding as well as hazardous (construction, rickshaw pulling, industrial workshops, etc.). 7
7 Note, there is potential overlap in our categories of casual, self-employment and regular non-farm employment – a person may be doing more than one type of activity in the course of the year. In our econometric analyses below we classify individuals on the basis of Principal Usual Status, the activity they are engaged in for the major part of the year preceding the survey, including both their principal and main subsidiary activity.
Employment shares in non-farm activities have grown since 1983, reaching their peak in 2004/5 (Table 3), with state level employment shares ranging 22-32% (Appendix Table 1). In each respective survey year, wage and salary employment has tended to account for about 11-16% of overall employment, with the balance made up by self- employment/own-enterprise activities. There are large differences across states in terms of the importance of the non-farm sector. In Kerala, non-farm employment shares were as high as 77% in 2004/5, and the importance of regular employment in this state grew significantly over time (from under 25% to nearly 40%). In states such as Madhya Pradesh, Bihar, Chattisgarh and Maharashtra, the sector has still to make its presence felt.
At the all-India level, there has been a modest expansion of this sector over time.
However, importantly, it has become the main source of employment growth in rural areas. In the 1980s, of the nearly 40 million additional jobs generated, the majority (6 out of every 10) were in the farm sector. Between 1993/4 and 2004/5, non-farm employment growth had outstripped agriculture, as 6 of every 10 new jobs in rural India were generated in the non-farm sector. The largest increase in incremental employment attributed to the non-farm sector took place between 1999/0 and 2004/5.
Non-Farm Employment and Consumption Quintiles
The distinction between regular, casual and self-employment in the non-farm sector is well reflected in Tables 5a-5c, documenting the relationship between non-farm employment and consumption quintiles in each of the respective survey years.8 In all five survey years, regular non-farm employment occurred disproportionately in the top quintile of the per capita consumption distribution (Table 5a). While overall employment shares in regular non-farm employment hovered around 6% throughout this period, the relative frequency of such employment in the top quintile was two or more times higher, while in the bottom quintile it was below 3%.
Overall employment shares in casual non-farm activities are only slightly higher than for regular non-farm employment shares (Table 5b). But the distribution across consumption quintiles is quite different. Casual wage employment in the non-farm sector
8 Lanjouw and Shariff (2003) observe very similar patterns across income quintiles in NCAER data for 1993/4.
generally occurs most frequently in the lowest quintiles of the consumption distribution.
The odds of employment in casual non-farm wage labor are less than one in the top quintiles and greater than one in the bottom three quintiles. There is little evidence of systematic change in these patterns over time.
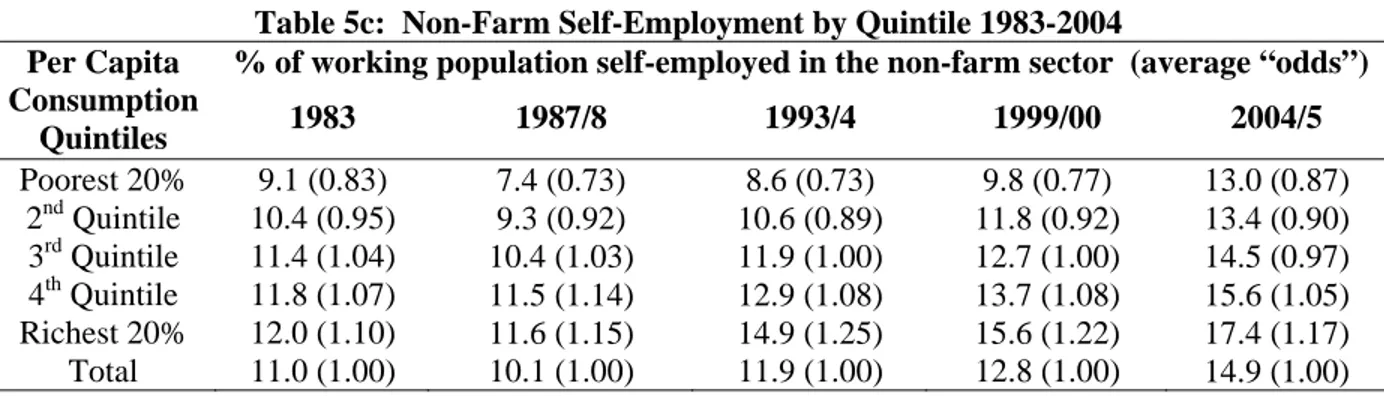
Non-farm self-employment activities tend to be more evenly distributed over the consumption distribution, indicating that both poor households as well as rich households are involved in such activities (Table 5c). On balance, however, the odds of self- employment in the non-farm sector are slightly higher in the top three quintiles of the consumption distribution suggesting that such activities are more frequent among the relatively better off. There is some suggestion that in the 2004/5 survey year the gradient between self-employment in the non-farm sector and consumption quintiles has weakened somewhat. While in this year the percentage of self-employed in the non-farm sector is still lowest in the bottom quintile, the odds of participation are higher than in the other survey years and analogously, the odds are somewhat lower in the top quintile.
The patterns of employment observed across the consumption distribution also tend to be repeated in terms of other dimensions of well-being such as education and caste status (Kijima and Lanjouw, 2005). Education levels and social status are generally highest among those with regular non-farm employment while casual non-farm employment is more common among the illiterate and scheduled caste and scheduled tribe households. Over time there is some suggestion that casual non-farm employment has become slightly more strongly correlated with higher education levels. This is consistent with gradually rising education levels in rural India over time, and a tendency for those with some education to crowd out the uneducated in casual non-farm employment (see further below).
Non-Farm Employment Probabilities
Of course, education and social status are not just of interest as intrinsic indicators of welfare, but are also likely to play an instrumental role in determining income or consumption levels – influencing for example, individuals’ access to non-farm opportunities. The relationship between occupational choice and household characteristics is explored more systematically in Appendix Tables 3-7 on the basis of
multinomial logit models of occupational choice for each survey year (Appendix Table 2 provides descriptive statistics of the explanatory variables employed in these models).
We employ the multinomial logit model to explore the individual and household characteristics that are associated with the probability of non-farm employment in rural India (see Greene, 1993 for a useful exposition of this model). We consider seven broad occupations in rural areas: agricultural casual wage employment; regular farm employment; cultivation; non-farm regular employment; non-farm casual wage (daily wage) employment; non-farm own-enterprise activities; and other (plus non-working).9 Our “explanatory” variables comprise a selection of individual and household characteristics. At the individual level we consider the age, educational status, and caste/religious status of each person.
At the household level, we have information on the size of the household to which each person belongs and the household’s per-capita landholding. The latter might proxy wealth and contacts, and thereby provide some indication of the extent to which individuals are better placed to take advantage of opportunities in the non-farm sector.10
The multinomial model requires that a particular occupational category be designated as the numeraire against which all results should be compared. We have chosen agricultural wage labour as the comparison group. This implies that parameter estimates for the categories which are included should be interpreted not as correlates of employment in a given occupational category, but as indicators of the strength of association of a particular explanatory variable with the respective occupational category relative to the same explanatory variable with agricultural labour. To ease interpretation we consider direct parameter estimates and then produce some derived tables that summarize the impact of specific explanatory variables.
The multinomial logit models confirm that relative to agricultural wage labor, the probability of employment in any of the three non-farm sub-sectors is consistently lower for those who belong to the scheduled castes and for those with no education. This
9 We concentrate in this analysis on reported principal occupation of males, and are unable to consider, as a result, the set of issues associated with combining farm with nonfarm activities during the course of, say, an agricultural year (with its associated peak and slack seasons).
10 It is often noted that the market for the purchase and sale of land is rather thin in rural India, as opposed to the market for landuse – tenancy (see Jayaraman and Lanjouw, 1999). Landholdings may therefore be reasonably exogenous in the kind of models estimated here.
pattern remains quite stable the five survey years. These findings are summarized in Tables 6 and 7 presenting the predicted probabilities of employment in the various occupations at mean values of the explanatory variables. For example, the first cell in Table 6 indicates that in 1983 the predicted probability of employment in agricultural labor would be about 34.6% if all individuals were scheduled castes or scheduled tribes (with education levels and other characteristics corresponding to the overall average in the population). This probability would fall to 23.4% if their caste status were switched to non-SC/ST. It is important to recognize that these are stylized probabilities – in reality SC/ST’s would have education levels and landholdings well below the national average as well. Table 6 indicates that the effect of caste status on regular non-farm employment probabilities appears to operate indirectly through the differential education and landholdings of SC/ST’s instead of directly. Holding these other characteristics constant (at their national average), predicted employment in regular non-farm employment is not markedly lower for SC/STs. With casual and self-employment in the non-farm sector, evidence of caste differences are more readily discernable. In general, there is little evidence of marked changes in the role of social status in determining occupational status over time.
Table 7 confirms the clear association of education with employment in non-farm activities. Predicted probabilities of regular non-farm employment in all five survey years increase markedly with education levels (at mean values of other characteristics), while they fall sharply in the case of agricultural labor, and more moderately in the case of casual non-farm employment. There is little evidence of a strong role for education in self-employment activities. Once again, this is possibly the consequence of the heterogeneity in the kind of self-employment activities that take place.
Finally, the multinomial models in Appendix Tables 3-7 also suggest that the probability of employment in regular non-farm activities and non-farm self-employment is significantly higher (relative to agricultural labor) for those with higher per-capita landholdings. Lanjouw and Stern (1998) argue, on the basis of a detailed village study in Uttar Pradesh, that information networks and ability to pay bribes are important determinants of access to the better-paying and more attractive non-farm jobs. It is possible that per-capita landholdings are proxying such assets here.
V. Non-Farm Employment, Poverty, and Agricultural Wages: A Regional Analysis We conclude the analysis in this paper by drawing on the considerable variation across NSS regions and over time to bring together the three strands of the analysis:
poverty, agricultural labor and non-farm employment. We construct an NSS region-level panel dataset based the 1983, 1993/4, and 2004/5 rounds of the NSS surveys. These three rounds have generally been met with broad endorsement as to underlying data quality, reliability and comparability. They span a period of broadly 20 years and, given that there are on average some 60 regions that make up the major states in India, also reflect considerable spatial heterogeneity. Our panel data set is based largely on data derived from the NSS survey and aggregated to the NSS region level, but we have also appended information on region-level agricultural productivity to the dataset, built up from district- level indicators of annual production, acreage, and prices of over 40 major crops available from official publications. 11 The database brings together non-farm employment, poverty and agricultural wage outcomes at the region-level with data on non-farm wages, urban consumption levels, per-capita landholdings and average education outcomes.
Framework
Our approach in this section is largely descriptive. We start with a regional analysis of the correlates of non-farm employment, asking to what extent the farm and non-farm sectors are to be seen as complements or as substitutes. We distinguish between types of non-farm employment (regular, casual and self-employment) as well as broad sectoral categories. We are interested in particular to see whether there are complementarities between non-farm employment growth and education outcomes.
We then turn to an analysis of the correlates of rural poverty and of rural agricultural wage rates. Our approach here builds on a framework developed in Datt and Ravallion (1998) in which a reduced-form specification for poverty is expressed as a
11 We are grateful to Himanshu for sharing his estimates of NSS region-level yields with us. These estimates are based on annual district-level data on crop production and acreage reported by the Ministry of Agriculture. Yields are measured as the value of total production per hectare of land devoted to over 40 main crops in the districts comprising an NSS region. Triennium averages of production and acreage around the survey year are used to smooth out annual fluctuations.
function of agricultural productivity and other variables such as stocks of skilled labor or inflationary shocks. Because of short-run stickiness or other imperfections in labor markets, a reduced form for poverty includes agricultural wages and prices as an additional regressor. By controlling for wages and prices, Datt and Ravallion isolate a
“direct” effect of agricultural productivity on poverty reduction from general equilibrium indirect effects that are felt through changes in wages and prices. Datt and Ravallion (1998) apply this framework using 24 rounds of NSS data covering a 35-year period between 1958 and 1994. In the present study our data span only three time periods, but we bring additional spatial variation to the analysis.
We build on the Datt and Ravallion framework by looking also at the role of the non- farm sector in reducing rural poverty in India. A natural starting point would be to include a measure of non-farm productivity in the reduced form specification for poverty.
Data limitations, however, mean that such a relation cannot be estimated. Some estimates of non-farm productivity are available, but these are only at the state-level and restricted to the organized manufacturing sector which leaves out the vast majority of rural non-farm jobs. Given the absence of non-farm productivity data, we proxy non- farm growth by employment in the non-farm sector. Given the suggestion that access to non-farm sector may be rationed on the basis of characteristics that do not favor the poor – noted in the previous section where we examined individual-level probabilities of non- farm employment – we consider inclusion of non-farm employment as a separate determinant of poverty reduction. Since overall non-farm employment may well contain important endogenous elements, we also consider separately the impacts of regular, salaried employment which is arguably less likely to suffer from endogeneity since a large share of regular jobs are in the public sector which is less affected by the local economy. In addition, we can enquire whether expansion of the sector is pro-poor on the margin. To that end, we present evidence on the marginal incidence of non-farm employment expansion based on an approach described in Lanjouw and Ravallion (1998).
Because our poverty regressions reveal a strong association between poverty reduction and agricultural wage rates we turn next to a question asked by Eswaran et al (2008), namely whether there is evidence of non-farm employment growth on
agricultural wages. To the extent that growth in non-farm employment leads to a general tightening of agricultural wage markets, one might expect to see a rise in agricultural wages in locations where the non-farm sector is expanding. This would then point to an indirect effect of non-farm employment on poverty reduction via its impact on wages.
Results: Correlates of Non-Farm Employment Growth
In Tables 8a and 8b we estimate the relationship between non-farm employment growth and changes in agricultural productivity. The first panel in each table reports the unconditional relationship, net of period effects captured by time dummies for 1993/4 and 2004/5. Non-farm employment growth is measured as the log of average number of non-farm workers per working age adult in each NSS region, and agricultural productivity growth is the log of yield as measured by the value of production of 43 main crops per hectare. The second panel of each table adds four additional explanatory variables: the log of region-level average casual non-farm wages; the log of average per capita urban consumption per region; region-level log per-capita landholdings; and the log of the region-level working population that has not completed primary school education. Motivation for the inclusion of these variables is as follows: Foster and Rosenzweig (2003 and 2004) emphasize that non-farm enterprises may be attracted to locations where reservation wages are low; we introduce casual non-farm wages as a proxy for such reservation wages. Average per capita urban consumption per region is included as a possible proxy for market size for rural non-farm products and services.
Per capita landholdings are intended to capture land abundance in the region – thereby proxying scope for agglomeration externalities. Finally our education variable is intended to capture the extent to which low education levels in rural area may act as a deterrent to rural non-farm employment growth.
Tables 8a and 8b are distinguished from each other only with respect to the way in which they control for unobserved location characteristics. In Table 8a, we estimate our models with state-level fixed effects. This implies that we allow both temporal variation as well as within-state region level variation to determine our parameter estimates. Given that we have far more spatial variation in our data than temporal variation, parameter estimates from the state-level fixed effects specifications are driven
largely by cross sectional variation. Table 8b replaces the state-level fixed effects with region-level fixed effects. In this specification we are able to control for unobserved region-level characteristics and variation arises largely from region-level changes over time.
In the first panel of Table 8a we can see that agricultural productivity is strongly associated with non-farm employment. Controlling for state-level characteristics, as well as year effects, we see that regions with higher agricultural productivity are associated with greater non-farm employment. This pattern holds true for all non-farm employment taken together, but also for sub “sectors” of the non-farm sector: regular and casual employment, although not self-employment. Considering sectors of activity, it appears that agricultural productivity is particularly strongly associated with growth in the non- farm manufacturing and commerce sectors, but not construction. When additional controls are added, the positive relationship between agricultural productivity and non- farm growth is significant only in the case of regular non-farm employment. Moreover, agricultural productivity growth is associated with a decline in construction employment.
This last observation is somewhat puzzling, but it may be that construction “booms”
occur at the expense of agriculture, in the sense that they involve the conversion of land out of agriculture into residential, retailing or industrial/manufacturing uses. In most models, urban consumption levels are strongly and positively associated with non-farm employment. Greater land abundance tends to reduce non-farm employment. An important finding is that regular non-farm employment tends to be lower in those regions where the share of poorly educated workers is greater. Regular non-farm employment thus seems to be particularly dependent on an educated workforce.
In broad terms thus, when we control for unobserved state but not region-level characteristics, we find that regions with higher agricultural productivity are also those where non-farm employment is greater. This finding is consistent with the thesis that there exist positive linkages from the agricultural sector to the non-farm sector (see for example Mellor and Lele, 1973).
This conclusion is tempered however, when we control for region-level fixed effects rather than just state-level fixed effects. We find now that overall non-farm employment, and also non-farm self-employment is negatively related to agricultural
productivity. This suggests that the non-farm sector, particularly non-farm self- employment, may function more as a safety net – acting to absorb labor in those regions where agricultural productivity has been declining – rather than being promoted by growth in the agriculture sector. The dissonance between the findings in Table 8a and 8b (top panel) can be understood in terms of the fact that in the former Table, cross-sectional variation across regions within states is allowed to determine the parameter estimate on yield. Such cross-sectional variation confirms that the non-farm sector tends to be more present in regions which are also productive agriculturally. The findings in Table 8b, however, suggest that growth in the non-farm sector appears to be more a response to declining agricultural productivity than a consequence of agricultural growth.
When we examine the fuller regional fixed effects specification (lower panel of Table 8b) the negative relationship between non-farm employment and yields is no longer significant. Apart from a strongly significant and positive parameter estimate on the dummy for 2004, indicating a markedly higher presence of non-farm employment in 2004 – in all “sectors” (with the notable exception of regular non-farm employment) – the only other statistically significant parameter estimate is on our human capital proxy in the regular non-farm employment model – indicating that regular non-farm employment growth has been slower in those regions where education levels have not improved. Note that although the region-level fixed effects specifications do not result in a large number of highly significant findings, the explanatory power of these models is markedly higher than of the state-level fixed effects models in Table 8a. This indicates that there are important region-level unobserved characteristics, and that models that fail to control for these adequately may draw conclusions about the drivers of non-farm employment growth that are non-robust.
Results: Correlates of Poverty Decline
We turn next to our second set of models and examine the relative role of agricultural productivity and non-farm employment as potential determinants of poverty reduction in rural areas. Table 9 presents results for four models divided into two sets depending on whether a state-level or region-level fixed effects specification is estimated.
In contrast to what was observed in the models presented in Tables 8a and 8b, parameter
estimates are generally stable across the state-level and region-level fixed effects specifications. Statistical significance also tends to survive the application of the more demanding region-level fixed effects specifications (with the exception of the year dummies). There is evidence of a strong and negative impact of agricultural wage growth on rural poverty. This confirms the widely noted relationship between agricultural wages and poverty in rural areas of India. Agricultural productivity, urban per capita expenditure and land abundance are also all strongly associated with lower rural poverty across all specifications.
A notable exception to the general pattern of robust parameter estimates pertains to the impact of the rural non-farm sector on poverty. In the state-level fixed effects specification, non-farm employment is positively associated with rural poverty (an effect that is attenuated by the interaction of non-farm employment with the share of the working age population with education below the primary completion level). This finding essentially says that within states, regions with more non-farm employment tend also to be those with higher poverty – a pattern consistent with the notion put forward by Foster and Rosenzweig (2003 and 2004) that non-farm enterprises may locate in settings where reservation wages are lower. When the same model is estimated with region-level fixed effects, however, the relationship is overturned: non-farm growth is associated with a reduction in poverty, and this effect is attenuated the larger the share of the working population with low education levels. Thus when we focus specifically on changes over time and abstract away from cross sectional variation across regions, poverty decline is observed to occur most rapidly in regions where the non-farm sector has grown (with the effect being weaker in regions where education levels are low).
We have argued above that inclusion of the non-farm employment variable in our reduced form poverty model may be defensible in a context where access to non-farm employment is rationed. Our earlier analysis of the correlates of non-farm employment at the individual level (summarized in Tables 6 and 7) indicated that characteristics such as caste, education, and wealth (proxied by land owned) may indeed influence access to non-farm employment, particularly the more highly remunerative regular non-farm jobs.
In general we noted that the poor were more likely to possess characteristics that
prevented them accessing non-farm jobs, particularly regular non-farm jobs. This raises the question of how non-farm employment growth might help to reduce poverty.
One possible explanation for our findings from the region-level fixed effects specification centers around the distinction between the average “incidence” of non-farm employment and the marginal incidence of such employment. Tables 5a-5c reveal that on average the poor are highly under represented among those with non-farm jobs. The average odds of regular non-farm employment are particularly low for the poorest quintile of the rural population (0.027 relative to 0.072 in 2004 – Table 5a). These patterns are echoed in the analysis of non-farm employment probabilities summarized in Tables 6 and 7. However, what such quantitative patterns fail to reveal is how these odds would change as the non-farm sector grew. Lanjouw and Ravallion (1998) consider this question in the context of public spending programs in rural India. They note the possibility of early capture by the rich at the onset of a particular public spending program which gradually becomes diluted and more pro-poor as the program continues to grow: the rich get first “dibs” on the public program, but then become satiated, and subsequent expansion of the program trickles down to the less well off. In such a setting the marginal incidence of the public program may be much less regressive than the average incidence (see Lanjouw and Ravallion 1999 for further discussion).
Lanjouw and Ravallion (1999) propose a method for estimating marginal incidence based on cross-sectional variation at the region level. Essentially they propose estimating five models, corresponding each to a particular quintile of the overall rural per capita consumption distribution, in which the region (and quintile) – specific incidence of a program is regressed on the overall state-level average incidence of the program. A different parameter estimate obtains for each quintile, and can be interpreted as the marginal odds of program participation (see Lanjouw and Ravallion, 1999, for details).
We apply this method to assess the marginal odds of non-farm employment in rural India, using the 2004 NSS survey data.
Table 10 presents our results. We consider first, in Table 10a, the incidence of regular non-farm employment. On average, just under 4% of working adults in the poorest quintile are employed in the regular non-farm sector. This compares to over 9%
of the overall adult working population, and translates into average odds of regular non-
farm employment of 38% – the poorest are roughly two-fifths as likely to have regular non-farm employment as the population on average. In contrast the richest quintile has average odds of regular non-farm employment of 187% – the rich are nearly twice as likely to have such employment as the population on average. We next ask what happens when we allow for the possibility that the incidence of non-farm employment may change as the overall regular non-farm sector expands. Based on the approach outlined above we find that the incidence of regular non-farm employment is more pro-poor on the margin than on average (marginal odds of 0.53 for the poorest quintile rather than average odds of 0.38). Similarly, we cannot reject that the marginal odds of regular non- farm employment for the richest quintile is the same as for the population on average (0.84 is not statistically significantly different from 1.00), while the average odds of employment by the rich in this sector is 1.87. These findings suggest that as the non-farm sector expands, there is a decline in the degree to which access by the poor is restricted;
gradually more of the poor are able to find such employment, and the sector gradually becomes less exclusively the preserve of the rich.
Table 10b indicates that the average incidence of casual wage non-farm employment is less markedly pro-rich than regular non-farm employment. Indeed, the average odds of casual wage non-farm employment for the bottom two quintiles is greater than one, indicating that the poor are more likely to be employed in this sub- sector than the population on average. Nonetheless, our marginal incidence estimates continue to indicate that on the margin the non-farm sector is more pro-poor than would be suggested by the average incidence: the marginal odds of casual wage non-farm employment for the bottom quintile is 1.50 compared to an average incidence of 1.39.
Growth in this sub-sector would thus be likely to engage a disproportionate number of the poor. Whether this would translate into a reduction in poverty would of course depend on incomes from this non-farm sub-sector. On average non-farm casual wages are not terribly high and so the increased engagement of the poor in this sector may not result in a marked decline in poverty. Because regular non-farm incomes are typically a good deal higher than alternative incomes for the poor (such as agricultural wages) the higher marginal incidence in this sub-sector does suggest that poverty would respond as regular non-farm opportunities expanded. Finally, Table 10c shows that the marginal odds of
non-farm self-employment are not much different from the average odds, and are nowhere significantly different from one, indicating that expansion or contraction of this particular sub-sector would not fall disproportionately on one or other segment of the per capita consumption distribution.
Results: Correlates of Agricultural Wages
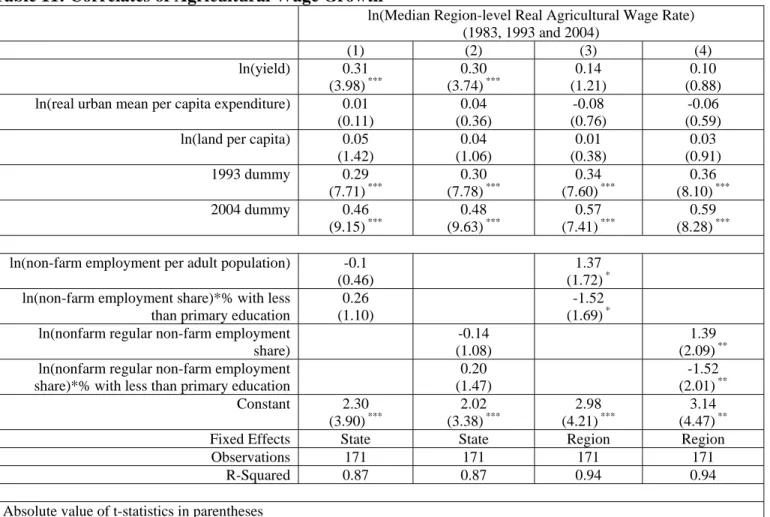
Our final set of models looks at the correlates of agricultural wage rates. Our intention here is to probe the general equilibrium impact of the non-farm sector on poverty. Table 11 presents two sets of models, with again each set respectively applying a state- or region-level fixed effects specification. Within each set we distinguish the models on the basis of the non-farm control variable, considering first total non-farm employment and then just regular non-farm employment.
In the state-level fixed effects specifications (models 1 and 2) there is evidence of a positive and significant relationship between agricultural productivity and agricultural wages. However, there is no evidence of any significant relationship between the non- farm sector and agricultural wages. When we allow for an important role for cross- sectional variation in driving parameter estimates, therefore, we see that agricultural wages rates are higher in those regions with greater agricultural productivity – controlling for unobserved state-level characteristics.
A different conclusion is reached when we turn to the region-level fixed effects specification. When we allow only region-level changes to drive parameter estimates, we cannot reject that growth in yields has no impact on agricultural wages, while growth in the non-farm sector is clearly associated with higher agricultural wages. Again the impact of the non-farm sector on wages is attenuated if education levels are particularly low. Presumably low education levels prevent agricultural workers from accessing non- farm jobs, and expansion of this sector then results in less tightening of the agricultural wage labor market.