Report No. 34818-MV
Maldives
Social Protection in the Maldives:
Options for Reforming Pensions and Safety Nets
April 25, 2006
Human Development Unit South Asia Region
Document of the World Bank
Public Disclosure AuthorizedPublic Disclosure AuthorizedPublic Disclosure AuthorizedPublic Disclosure Authorized
CURRENCY AND EQUIVALENT
The external value of Maldives Rufiyaa is fixed at Rf. 12.8 per 1 US Dollar since July 25, 2001 under a de facto fixed exchange rate policy vis-à-vis the US dollar.
Exchange Rate Effective = February 16, 2005 Currency Unit = Rufiyaa (Rf.)
US$1 = Rf. 12.86
FISCAL YEAR January 1 – December 31
ABBREVIATIONS AND ACRONYMS
CPI Consumer Price Index
DC Defined Contribution
DB Defined Benefit
EPI Expanded Program of Immunization GDP Gross Domestic Product
GoM Government of the Maldives
HIES Household Income and Expenditure Survey IHD Integrated Human Development Policy ILO International Labour Organization LFP Labor Force Participation
MDGs Millennium Development Goals
MHEESS Ministry of Higher Education, Employment and Social Security MGFDSS Ministry of Gender, Family Development and Social Security PPP Power Purchasing Parity
UN United Nations
VPA-1 1997/1998 Vulnerability and Poverty Household Survey VPA-2 2004 Vulnerability and Poverty Household Survey
Vice President : Praful Patel
Country Director : Alastair J. McKechnie
Sector Director : Julian F. Schweitzer
Sector Manager : Mansoora Rashid
Task Team Leader : Rasmus Heltberg
ACKNOWLEDGMENTS
This report was prepared by a team led by Rasmus Heltberg (Social Protection Economist, SASHD) and including, as main authors, Robert Palacios (Senior Pension Economist, SASHD), and Kalanidhi Subbarao (Consultant/Safety Nets Specialist). Qaiser Khan (Lead Specialist, SASHD) led this work during its conceptualization and early stages. Yvonne Sin (HDNSP) contributed to the technical work on pensions, and Anna-Marie Vilamovska (Consultant, SASHD), Aparajita Goyal (Consultant, SASHD), and Takahiro Atsuta (Consultant, SASHD) provided research assistance. The team would like to thank the Government of the Maldives for its cooperation and assistance in the preparation of this report, and in particular Dheena Moosa.
The team would also like to thank Alastair J. McKechnie (Country Director), Julian F.
Schweitzer (Sector Director), and Mansoora Rashid (Sector Manager) for their guidance and
support.
CONTENTS
Executive Summary ...i
1. Poverty and Vulnerability ...1
Growth and Human Development...1
Poverty: Level, Trends and Regional Distribution...2
Vulnerability to Shocks ...7
Who are the Poor and Vulnerable?...11
Conclusions ...12
2. The Pension System ...15
Current Pension System: Overview ...15
The Emerging Reform Package ...16
Fiscal Implications ...23
Conclusions ...33
3. Safety Nets ...35
Current Safety Net System: Overview ...35
Key Issues ...37
Options for Reform ...41
Targeting the Poor ...46
Implementation...49
Conclusions ...51
References ...53
Annex 1: Data sources...55
Annex 2: Determinants of poverty ...57
Annex 3: Incidence and average size of assistance and transfers...58
Annex 4: Targeting options...59
Categorical targeting ...59
Proxy Means Test...60
T
ABLES Table 1: Poverty Indicators 1997-2004, by Survey...4Table 2: Poverty-inequality decomposition. Maldives 1997/98-2004 ...5
Table 3: Cross-country comparison of poverty and inequality in South Asia...5
Table 4: Ownership of Consumer Durables by Consumption Terciles, 1998-2004 (in %) ...7
Table 5: Household transitions in and out of poverty, 1998-2004 (panel data sub-sample, covering atolls
only) ...7
Table 6: Food scarcity ...8
Table 7: Shocks experienced by households (past 6 years) ...9
Table 8: Sector of employment of household head by tercile of per capita expenditures...11
Table 9: Incidence of Select Demographic and Household Characteristics among the Chronically Poor, Transient Poor, and Non-Poor (In %, Panel Sample)...11
Table 10: Poverty rate and population size of select groups (in %) ...13
Table 11: Comparison of current and proposed pension system...34
Table 12: Expenditures on Social Assistance (pre-tsunami, and ...38
Table 13: Public Expenditure on pensions and social assistance in selected countries...39
Table 14: Distribution of Assistance and Transfers ...41
Table 15: Overview of Program Options for social assistance ...43
Table 16: Benefit levels and benefit adequacy...45
Table 17: Fiscal Cost of umbrella program (cash transfer to the poor), in different scenarios depending on benefit size and coverage ...49
Table 18: Data Sources and sample sizes...55
Table 19: Poverty Correlates: Probit Regression Results Using VPA1 (1997-98) and VPA2 (2004) Data57 Table 20: Incidence and average size of assistance and transfers ...58
Table 21: Simulation Results with a Fixed Budget Constraint of 0.5% of 2003 GDP ...59
Table 22: Simulation Results with a Fixed Budget Constraint of 1% of 2003 GDP ...59
Table 23: Illustration of Type I and II targeting errors ...62
F
IGURES Figure 1: Headcount poverty, 1997-2004...3Figure 2: Poverty headcount, by Region ...5
Figure 3: Inequality, by Region...5
Figure 4: Population and expenditure shares, by region ...6
Figure 5: Dominance Curve ...6
Figure 6: Growth inequality curve (Annual Percentage Growth in Per Capita Expenditure, per Percentile), Maldives ...6
Figure 7: Growth inequality curves for Male’ and atolls, 1997/98-2004...7
Figure 8: Demographic Dynamics ...10
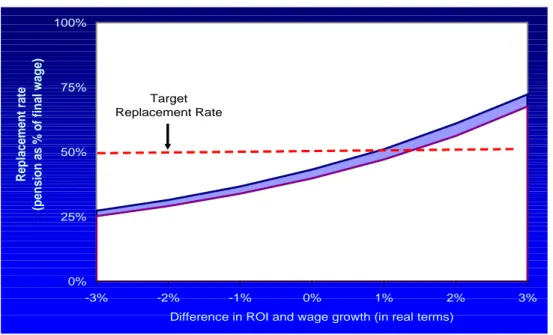
Figure 9: Replacement Rates under Different Rates of Return on Investments of the DC Scheme (for 14% contribution rate) ...18
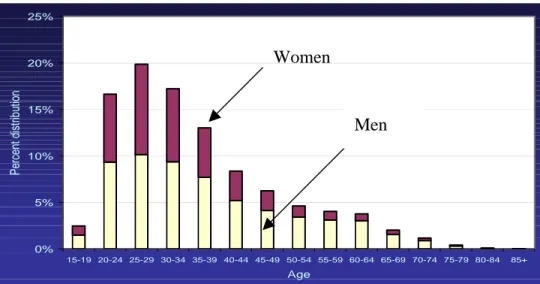
Figure 10: Age Distribution of Civil Servants, 2003 ...20
Figure 11: Cost of demogrant with different eligibility ages ...23
Figure 12: Cost of pension reform package proposed by Working Group ...24
Figure 13: Comparing present value of wages to pensions for those over age 65 ...25
Figure 14: Dispersion in replacement rates for civil servants retiring immediately after introduction of mandatory retirement age...26
Figure 15: Fiscal cost of current social safety net programs ...39
Figure 16: Overview of program options ...43
Figure 17: Profile of proposed benefits under poverty program (example) ...46
Figure 18: Targeting of a simulated proxy means test ...62
EXECUTIVE SUMMARY
1. The purpose of this report is to assist the Government of the Maldives in the design and implementation of social protection reforms, in particular for pensions and safety nets. The report includes an overview of poverty, risk and vulnerability in
Maldives as well as analysis of the role and effectiveness of pensions and social
assistance policies in helping poor households mitigate and cope with risks. Based on the analysis, the study delineates a menu of options for reform of the existing pension and social safety net system. The report has been prepared in close consultation with the Government of the Maldives.
2. The structure of the study follows the issues outlined above. Chapter 1 sets the stage with an overview of growth, inequality, poverty and vulnerability. Chapter 2
discusses old-age pensions and pension reform options. Chapter 3 covers safety nets (social assistance), while annexes describe the data sources and contain the analytical findings underpinning the recommendations. The executive summary details the main findings and policy options proposed in the report.
3. The study uses both household survey and administrative data. The main data sources used for this report are the Vulnerability and Poverty Surveys conducted in 1997/98 and 2004 and administrative data on programs and civil servants provided by the government. Other data sources such as the Household Income and Expenditure Survey and the census are also drawn upon.
4. The reform options will need to be phased in over time, depending on the fiscal situation. It should be noted, at the very outset, that the reform options proposed by this report involve non-negligible fiscal costs. The short term fiscal constraints facing the Government (as a result of the tsunami) may make it necessary to delay full
implementation of the package until such time as budget resources are available to absorb these incremental costs.
5. The reforms under consideration are substantial. Today, Maldives has some 1,000 recurrent recipients of social assistance (0.3 percent of the population). After the proposed reforms, this number could increase to perhaps 20,000 beneficiaries (6.7 percent of the population), of which 14,000 would receive the universal old-age benefit.
I. Growth, inequality and poverty
6. Over the past 25 years, Maldives has recorded impressive rates of economic growth and significant accomplishments in access to health care, education and other social amenities. GDP growth averaged 7.6 percent per year in the period 1976- 2004, and exceeded 10 percent per year for most of the 1980s, surpassing the
performance of all other South Asian economies. The Government’s drive to improve the
health and education systems had led Maldives to already achieve several of the Millennium Development Goals (MDGs).
7. Driven by this impressive growth and investment in human capital, poverty in the Maldives was halved from 1997 to 2004. Based on a poverty line of Rf. 15 per person per day, the share of the population living in poverty declined from 45 to 18.9 percent of the population (or 60,000 individuals) prior to the tsunami. The incidence of poverty is fairly shallow (i.e., many, but not all, of the poor are fairly close to the poverty line).
8. Despite the gains from growth, the Maldivian population is vulnerable to aggregate and individual shocks. Aggregate risks include the most recent impacts of the tsunami that caused large-scale loss of incomes and assets; potential future environmental risks of global warming leading to a rise in sea levels; and population aging. The most important individual shocks reported by survey results are health risks and joblessness, with health shocks causing the largest and most frequent income losses. The main coping
mechanisms used by the poor are informal insurance and own savings and income, andlimited public support (government support was used for coping in about 10 percent of shocks).
9. The transient poor who move in and out of poverty outnumber the
chronically poor, but the characteristics of both groups of poor are very similar. The highest incidence of poverty/vulnerability is in the Northern atolls, among household heads with little or no education, a large number of children, with elderly, and without
working members. Some (but not all) among widows and divorcees may also be highlyvulnerable. However, the largest group of the poor and vulnerable are households with
many children, and households whose heads are jobless and/or with little education and/or female-headed. Ninety percent of the poor live in the atolls; the Northern andNorth-Central regions alone now contain more than 60 percent of the country’s poor.
10. The Maldivian Government would like to develop an effective social protection system for its country that is consistent with its level of income and implementation capacity. Economic growth has been, and will continue to be, the
dominant factor in the reduction of poverty in Maldives, but the concentration of poverty in the Northern atolls and among particular population groups is of considerable concern.
Seeking to address these issues, the government is interested in reforming its pension system, and meeting the constitutional mandate to provide income support to all employed Maldivians. It is also interested in developing an effective safety net for the very poor, and those who may suffer poverty from catastrophic health shocks or from natural disasters. The evaluation of the current system and options for reform towards meeting these objectives are outlined below:
II. Old Age Security: The Pensions System
11. The pension system in the Maldives covers only public sector employees. It
has two components–the Civil Service Pension (CSP) scheme and the Government
Provident Fund (GPF). The Civil Service Pension (CSP) scheme is a non-contributory,
pay-as-you-go (PAYG) defined benefit (DB) arrangement covering approximately 26,000 government employees. Pensions are financed directly from the government budget.
12. The Maldives’ pension system is globally unique in the sense that pensions are paid out every 20 years of uninterrupted government service and there is no requirement to retire. Employees can continue to work for another 20 years and earn a second pension, and in a few cases, even a third. Therefore, with an accrual rate of 2.5 percent per year applied to the last wage in the 20 year period, pensioners in Maldives receive their benefits along with their earnings. The pensions are not indexed however, so their value in real terms declines over time depending on rates of inflation.
13. The Government Provident Fund (GPF) is a defined contribution (DC) arrangement with matching employee and government contributions of 5 percent of the employee’s basic wage each month. Participation is voluntary and withdrawals are allowed from their account for the education of their children, house construction and repair, health care and obligatory hajj. Recently, there have been massive withdrawals as the Government encouraged the purchase of housing. The scheme does not play a major role in providing a source of retirement income. On the other hand, it involves a
significant subsidy at a cost to the government for workers that participate.
Key issues
14. The system has two major deficiencies namely, inadequate retirement income and lack of safety net for the elderly.
15. First, the civil service pension scheme is not designed to produce a reasonable level of retirement income. Specifically, the civil service pension is calculated as 50 percent of basic salary after every 20 years of service. The pension calculation does not apply to overtime and allowances which on average comprise around 40 percent of total remuneration. Combined with the fact that the pension is not indexed, its value is very low compared to average incomes when the worker reaches old age. Therefore, the parameters of the scheme do not result in a secure and adequate stream of pension
income after a certain age. Given that the scheme does not stipulate a retirement age, it is not surprising that civil servants choose never to retire in the Maldives. A longer term issue is the possibility of extending coverage to the rest of the labor force.
16. The second deficiency is the absence of any safety net for the elderly in a country where only civil servants participate in a pension scheme of any kind. With more than two-thirds of the labor force lacking pension coverage, the only type of program likely to have any impact in the near future is one that involves transfers to the elderly not linked to their employment or contribution history. The design of this program would explicitly take into account reforms to the civil service pension scheme (as well as the reform of social assistance) given the overlap in the population being covered and the need to coordinate overall target pension levels.
Reform options
17. In order to develop an effective pension system, two objectives must be met:
(a) introducing a financially sustainable retirement savings scheme for civil servants (with the possibility of expanding to other formal sector workers in the future), and (b) providing a safety net for all elderly citizens in the Maldives.
18. The emerging reform plan – guided by a GoM Inter-ministerial task force – would separate redistributive and savings functions in two distinct programs:
•
The contributory plan would eventually replace current rules for civil
servants, first with the introduction of a retirement age and pension credit for past years of service and, eventually, by a defined contribution scheme. Contributions from workers and employers would finance this retirement savings scheme. The consumption smoothing scheme would, in the long run, be fully funded and defined contribution in nature and so avoids the creation of any new liabilities.
Past service can be credited through special recognition bonds that are redeemed at retirement in order to smooth fiscal flows
•
The non-contributory plan (often referred to as a ‘demogrant’) would pay all elderly citizens a poverty-level benefit. General government revenues would finance the demogrant. The government could consider applying a ‘pension test’
whereby other pension income is taken into account towards achieving the minimum standard.
19. Within this general approach, there are a number of choices to be made that have both social and financial implications. First, the contributory scheme can be phased in gradually and only for younger workers or for all workers simultaneously. In either case, the transition rules - and exactly how past service is credited towards the new scheme - must be determined. For the demogrant, the benefit level and method of
adjustment over time, clawback (targeting) mechanisms and eligibility age are all variables that affect the cost of the program and its ultimate impact.
20. The annual cost of the package depends on several factors. The upper bound estimate of 1.5-2.0 per cent of GDP per annum consists of three expenditures. The first is an untargeted demogrant at age 65 with an estimated cost of 0.7 per cent of GDP. The second cost arises when the government contributes on behalf of all civil servants to a segregated pension fund at a rate of 7 per cent of the wage bill or about 0.7 percent of GDP. The third cost is ambiguous. Mandatory retirement of all civil servants age 65 and above would generate a net savings since the average pension would be lower than the average wage for these individuals. However, if the number of civil servants was kept constant through new hiring, this would lead to a net cost of around 0.2-0.4 per cent of GDP.
21. Finally, while the reform package appears sound in terms of good practice,
the specific conditions of Maldives will require a highly customized implementation
of these programs. Implementation and management of reform will require several years
of capacity and institution building. Implementation will need to focus on issues related
to data management (for both the demogrant and the defined contribution scheme), and
choices regarding asset management, portfolio composition, and insurance benefits. Scale
in particular, will be a key consideration in these areas. Finally, reforms must take into
account the overall initial conditions especially with regard to the current or prevailing fiscal situation.
III. Protecting against Poverty and Vulnerability: Social Safety Net
22. The government has put in place several programs to protect the poor and vulnerable, including. (a) an absolute poverty scheme initiated in 2003 under which Rf.
500 a month is given to highly vulnerable individuals who are not able to eat more than one meal a day, not in possession of more than two sets of clothing, or are homeless, (b) assistance to obtain school materials for children of low income families, (c) assistance to seek medical treatment from hospitals in Maldives or abroad, (d) assistance to obtain assistive devices for the disabled and drugs for the mentally ill, and (e) institutional care for orphans and mentally disabled persons. These publicly funded programs are
supplemented by non-governmental support comprising remittances by extended family members and Zakat, the Islamic charitable support. Following the tsunami, the
government disbursed emergency income support to the affected population.
Approximately Rf. 50 million was disbursed to about 63,000 affected families. Tsunami assistance is temporary.
Key issues
23. The safety net programs are ad hoc and overlapping, with critical vulnerable groups omitted, and some benefits disbursed to individuals based on unverifiable
subjective judgments. The key objective of protecting the poor is therefore not being met.
24. The safety net system has very low coverage and funding relative to the level of income of the Maldives. Only 0.3 percent of the population and 1.6 percent of the poor are covered by recurrent transfers; and total safety net spending (outside of the tsunami benefit) is 0.2% of GDP. That said, it is important to note that adequate funding, without accompanying reforms in targeting efficiency will not be sufficient to ensure the benefits help alleviate poverty. However, without adequate funding it will not be possible to ensure a modern, well administered, and well-targeted safety net.
25. The distribution of publicly funded programs appears to be inequitable because substantive shares of current program benefits accrue to the best-off third of the population. Even private transfers, when analyzed as a whole, seem more or less equal across income groups, and not distributionally pro-poor.
Reform options
26. An effective safety net should protect the chronically and transitorily poor
households from sudden shortfalls in income and consumption induced by various
shocks. Safety nets help address chronic poverty, but also help the poor escape poverty
by improving or protecting their human capital against a variety of vulnerabilities
(stemming, for example, from disability, medical emergencies, macroeconomic shocks,
and natural disasters), and provide protection to the poor in case of difficult economic
reforms.
27. A number of reform options have been proposed in this report for the consideration of the government.
•
The government may consider a universal umbrella poverty targeted program that folds in most of the existing benefits and provides a single transfer to the very poor (identified and targeted as below). For specific vulnerable groups such as the poor disabled and the poor among the tsunami victims, rather than establishing separate programs or benefits for these groups, it is proposed that they be included in the umbrella poverty program.
•
The benefit can be flat lump sum, or can have two parts – a fixed ‘family allowance’ supplemented by a variable ‘child allowance’. The latter option would allow greater flexibility and fairness in addressing household vulnerability.
A threshold benefit level will need to be identified as an upper cap on benefits so that that work incentives are not compromised, and fiscal costs are sustainable (Rf.500-800 per month per household would seem an appropriate range).
However, the benefit could be increased in case of a catastrophic health shock.
The benefit should be indexed to inflation to ensure that protection is not eroded over time.
•
Several targeting options are available to the government. In particular, the report explored the potential of using a proxy means test in combination with community-based targeting. Based on the findings of selected simulations, the study recommends a combination of geographic targeting and community-based
identification of beneficiaries aided by guidelines that emphasize householdcharacteristics statistically associated with vulnerability.
28. Depending on options chosen by the government, the fiscal cost of the poverty-targeted assistance could range from 0.6-0.8 percent of GDP. This is in addition to the fiscal cost of the proposed pension reforms (demogrant and civil service pensions), which as mentioned ranges from 1.5-2 percent of GDP. Thus, the total fiscal cost of the pension and social assistance reforms discussed in this report ranges from 2-3 percent of GDP. These estimates will need refining as the details of the program are finalized. Reforms should be phased in once fiscal resources become available,
presumably once the impact of the tsunami has faded.29. Program implementation needs careful attention: It is important to ensure proper identification and targeting of the poor, and verifying, monitoring and updating records need to be decided. An agency to coordinate implementation, with adequate and well trained staff will also need to be appointed, and the new programs should be piloted before being scaled up to cover the entire country.
30. Monitoring and Evaluation of the program should be built in from the start
of the program to assess program performance, administration and alert the government
to implementation problems. This would help officials receive feedback on program
administration that should contribute to changes in programs or implementation
procedures as needed to enhance efficiency of administration.
Poverty and Vulnerability
To inform the design of social protection programs taken up later in this report, this first chapter reviews the macroeconomic and human development progress made by the Maldives over the past two decades, and evaluates the evolution, determinants and profile of poverty and vulnerability in the country. This chapter is organized as follows. The first section provides an analysis of growth and human development, while the second section outlines trends in poverty.
The third section discusses vulnerability to shocks and the final section delineates who are the poor and vulnerable in Maldives.
G
ROWTH ANDH
UMAND
EVELOPMENTThe Maldives has a very unique geography comprising a chain of Indian Ocean islands spread over a distance of 900 kilometers. The country has 1,190 islands, formed into 26 geographic atolls; 198 islands are inhabited. Population is roughly 300,000 people. One third of the inhabited islands have a population of less than 500, and 70 percent of the inhabited islands have a population of less than 1,000 inhabitants. The altitude of most of the islands is very low, not surpassing a meter above sea level. The country is also characterized by extreme paucity of land-based natural resources, including water and agricultural land.
Over the last quarter century, Maldives has transformed itself into the most prosperous country in South Asia. Notwithstanding the recent drop in GDP as a result of the tsunami, GDP growth averaged 7.6 percent per year in the period 1976-2004, and exceeded 10 percent per year for most of the 1980s. As a result, real GDP in 2004 was more than eight times higher than in 1971. The growth rate of per capita GDP averaged 3.4 percent per year from 1976 – 2003.
Growth was led primarily by the tourism and the fisheries sector. Tourism and fisheries are now the two largest sectors of the Maldivian economy, followed by agriculture; since the mid- 1990s these two sectors also account for roughly 40 percent of government revenues. For example in 2003 tourism accounted directly for 33 percent of GDP1, and indirectly some 60-70 percent of GDP. Tourism provided 14,000 jobs in 2000, fisheries 9,000 in a total labor force of 117,000, 26 percent of which is foreign (Ministry of Planning and National Development, 2003).
The performance of macroeconomic indicators (e.g., inflation, public debt management) has also been favorable—inflationary pressures have been under control, and measures to restrict the growth of public debt, on the rise since the late 1990s, have been relatively successful;
in 2003 public debt reached 46.5 percent of GDP, up from 40.9 percent in 2000, but the debt service remains manageable.2The main factor behind rising fiscal outlays has been efforts of the government to expand provision of public services (especially education and health) in the atolls.
The geography of the country militates against economies of scale, making the provision of public and private services and infrastructure very costly.
Maldives has also made tremendous progress in delivering social service. In health: over the period 1987-1997 the crude birth rate, the crude death rate and the infant mortality rate were halved and more than two decades were added to the life expectancy of Maldivians at birth.
While in 1970 the infant mortality rate per thousand live births was 159, in 2002 it fell to 55.
1World Bank. 2004. “Maldives: Country Economic Memorandum.” World Bank. Washington, DC.
2IBID. Thus far the government has sought resolution to this problem by broadening the revenue base. A number of measures have been under consideration including the increase in the bed tax, unchanged since 1988, that became effective in November, 2004.
Simultaneously, the crude death rate fell from 38 to 4 per thousand. Several debilitating diseases, such as malaria, childhood tuberculosis, filaria and leprosy have either been eradicated or have transmission rates close to zero. Child immunization has become nearly universal and vaccination coverage against hepatitis has reached 80 percent of the population. In education: Basic education is virtually universal; primary and lower secondary school attendance now exceeds 95 percent of the respective age groups, both for girls and boys, according to VPA-2. As for other services, far larger numbers of Maldivians today have access to potable water, sanitation and electricity than a decade ago
Maldives has already achieved several of the MDG target indicators, but still has some challenges ahead. The gender gap in school enrollment and literacy among those aged 15 to 24 is virtually non existent.3The proportion of births not attended by skilled health personnel has been reduced by three-quarters.4 MDG targets that emerge as potentially more problematic are in health and water: halving child malnutrition below the age of 5, halving the proportion of the population not having access to safe drinking water, reducing by three-quarter the maternal mortality ratio, and slowing the rate and reversing the spread of HIV/AIDS.
P
OVERTY: L
EVEL, T
RENDS ANDR
EGIONALD
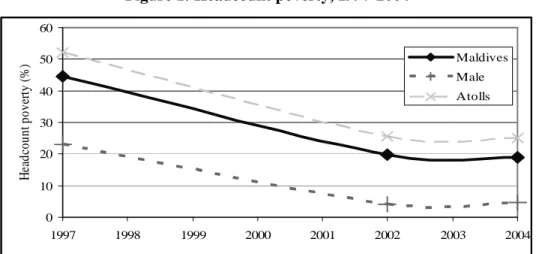
ISTRIBUTIONConsistent with economic growth and human development, poverty in the Maldives fell dramatically—by more than half—from 1997 to 2004. Based on a poverty line of Rf. 15 per person per day, headcount index of poverty (the share of the population consuming below the poverty line) declined from about 45 to less than 19 percent before the tsunami (see Figure 1).5 The tsunami will have resulted in sharply increased poverty in the affected atolls, at least temporarily, but data on this not yet available. The conclusion that poverty declined substantially before the tsunami does not depend on any specific poverty line. The dominance curve in Figure 5 shows that poverty incidence in VPA-2 is lower than in VPA-1 for any plausible poverty line.6
Most of the decline in poverty realized since 1997 took place prior to 2002/03 (Table 1).
In fact, some measures of poverty suggest a stagnation or slight increase in the short period from 2002/03 to July 2004. However, as outlined in Annex 1, the sample size of HIES was not very large, and so it is unclear to what extent the results are fully comparable. This should certainly not overshadow the basic finding that poverty decline was fast, deep, and fairly widespread in the late 1990s and early part of this decade.
3VPA-2
4Annual Reports of Ministry of Health.
5Annex 1 describes the data sources and the assumptions underlying these conclusions.
6A statistical dominance curve involves comparing the cumulative distribution functions for consumption for each of the survey years. One distribution “dominates” another if the income distribution function for that year lies to the right of the earlier year. If one finds that first-order dominance holds between two different years, it implies that all poverty measures, including the headcount, poverty gap, and squared poverty gap, in the first year are higher than in the second year for all poverty lines. In other words, in the case of Maldives, the decline in poverty between 1997 and 2004 is not an artifact driven by poverty lines; the decline is noticeable for all possible poverty lines.
Figure 1: Headcount poverty, 1997-2004
0 10 20 30 40 50 60
1997 1998 1999 2000 2001 2002 2003 2004
Headcountpoverty(%) Maldives
Male Atolls
Source: Preliminary Staff estimates based on VPA-1 and VPA-2.
The rapid improvement in living standards is reflected in a drastically expanded pattern of ownership of household durable goods.
Table 4 shows how ownership of durable goods has expanded in each tercile of the income distribution in the 1997/98-2004 period, resulting in a large decline in the inequality of durable good ownership; indeed, households in the bottom tercile have almost caught up with households in the top tercile with respect to ownership of low-cost durable goods such as fans and irons.
Poverty fell most in Male’—from 23 to less than 5 percent, and less sharply, but still significantly, in the atolls—52 to 25 percent in the atolls. As a result, even more than before, income poverty is now concentrated in the atolls (Table 1). The depth of poverty—a measure of how far the poor are below the poverty line—registered an equally impressive reduction, from 0.166 in 1997 to 0.057 in 2004 in Maldives overall. In 2004 the size of the poverty gap amounted to 0.9 percent of GDP—that is, assuming perfect targeting, it would cost 0.9 percent of national product to lift all of the poor to the poverty line. The severity of poverty also fell remarkably, suggesting the very poorest shared in growth.
Poverty declines were much greater in the South relative to the Northern and North- Central regions. The Northern region appears to have seen only modest decrease in poverty, and has now emerged as Maldives’ poorest region, followed by the North-Central region (Figure 2).
This differential change in poverty has altered the geographic pattern of poverty in the country.
Poverty now shows a declining pattern moving from North to South. In 2004, the Northern region with 16 percent of the country’s population accounted for just 10 percent of total expenditures while Male’, with 30 percent of the population accounted for more than 40 percent of expenditures (Figure 4).
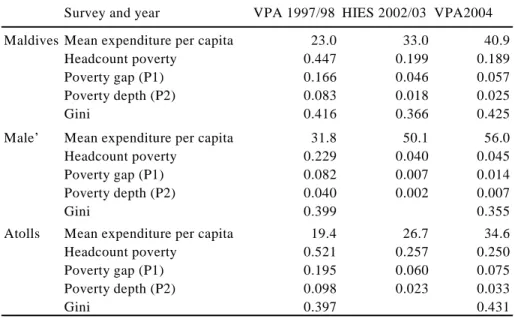
Table 1: Poverty Indicators 1997-2004, by Survey
Survey and year VPA 1997/98 HIES 2002/03 VPA2004
Maldives Mean expenditure per capita 23.0 33.0 40.9
Headcount poverty 0.447 0.199 0.189
Poverty gap (P1) 0.166 0.046 0.057
Poverty depth (P2) 0.083 0.018 0.025
Gini 0.416 0.366 0.425
Male’ Mean expenditure per capita 31.8 50.1 56.0
Headcount poverty 0.229 0.040 0.045
Poverty gap (P1) 0.082 0.007 0.014
Poverty depth (P2) 0.040 0.002 0.007
Gini 0.399 0.355
Atolls Mean expenditure per capita 19.4 26.7 34.6
Headcount poverty 0.521 0.257 0.250
Poverty gap (P1) 0.195 0.060 0.075
Poverty depth (P2) 0.098 0.023 0.033
Gini 0.397 0.431
Based on a measure of expenditures per capita that excludes housing costs.
Poverty measures based on a poverty line of Rf.15 per person per day ($1.15).
Source: Preliminary staff estimates.
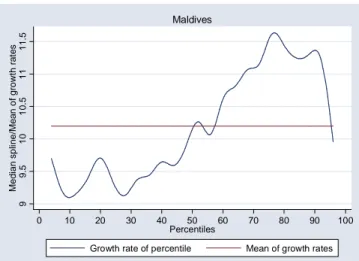
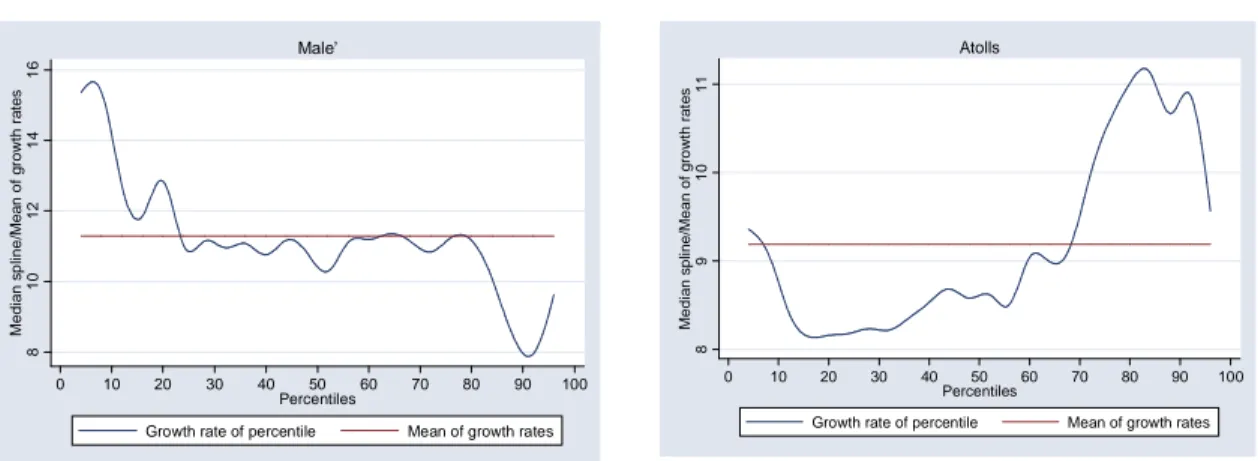
The different rates of decline of poverty represent differing growth rates. The growth- inequality curve (Figure 6) demonstrates that in the Maldives economic growth benefited households in all parts of the income distribution. Figure 6 shows that all percentiles experienced annualized growth rates in consumption between 9-11 percent, demonstrating that, although the top 40 percent of households nationally gained more than others, all regions of the country shared in growth—but not to an equal extent. The regional growth-inequality curves in Figure 7, show that, in the atolls, the top quarter of the population gained the most while in Male’ it was the bottom quarter that gained the most.
…and represent different changes in inequality. In Male’, inequality declined and complemented income growth in reducing poverty. In contrast, inequality rose in the atolls, but, the positive effect of growth substantially swamped the smaller negative effect of rising inequality. For the given growth rate, had inequality remained constant, poverty would have fallen somewhat faster in the atolls than at present (Table 2). Overall, for Maldives as a whole, poverty headcount would have fallen by 2 percentage points more than at present, had inequality not risen.
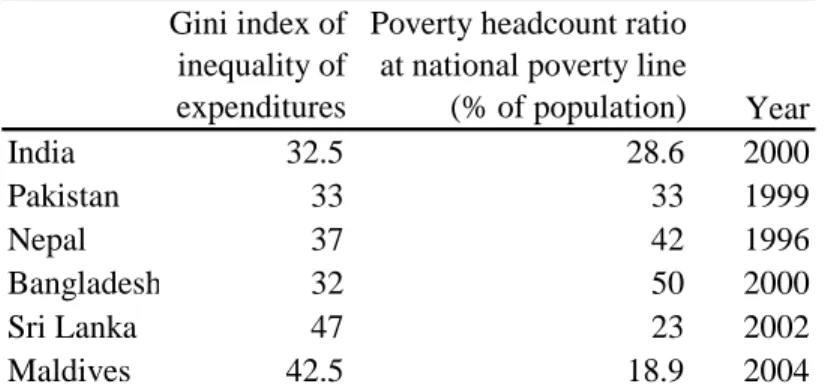
Compared to other South Asian countries, Maldives has lower poverty but fairly high inequality (It is most similar to Sri Lanka). Unlike other countries in the region, Maldives experienced a spectacular growth performance and was therefore able to reduce poverty despite increasing inequality. Nonetheless, high inequality in the atolls will remain a source of concern to policymakers (Figure 3). Fairly high but shallow poverty means that well-targeted social assistance can potentially have a large impact on poverty. Table 3 attempts a cross-country comparison of inequality and poverty (based on national poverty lines) for the countries of South
Asia. Since national poverty lines are set at different levels7 and expenditure measures are collected differently, the comparison should be treated with caution.
Table 2: Poverty-inequality decomposition. Maldives 1997/98-2004 Maldives Male’ Atolls Poverty rate in year 1 0.447 0.229 0.521 Poverty rate in year 2 0.189 0.045 0.25 Change in poverty -0.258 -0.184 -0.271 which can be decomposed into:
Growth component -0.277 -0.144 -0.316
Redistribution component 0.02 -0.04 0.045
Source: Staff estimates using the Ravallion-Chen methodology, based on average effects.
Table 3: Cross-country comparison of poverty and inequality in South Asia Gini index of
inequality of expenditures
Poverty headcount ratio at national poverty line
(% of population) Year
India 32.5 28.6 2000
Pakistan 33 33 1999
Nepal 37 42 1996
Bangladesh 32 50 2000
Sri Lanka 47 23 2002
Maldives 42.5 18.9 2004
Source: World Development Indicators (except for Maldives, where estimates from this report are used)
Figure 2: Poverty headcount, by Region Figure 3: Inequality, by Region
0 0.1 0.2 0.3 0.4 0.5 0.6 0.7
Male’ Northern North Central
Central South Central
Southern
Headcountpovertyrate
VPA1 VPA2
0 0.05 0.1 0.15 0.2 0.25 0.3 0.35 0.4 0.45 0.5
Male’ Northern North Central
Central South Central
Southern
Ginicoefficient
1997/98 2004
7Typically, poverty lines in South Asia are below the Rf. 15 per day used for Maldives, at least when compared at market exchange rates. Note that Maldives does not have a national poverty line. The Rf. 15 line used here is based on World Bank estimates and also conforms to earlier government practice.
Figure 4: Population and expenditure shares, by region
Figure 5: Dominance Curve
2004
0 5 10 15 20 25 30 35 40 45
Male’ Northern North Central
Central South Central
Southern
%
Population share Share of total expenditures
0.2.4.6.81PovertyincidencecurvesforVPA1andVPA2
0 10 20 30 40 50 60 70 80 90 100
Welfare indicator
Poverty incidence in 1997/98 Poverty in 2004 Expenditures per capita
Note: The figure shows poverty incidence for a range of potential poverty lines (0-100 Rf. per person per day). The upper line refers to VPA1 and the lower line refers to VPA2.
Source: Preliminary Staff estimates based on VPA-1 and VPA-2
.
Figure 6: Growth inequality curve (Annual Percentage Growth in Per Capita Expenditure, per Percentile), Maldives
99.51010.51111.5Medianspline/Meanofgrowthrates
0 10 20 30 40 50 60 70 80 90 100
Percentiles
Growth rate of percentile Mean of growth rates Maldives
Source: Preliminary Staff estimates based on VPA-1 and VPA-2
.
Figure 7: Growth inequality curves for Male’ and atolls, 1997/98-2004
810121416Medianspline/Meanofgrowthrates
0 10 20 30 40 50 60 70 80 90 100
Percentiles
Growth rate of percentile Mean of growth rates Male’
891011Medianspline/Meanofgrowthrates
0 10 20 30 40 50 60 70 80 90 100
Percentiles
Growth rate of percentile Mean of growth rates Atolls
Table 4: Ownership of Consumer Durables by Consumption Terciles, 1998-2004 (in %)
Source: Preliminary Staff estimates based on VPA-1 and VPA-2.
Table 5: Household transitions in and out of poverty, 1998-2004 (panel data sub-sample, covering atolls only)
Category Status Number of
Households
Share of Total (in %)
Chronic poor Poor in 1998 and also in 2004 184 15 Transient poor Poor in 1998 but not poor in 2004 419 34.5
Transient poor Not poor in 1998 but poor in 2004 104 8.5 Never poor Not poor in 1998 and also in 2004 509 42
Total 1216 100
Source: Staff calculations based on the panel subset of the VPA-1 and VPA-2 surveys.
Note: The panel data sub-sample cover atolls only, and the poverty rates of this sample are not nationally representative.
V
ULNERABILITY TOS
HOCKSFor most households, poverty is a transient phenomenon. Panel survey data shows that 15 percent of atoll households were chronically poor in the sense of remaining poor over the two samples under comparison, and nearly 43 percent of households in the atolls were transient poor.
That is, they moved in and out of poverty over the study period as a result of fluctuating incomes
Poorest tercile 2
ndtercile Richest tercile
Ownership of: VPA1 VPA2 VPA1 VPA2 VPA1 VPA2
Fan 26 91 33 97 45 97
Electric Iron 28 91 33 96 42 95
Fridge 5 27 9 45 17 62
Water pump 2 26 2 37 9 54
Telephone 0.3 8 0.7 20 4 18
Car 0 0.3 0 0.6 0.6 1
Dhoani (boat) 1 7 3 8 5 13
TV 7 76 9 84 16 84
(Table 5).8 Previous studies for other countries have also found much higher transitory than chronic poverty.9
Transitory poverty reflects household vulnerability to income shocks that affect individuals or communities. Of course, if households do not have access to finance, assets, private networks, or public programs to cushion shocks, transient shocks can lead households to chronic poverty; and can also lead chronic poor deeper into poverty.
Food scarcity was an important recent shock experienced by households. Respondents in the VPA-2 survey were asked about food shortages they had faced within the last 12 months—6 percent of households experienced such shortage of food (see Table 6). Those who suffered food shortage did so on average five times in the last year. The incidence and frequency of food scarcity was much higher in the lowest expenditure tercile (10% experienced shortage of food) as compared to the highest tercile (2.6% incidence). Incidence and frequency of food shortages was the same in Male’ and in atolls, suggesting that lack of income more than availability causes food scarcity.
Table 6: Food scarcity Share experiencing
food scarcity (%)
No. of times experienced in last 12 months (conditional on having a crisis) Tercile of expenditure:
Low 10.2 6.2
Medium 5.5 3.8
High 2.6 4.4
Region:
Atolls 6 5
Male’ 6.4 5.8
Total 6.1 5.2
Source: Preliminary Staff estimates based on VPA-2.
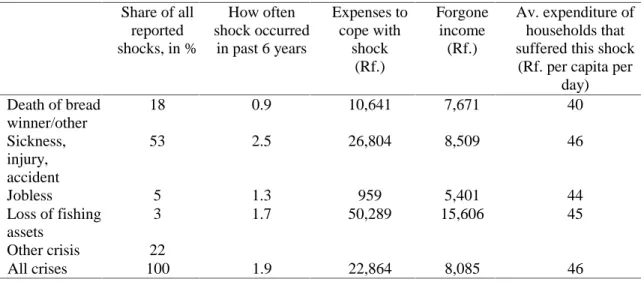
Health shocks and loss of main income earner were the most important adverse shocks to households over the past six-year period (the survey pre-ceded the tsunami, there is no doubt tsunami now would rank number one).10 Disease and injury constitute the most frequent type of shock (Table 7), experienced by 53 percent of those households that reported any major shock The five most often quoted health issues were viral fever, injury and accidents, stomach problems, and backbone injuries. Death of a household member is the second-most frequent shock (18% of reported shocks). Unemployment was reported as a major shock by 5 percent of
8A small but interesting data set is available for a panel of households for 1997-98 and 2004: these are households that were interviewed in VPA-1 and again for VPA-2. The panel data is drawn from all areas of the country except Male’
9Baulch and Hoddinott (2000) show that for several countries the proportions of the transient poor are much higher than the chronic poor.
10The Survey Respondents were also asked about any crisis (or shock) they had faced in the last 6 years.
The households that reported having experienced one of these shocks do not seem on average to be poorer or richer than other households. Only one-fifth of households reported a crisis; since one would have expected a higher incidence of crisis, it is possible that only relatively severe shocks were identified.
households, and the loss of boat or fishing equipment by 3 percent of households. Assorted other events account for the remaining 22 percent of shocks.
Table 7: Shocks experienced by households (past 6 years) Share of all
reported shocks, in %
How often shock occurred
in past 6 years
Expenses to cope with
shock (Rf.)
Forgone income
(Rf.)
Av. expenditure of households that suffered this shock
(Rf. per capita per day) Death of bread
winner/other
18 0.9 10,641 7,671 40
Sickness, injury, accident
53 2.5 26,804 8,509 46
Jobless 5 1.3 959 5,401 44
Loss of fishing assets
3 1.7 50,289 15,606 45
Other crisis 22
All crises 100 1.9 22,864 8,085 46 Source: Preliminary Staff estimates based on VPA-2.
Aside from individual or household specific shocks, Maldives also faces aggregate risks:
• The recent tsunami was a major natural disaster with national large-scale impacts. About 63,000 affected individuals were provided immediate cash assistance, many more were given in-kind relief, and some 3,700 households became homeless
• The very low height of the islands render the country exposed to global warming (over next 50 years) and potentially rising sea levels The government has begun addressing this long term risk via a focus island strategy emphasizing provision of high quality physical and social infrastructure at a few major regional centers. These focus islands would be equipped with sea walls and other protection against natural hazards
• Socio-geographic vulnerability arises from the small size and large dispersion of the population, which often resides in small communities of less than 500 people, which translate into diseconomies of scale (unit costs of social services are 4-5 times higher than those found in continental developing countries) and contributes to the large inequalities between Male’ and the atolls in income and services.11
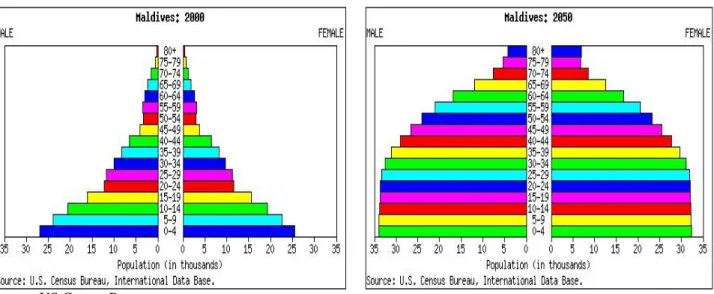
• The aging of the population, and associated poverty and health risks. The aging of the Maldivian society will occur as a consequence of the decreasing population growth rate and increasing longevity. The old-age dependency ratio12 currently at 5.8 percent is expected to stay constant until 2025, and to double between 2025 and 2050 to 11.6 percent, though it will still be below levels found in higher income countries and Sri Lanka (Figure 8). Ageing also implies a heightened risk of old-age poverty, something which the government is planning to address through pension reform.
11 Currently housing more than a quarter of the Maldivian population on a total land area of less than 2 square kilometres.
12 (defined as the number of persons aged 65 and older divided by the number of persons aged 15-64,
Figure 8: Demographic Dynamics
Source: US Census Bureau.
Households incur direct costs in terms of loss assets or medical fees, and forgone income as result of shocks. For example,
• Households incurred direct medical costs as well as income loss as a result of adverse health shocks. Households who suffer shocks have difficulty coping and are much more likely to experience temporary poverty (which can sometimes become chronic). For example, health shocks, and especially disease, are associated with very high expenditures (equivalent to 3 months consumption for an average family). Of those who reported being sick 88.2 percent visited a doctor, 3.6 percent a trained health worker, 2.6 percent a traditional healer. Disability was reported by some 2.4 percent of respondents (because of the phrasing of the question, this is likely to cover only extreme disabilities). Aside from medical expenditures, sickness also resulted in a major loss of income during the illness.
• A large rare shock such as the tsunami has resulted in massive loss of physical assets and forgone income. The total damages of the disaster are estimated at roughly US$470 million or close to 62 percent of GDP. About US$298 million of this are direct damages to physical assets, and the rest are indirect damages (such as lost tourism income).13 The cost of restoring the economy to its pre-tsunami level is estimated at US$406 million (WB/ADB/UN, 2005). The reconstruction phase is now getting under way, with efforts to rebuild damaged infrastructure and recover lost livelihoods.
13 The indirect damage estimates need to be treated with caution particularly when it comes to tourism and livelihood damages.
W
HO ARE THEP
OOR ANDV
ULNERABLE?
The highest incidence of poverty is experienced by households (a) with heads who do not work, (b) are women, (c) have little education, (d) with elderly members, and (e) have many children. The link between poverty and ‘not working’ is worrisome. Official unemployment, based in the narrow but standard definition of unemployment as “available for work, and actively searching for work within last week”, is low in the Maldives (2 percent). However, labor market participation is also very low, at 48 percent (62 percent for males and 33 percent for women).
Many of those not employed are likely to be ‘discouraged workers’ that have given up active job searching. Among those working, households head working in manufacturing, fishing or agricultural households have a higher incidence of poverty than those in government jobs (Table 8).
Table 8: Sector of employment of household head by tercile of per capita expenditures
% of households
Terciles of per capita expenditures Industry in which household head is working:
Low Medium High
Government 18 29 30
Fishing 25 17 10
Hotels/restaurants 3 5 6
Other services 2 4 6
Manufacturing 28 18 18
Construction 7 5 5
Transport 3 3 4
Agriculture 7 4 3
Other/not working 93 85 82
Chronic and transient poor are largely similar, with only a few differences: Among the chronic (vs. transient) poor, there is larger share of female heads of households, a higher proportion of unemployed heads, large families, and households headed by widows, divorcees, or elderly. Unemployment and lack of education of the household head show some correlation with chronic poverty (Table 9).
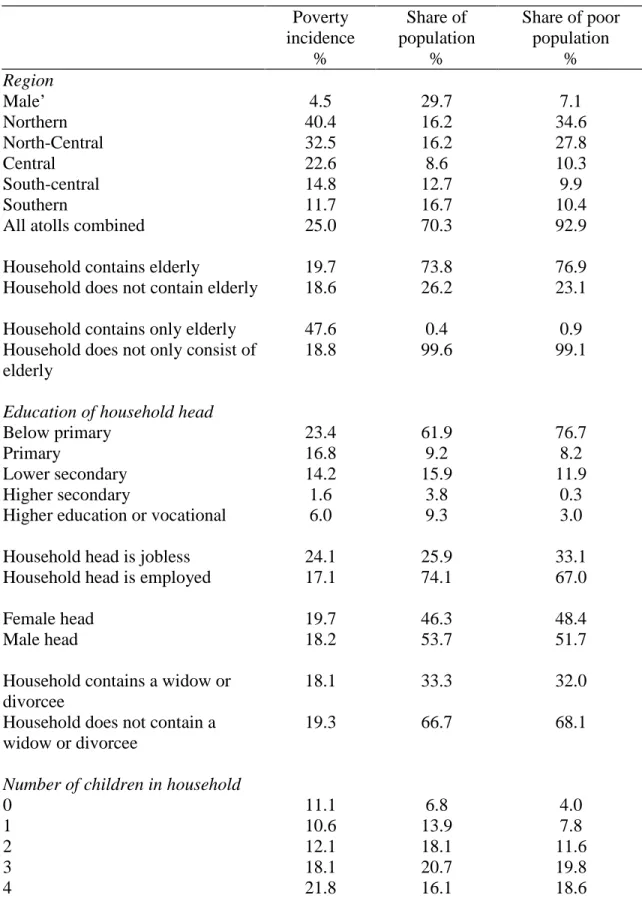
The largest group of poor is households who have a large number of children, who live in the atolls (especially in the Northern and North-Central region), and households whose head has little or no education (Table 10). The poorest tend to have no able-bodied members and receive no remittances.
Estimates of the determinants of poverty (and vulnerability) confirm the above characteristics of the poor. Using regression techniques to identify the most important correlates of poverty reveals that residence in the atolls (especially in the north), households with a higher dependency ratio (ratio of children to total family size), less education, households headed by the elderly (65+), women, and households with widows have a higher probability of living in poverty. These characteristics are constant across the two survey years (see Annex 2).
Table 9: Incidence of Select Demographic and Household Characteristics among the Chronically Poor, Transient Poor, and Non-Poor (In %, Panel Sample)
Characteristics Chronic poor
Transient Poor
Never poor
Female headed household 53 44 44
Household head uneducated 28 30 25
Household head unemployed 22 14 16
Household has at least one widow or one divorcee
30 30 21
Household contains elderly members 31 22 27
Household containing more than 6 children
11 8 6 Household head illiterate in English 96 92 86
Any household member migrated 18 0.2 21
Source: Preliminary Staff estimates based on the panel sub-sample covered in both VPA-1 and VPA-2.
How do households cope with poverty and vulnerability? Poor households use informal insurance as the main coping mechanism, followed by own income and government support.
Government support was used for coping in about 10 percent of the crises cited here. In many countries households faced with a shock respond in a manner that undermines their human or physical capital—taking children out of school, putting children to work, selling their major assets, incurring debt at usurious interest rates, and so on. There is little or no evidence to suggest that this type of behavior is widespread in the Maldives.
C
ONCLUSIONSThe main findings of this chapter are the following:
• Poverty has declined dramatically—by more than half—in Maldives during 1997/98- 2004 (from 45 to less than 19 percent). The incidence of poverty is now fairly shallow. The reduction in poverty was caused by high and widespread economic growth, which swamped an increase (from already quite high levels) in inequality over the same period.
• Poverty in the Maldives is now amongst the lowest in the region, but inequality appears to be amongst the highest in South Asia (although comparability is problematic). However, the positive effect of high economic growth has swamped substantially the small negative effect of rising inequality on poverty.
• The regional incidence of poverty is now concentrated in the atolls in the Northern part of the country. The incidence of poverty is much higher in the atolls than in Male’, and more pronounced in the North vs. the South of the country. The Northern and North-Central regions contain more than 60 percent of the country’s poor. The atolls realized a modest growth in inequality, which reduced the impact of growth on poverty reduction.
•
Aside from low income (poverty), the Maldivian population also suffers from
vulnerability arising out of aggregate shocks (natural disasters, aging) and
individual (household-specific shocks). Aggregate shocks include the most recent
impacts of the tsunami which caused enormous loss of incomes and assets and the
potential environmental risks of global warming and a rise in sea level. The most
important individual shocks are health risks and joblessness.
Table 10: Poverty rate and population size of select groups (in %)
Poverty
incidence
%
Share of population
%
Share of poor population
%
RegionMale’ 4.5 29.7 7.1
Northern 40.4 16.2 34.6
North-Central 32.5 16.2 27.8
Central 22.6 8.6 10.3
South-central 14.8 12.7 9.9
Southern 11.7 16.7 10.4
All atolls combined 25.0 70.3 92.9
Household contains elderly 19.7 73.8 76.9
Household does not contain elderly 18.6 26.2 23.1
Household contains only elderly 47.6 0.4 0.9 Household does not only consist of
elderly
18.8 99.6 99.1
Education of household head
Below primary 23.4 61.9 76.7
Primary 16.8 9.2 8.2
Lower secondary 14.2 15.9 11.9
Higher secondary 1.6 3.8 0.3
Higher education or vocational 6.0 9.3 3.0
Household head is jobless 24.1 25.9 33.1
Household head is employed 17.1 74.1 67.0
Female head 19.7 46.3 48.4
Male head 18.2 53.7 51.7
Household contains a widow or divorcee
18.1 33.3 32.0
Household does not contain a widow or divorcee
19.3 66.7 68.1
Number of children in household
0 11.1 6.8 4.0
1 10.6 13.9 7.8
2 12.1 18.1 11.6
3 18.1 20.7 19.8
4 21.8 16.1 18.6
Poverty incidence
%
Share of population
%
Share of poor population
%
5 28.2 9.9 14.8
6 34.5 6.8 12.4
7 20.1 3.9 4.2
8 or more 35.4 3.7 6.8
• The incidence of poverty and vulnerability is highest among households with little education, with a large number of children, with elderly, and those not working. Some (but not all) among widows and divorcees may also be highly vulnerable.
•
The largest share of the poor and vulnerable are households with many children, and households whose heads are unemployed and/or with little education and/or female-headed. Ninety percent of the poor live in the atolls, of which two thirds live in the northern atolls.
•
The main coping mechanisms used by the poor are informal insurance, and own savings and income. Government support was used for coping in about 10 percent of the crises.
These findings suggest that economic growth will be the main driver of poverty reduction, but not all regions and population groups may benefit from growth. Specifically, social protection policies will need to address the concentration of poverty in the Northern and North-Central atolls and to households without able-bodied members or other sources of income (such as remittances), poverty among the less educated, families with many children, and the elderly without family support. The design of social protection policies will have to address chronic poverty, but also take into account transient poverty caused by shocks to income (e.g., health shocks, hunger, and natural disasters), and the aging of the population.
The following two chapters build on the above findings and address two key social protection areas of government concern: providing old age income security through pensions (given high poverty rates among the elderly and an aging population), and safety nets for the poorest population groups.