Monitoring food waste
in the wholesale and retail sector in Germany
2019
- Food retail data -
Lia Orr, Thomas Schmidt
Thünen Working Paper 168a
The project on which this report is based was funded by the Federal Ministry of Food and Agriculture on the basis of a resolution of the German Bundestag as part of the Federal Program for Organic Farming and Other Forms of Sustainable Agriculture (Bundesprogramm Ökologischer Landbau und andere Formen nachhaltiger Landwirtschaft) under the funding code 2819NA019. The responsibility for the content of this publication lies with the authors.
We would like to thank the participating members of the Dialogue Forum on Wholesale and Retail (as part of the National Strategy to Reduce Food Waste) for their good cooperation and for providing the data.
We would also like to thank Frank Horst from the EHI Retail Institute for the constructive exchange as well as his support in collecting data.
We would also like to thank our partners at the Collaborating Centre on Sustainable Consumption and Production (CSCP) for their support throughout the preparation of this report.
M. Sc. Lia Orr
Phone: +49 531 596-5334 E-Mail: lia.orr@thuenen.de Dr. Thomas G. Schmidt Phone: +49 531 596-5314
E-Mail: thomas.schmidt@thuenen.de Johann Heinrich von Thünen Institute
Federal Research Institute for Rural Areas, Forestry and Fisheries Institute of Market Analysis
Bundesallee 63
D-38116 Braunschweig Thünen Working Paper 168a
Braunschweig/Germany, 18.02.2021
Zusammenfassung I
Zusammenfassung
Ziel dieses Berichts ist die Darstellung der - im Rahmen des Dialogforums Groß- und Einzelhandel, unter Mitwirkung der teilnehmenden Handelsunternehmen - erhobenen Daten zu Lebensmittelverlusten im Handelssektor in Deutschland für das Jahr 2019. Darüber hinaus sollen die Erkenntnisse der Erarbeitung einer Zielvereinbarung im Dialogforum Groß- und Einzelhandel (im Rahmen der Nationalen Strategie zur Reduzierung der Lebensmittelverschwendung) dienen. Im Dialogforum arbeiten die teilnehmenden Unternehmen gemeinsam darauf hin, dass das Nachhaltigkeitsziel 12.3 der Agenda 2030 (Halbierung der weltweiten Lebensmittelverschwendung pro Kopf auf Einzelhandels- und Verbraucherebene) erreicht werden kann. Der vorliegende Bericht dokumentiert den aktuellen Stand der Arbeiten im Dialogforum mit Ergebnissen des Lebensmitteleinzelhandels (LEH); die Zahlen des Lebensmittelgroßhandels sollen im nächsten Bericht ergänzt werden.
Die Berechnungen basieren auf freiwillig bereitgestellten Daten zu Umsatzverlusten (Abschreibungen) aus 13 Unternehmen des LEH sowie Cash und Carry Unternehmen1, die durch etwa 13.000 Verkaufsstellen repräsentiert werden. Die beteiligten Unternehmen decken einen Marktanteil des gesamten LEH in Deutschland von etwa 35 % ab2. Abschreibungen beinhalten sowohl Lebensmittelabfälle als auch umverteilte Lebensmittel, bspw. in Form von Lebensmittelspenden z.B. an soziale Einrichtungen oder für die Verwertung als Tierfutter sowie Bruch und Verlust. Die Daten unterscheiden nicht zwischen vermeidbaren und unvermeidbaren Lebensmittelabfällen. Zudem geben sie keine Auskunft über die tatsächliche Verwertung der im LEH nicht verkauften Lebensmittel, da die Erfassung buchhalterischen Zwecken dient. Die Hochrechnung der Abfälle an Lebensmitteln im deutschen LEH basiert auf einer sehr hohen Datenqualität; mit Abschreibungsdaten teils sehr großer Unternehmen und Umsatzzahlen des gesamten Sektors. In diesem Bericht wird erstmals in Deutschland der gesamte LEH berichtet (siehe Kapitel 4). Die Lebensmittelabfälle im gesamten LEH liegen für das Jahr 2019 hochgerechnet bei etwa 500 Tausend Tonnen, welche ungefähr 1,5 % des Lebensmittelumsatzes abbilden. Die hier ermittelten Lebensmittelabfälle betragen 290 Tausend Tonnen im organisierten LEH und 210 Tausend Tonnen im anderen LEH.
Eine Abgrenzung der Lebensmittelabfälle von Lebensmittelspenden und anderer Verwertung (z.B. zu Tierfutter), ist aufgrund von Datenlücken derzeit nur mithilfe von Schätzungen möglich - Expertenschätzung für diesen Bericht: 30 % der Verluste werden gespendet. Im Zuge weiterer Arbeiten müssen diese Mengen und die Verlustursachen analysiert werden, um daraus Reduzierungsmaßnahmen abzuleiten.
JEL: C31, L16, O14, R12.
Schlüsselwörter: Lebensmittelhandel, Monitoring, Lebensmittelabfälle, Lebensmittelverluste.
1 Cash und Carry-Unternehmen gehören zum Lebensmittelgroßhandel. In diesem Bericht für 2019 können LEH- und Cash und Carry-Daten in der Stichprobe nicht disaggregiert werden.
2 Der gesamte LEH umfasst in diesem Sinne: Supermärkte, Discounter und Verbrauchermärkte (organisierter LEH) sowie Drogeriemärkte, Getränkehandel, Bäckereien, Fleischereien, Tankstellen, Onlinehandel, Wochenmärkte und Verkaufsstände (anderer LEH).
Abstract II
Abstract
The aim of this report is to map food waste in the retail and wholesale sector in Germany for the year 2019 in the Dialogue Forum on Wholesale and Retail, with the participating retail companies. In addition, the findings regarding the data basis and data collection process are intended to support the development of an accord by the participants in the Dialogue Forum on Wholesale and Retail (as part of the National Strategy to Reduce Food Waste). In the Dialogue Forum, the participating companies work together to ensure that the sustainable development goal 12.3 (halving global food waste per capita at retail and consumer level) can be achieved. This report documents the current status of the work in the Dialogue Forum with results from the food retail sector; the figures from the food wholesale sector will be added in the next report.
The calculations are based on voluntarily provided data on turnover losses (markdowns) from 13 food retail and Cash and Carry companies represented by approximately 13,000 points of sale3. The participating companies cover a market share of the total retail sector in Germany of about 35 %4. Markdowns include both food waste and redistributed food, such as food donations or as animal feed, as well as breakage and loss. The data do not distinguish between preventable and non-preventable food waste. In addition, they do not provide information on the actual recovery of food not sold at the retail store, since the data collection serves accounting purposes. The extrapolation of food waste for the German retail food sector is based on a high data quality; with markdown data of partly very large companies and turnover figures of the entire sector. In this report, the entire food retail is reported for the first time in Germany (see chapter 4). Food waste in the entire retail sector is projected at around 500 thousand tons for 2019, which represents about 1.5 % of food turnover. The food waste in organised food retail identified here is 290 thousand tons and 210 thousand tons in the extended food retail.
Due to data gaps, it is currently only possible to distinguish food waste from food redistribution (i.e. food donations) and other utilisation (i.e. animal feed) based on estimates - expert estimate for this report: 30% of losses are donated. In the course of further work, these quantities and the causes of losses must be analysed in order to derive measures for reduction.
JEL: C31, L16, O14, R12.
Keywords: retail, wholesale, food waste, food loss, measurement, monitoring.
3 Cash and carry companies are part of food wholesale. In this report for 2019, food retail and Cash & Carry data cannot be disaggregated in the sample.
4 Here total food retailing includes: supermarkets, discounters and hypermarkets (organised food retail) as well as drugstores, beverage retailers, bakeries, butchers, gas stations, online retailing, weekly markets and sales stands (extended food retail).
Verzeichnisse III
Directories
Table of Content
Zusammenfassung I
Abstract II
Directories III
1 Introduction 1
2 Material und methods 3
2.1 Definition of terms used 3
2.2 Data basis 4
2.3 Conversion 5
2.4 Projection 6
3 Results 7
3.1 Food retail 7
3.1.1 Organised retail 8
3.1.2 Extended retail 10
3.1.3 Total food retail sector 10
3.2 Wholesale 11
4 Results in the context of previous work 12
4.1 Placing food waste from food retail in the national context 12
4.2 Comparison of waste studies in food retail 13
5 Conclusion 17
Literature 18
Appendix 19
A.1 Original Data 19
A.2 Projection 20
Verzeichnisse IV
List of Figures
Figure 1 Accounting of losses in food retail and wholesale 2
Figure 2 Loss rates in the different product groups 7
Figure 3 Contributions to food banks and similar organisations 9
Figure 4 Food Waste Hierarchy 13
Figure 5 Different studies on losses and donations in food retail 14
List of Tables
Table 1 Conversion of monetary values into weights 6
Table 2 Overview of turnover losses and losses in tonnes in organised retail 8 Table 3 Turnover losses and losses in tonnes in the entire food retail sector 10
Table 4 Loss data according to commodity groups 19
Table 5 Contributions to food banks and similar organisations 19 Table 6 Food turnover by establishment type for 2015 and 2019 20 Table 7 Food turnover and turnover losses by type of business in 2019 21
List of abbreviations
B
BMEL Bundesministerium für Ernährung und Landwirtschaft C
CSCP Collaborating Centre on Sustainable Consumption and Production E
EHI EHI Retail Institute e. V.
EU Europäische Union
S
SDG(s) Sustainable Development Goal(s) V
UN United Nations
Veranlassung 1
1 Introduction
As part of the National Strategy to Reduce Food Waste, the Dialogue Forum on Wholesale and Retail was initiated (BMEL 2019). It aims to jointly operationalize the Sustainable Development Goal (SDG) 12.3 for the wholesale and retail sector and to enable its implementation (UN 2015). In the declaration of participation in the Dialogue Forum the member companies have agreed to take measures to improve the data and to map food waste and redistribution in the wholesale and retail sector over a longer period of time. Enabling the participants to develop and agree on sector-specific targets up to 2030 as well as suitable formats to monitor the implementation of actions and success towards the targets.
Together with the retail companies, the relevant associations and the EHI Retail Institute, the Thünen Institute developed a concept to generate a representative data set and improve the significance of the results. On this basis, data for 2019 was provided and analysed. During the project period of the Dialogue Forum (until August 2022), data collection and analysis will be optimized as necessary so that future data can be compared with those presented in this report. This data set would make it possible to report the volume of food waste in the retail and wholesale sector to the European Union for Germany. In addition, monitoring and consideration of the redistribution of food products would enable further efficient reduction measures to be derived from the existing measures.
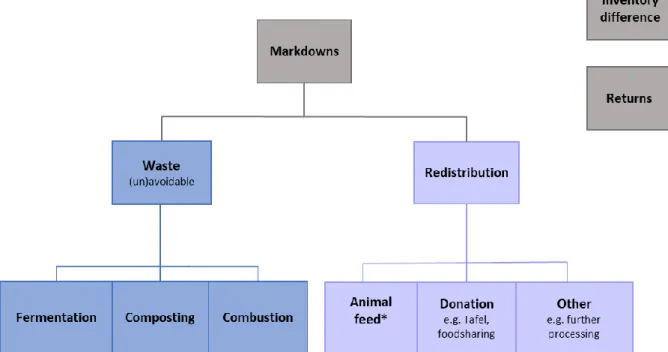
The EU reporting and German Sustainability Strategy only demand food waste to be reported (shown in red in Figure 1). This does not include unsold food that is redistributed to animal feed or donated to charitable organizations (shown in green).
Veranlassung 2
Figure 1 Accounting of losses in food retail and wholesale
* Animal feed: For animal feed, a distinction is made between use for livestock and other animals. According to the EU Waste Directive, only the further use for livestock counts as redistribution.
Source: Own classification.
The aim of the Dialogue Forum on Wholesale and Retail is to improve the data situation. The report presented was prepared on the basis of markdowns – this includes all food products that are no longer saleable. Quantification via this is considered a practical methodology associated with high informative value (shown in blue in Figure 1) (Orr and Schmidt 2020). A next step in the work of the Dialogue Forum will be to collect data on redistribution, e.g., as donations, more precisely. Therefore, the inclusion of these additional categories to food waste is essential for a comprehensive picture. Some of the so-called inventory differences, which can occur due to theft are not recorded separately in this report. However, these account for a very small proportion and can therefore be neglected5. In some cases, returns are also not recorded separately and are therefore not considered (see section 2.1).
The aim is to update this report annually. This will allow recording the trend of food waste as well as redistribution over time and thus enable appropriate measures to be taken with regard to achieving SDG 12.3.
5 Expert opinion from Frank Horst (EHI Retail Institute)
Material und Methoden 3
2 Material und methods
2.1 Definition of terms used
Markdowns
In order to capture all products no longer available for sale, the companies' markdowns were collected and evaluated. Each company records markdowns in its own – party very different - IT-systems. These generally include almost all products that are no longer saleable. These include:
• Food waste: Food waste includes all food that is disposed of and incinerated, fermented, or composted.
• Food donations: Such products that could not be sold but are donated to charitable institutions and thus are used for the purpose of nourishing people.
• Redistribution to animal feed.
No distinction is made between products that are still fit for human consumption and those that are spoiled. Consequently, it is not possible to give an estimate of the proportion of products still suitable for human consumption on the basis of markdowns. In order to avoid food waste, parts of the food products are allocated to further utilization before they become markdowns, including utilization concepts such as the production of jams or soups and salads from unsold fruit and vegetables. Another goal of the Dialogue Forum is to improve the data quality for reporting the share of donations and other redistribution.
In some cases, returns were also not considered. These include all products that were not sold and were returned to the supplier. Inventory differences, which can arise due to theft, were also not considered.
Food trade - retail and wholesale
Food trade can be divided into retail and wholesale.
The food retail sector is a sector with very different types of businesses, which also set their product range and priorities differently. In the following, food retail is divided into two areas:
The organised food retail as well as the extended food retail.
Organised food retail is defined as supermarkets, discount stores and hypermarkets. The other types of business are referred to as extended food retail. This includes drugstores, service stations, bakeries, butchers, online retailers, beverage store, sales stands and "other"
Material und Methoden 4
(e.g. kiosks, specialty stores). The category "other" will not be considered further in the following, as no statement can be made on the nature of the market due to a lack of statistics.
There is no uniform definition of food wholesale (Lebersorger and Schneider 2014), especially with regard to the boundaries of food wholesale. Wholesalers are those who sell products in their own name to other buyers (e.g., commercial businesses), while retailers sell goods to the consumers (The Nielsen Company 2017). Wholesale can be divided into pick-up (incl. cash and carry) and delivery wholesale.
2.2 Data basis
The data was analysed in the two following sections: (1) First, the sample in the retail sector and cash and carry companies was evaluated to calculate the loss rates. (2) Then, the turnover figures of the various types of businesses in the retail sector were used for the projection on a national level.
Together with the members of the Dialog Forum Wholesale and Retail, it was discussed which data can be used for the calculation of food waste and redistribution – the main two conditions were that the data was easily accessible (preference: already available in all companies) and the data had highly informative value. By using the markdowns from the companies, a high data quality can be ensured with relatively little effort. This is very sensitive company data and the protection of company secrets must not be compromised. The separate collection of waste data was considered to be too imprecise for an evaluation of measures and to be disproportionately costly by some participants in the Dialogue Forum.
The data basis for 2019 are markdowns from 13 companies in the food retail and cash and carry sectors. The companies are represented by more than 13,000 sales points and have a food turnover of around 72 billion euros6. Depending on the market definition (organised or extended retail), the participating companies cover 35-50% of food turnover in Germany. Such an extensive data basis has only been achieved in very few studies from other countries (e.g.
in Austria, Lebersorger and Schneider 2014).
On the basis of the very differently structured company data, the entire food assortment could be aggregated into five product groups: (1) fruit and vegetables, (2) dairy products and convenience, (3) bread and bakery products, (4) meat, fish and poultry, and (5) other food products (frozen goods, beverages, dry goods). Some companies provided data by individual products, others aggregated into product groups, some in multi-level product group classification.
Data security plays a special role due to the high confidentiality of the data, which was only shared for the intended use. The companies' markdowns are therefore encrypted and stored
6 Cash and carry companies are part of food wholesale. In this report for 2019, food retail and Cash & Carry data cannot be disaggregated in the sample.
Material und Methoden 5
on a protected data carrier, where they are also processed. The data were collected and analysed partly at the EHI Retail Institute and partly at the Thünen Institute. After receiving the data, they were first subject of a plausibility check. In the case of errors and strongly deviating values, consultations were held to verify and, if necessary, correct them. Only then were the analyses and the necessary conversions and extrapolations carried out.
Throughout the report, only aggregated results from data of several companies as well as projections are presented.
2.3 Conversion
The data on food waste in the retail and wholesale sector should also include weight values, which give an impression of the volume and physical quantity, in addition to turnover values, which are relevant primarily from a business management perspective. This also plays a role for the international indicator for operationalizing SDG 12.3, EU reporting, and the German Sustainability Strategy, as the data for these must be reported in tons of fresh mass.
The data was mainly recorded in turnover values (gross values incl. VAT in euros) and in a few cases supplemented with weight data (kilograms). Weight information is only available to the extent that there is data on this in some of the companies' IT systems and it does not relate to products that are recorded in units and therefore no weight information is available. In the future, missing weight information for piece goods can be added manually via estimated weights or average weights and thus be included in the data basis.
Since very few companies are able to provide weight data, a systematic conversion was carried out using average kilo prices for the individual product groups. For the conversion, ten companies calculated average kilo prices for seven product groups7. From each of these product groups, a weighted average kilo price was calculated for the product groups from at least 20 of the "markdown-strongest" items. The calculation of the average kilo prices thus included around 1,400 individual prices of the "highest markdown" items. In order to calculate conversion factors, average values for five product groups were used from all the information provided by the companies (see table 1). The product groups frozen goods, beverages and dry goods are summarized below in the category "Other food products".
7 bread and bakery products, meat, fish and poultry (self-service and service), dairy products and convenience (cheese, refrigerated articles, etc.) fruit and vegetables, frozen goods (meat, fish, bakery products, ready meals, etc.), beverages (non-alcoholic beverages, beer, wine/sparkling wine, spirits), dry goods (nutrients, confectionery, canned food, etc.)
Material und Methoden 6
Table 1 Conversion of monetary values into weights Product groups
Minimum [€/kg]
Maximum [€/kg]
Conversion factor (weighted average)
[€/kg]
Bread and bakery products 2.06 6.93 4.47
Meat, fish and poultry 3.04 12.74 8.41
Dairy products and convenience 5.87 20.15 10.23
Fruit and vegetables 2.57 7.64 4.47
Other food products 4.28 10.06 8.67
Mean 5.90 €/kg
Source: Own calculation according to the Dialogue Forum 2019.
2.4 Projection
Based on the operational data in this report, projections were made for the entire retail sector in order to be able to make statements about the retail sector. The projection was carried out for the entire retail sector, with the organized food retail sector being considered separately.
For this purpose, the turnover data of food products from the various types of businesses were used. Based on the sample of food turnover of 72 billion euros, a projection was made to the entire retail sector of 187.98 billion euros in food turnover (organised food retail 141.63 billion euros) (for the calculation of food turnover, see Appendix A.2).
Assigned to the entire retail sector are: Supermarkets, discounters and hypermarkets (organised retail) as well as drugstores, beverage stores, bakeries, butchers, gas stations, online retailing, market and sales stands (extended retail). The projection was calculated individually for all types of businesses - in line with the available statistics, the following assumptions were made for the calculation:
• Ratio of net to gross values: 1 to 1.08, i.e. 8 % as an averaged VAT rate (7 % for basic food products, for others such as alcoholic beverages 19 %).
• Conversion of total to food turnover: Where statistics existed on the distribution of turnover for the various product groups, these were added. In organised food retail, the results of the presented data were used (79 % of turnover from food). In the case of two types of businesses, it was not possible to subdivide the product groups, which is why average values were used.
• Where turnover data from 2019 were missing, these were estimated using trend analyses.
• In order to calculate the turnover losses of the product groups, the product groups from the turnover statistics used had to be assigned to the product groups used in the Dialogue Forum Wholesale and Retail.
For a more detailed presentation of the calculations by business type, see Appendix A.2.
Ergebnisse 7
3 Results
3.1 Food retail
For the entire food retail sector in Germany, markdowns result in a projected loss of turnover of 4.1 billion euros. In the organised food retail sector, turnover losses amount to about 2.49 billion euros. This corresponds to a share of 1.76 % of food turnover. This statement is based on the above-mentioned assumptions on weight calculation and projection.
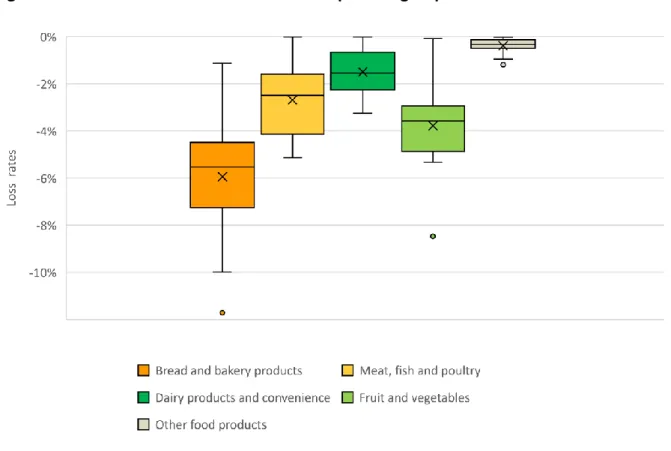
Different loss rates were measured in the different product groups (see figure 2 and supplementary table 5 in the appendix). The influence on the result of the total losses varies depending on the share of turnover of the respective product group.
Figure 2 Loss rates in the different product groups
Source: Own representation according to the Dialogue Forum 2019. The crosses mark the mean value, the dots represent outliers.
The low loss rates in the product group other food products8 (0.02 - 0.95 %) is not surprising due to the comparatively long shelf life in this product group. The high loss rates in the product group fruit and vegetables (0.08 - 5.33 %) can be attributed to the comparatively short shelf
8 Frozen goods, beverages, dry goods
Ergebnisse 8
life. Bread and bakery products also have a relatively high loss rate (1.13 - 9.99 %). The range can be explained, among other things, by the fact that the products in this product group have very different shelf life - self-service bread, baking counters as well as self-service fresh counters. The high loss rates for meat, fish and poultry (0.02 - 5.19 %) are partly due to the relatively high average price per kilo, as a lower quantity leads to higher turnover losses.
3.1.1 Organised retail
Since the organised retail can be represented particularly well by the participating companies, it will first be considered separately from the entire retail sector. As already mentioned in the definitions in chapter 2.1, returns and inventory differences are partly not included. Food donations are included in the following figures (see table 2). First, the turnover losses were calculated based on the turnover shares as well as the turnover losses of the product groups.
The turnover losses were converted into weights as shown in chapter 2.3.
Table 2 Overview of turnover losses and losses in tonnes in organised retail Turnover in product
groups [billion Euro]
Turnover losses [%]
Turnover losses [billion Euro]
Losses [tonnes]
Bread and bakery
products 7.59 - 6.18
- 0.47 - 103,452
Meat, fish and poultry 20.07 - 2.81 - 0.56 -65,192
Dairy products and
convenience 25.47 - 1.61 - 0.41 -39,653
Fruit and vegetables 19.73 - 4.26 - 0.84 -18,.812
Other food products 68.77 - 0.30 - 0.21 -23,670
Total 141.63 Mrd. € - 1.76 % - 2.49 Mrd. € - 417,780 t
Source: Own calculations according to the Dialogue Forum 2019.
Fruit and vegetables are the product groups with the most losses, both in monetary terms and in terms of mass, followed by bread and bakery products. As can be concluded from the percentage losses, the commodity group other food products also has the lowest losses after conversion into weight.
About 30 % of the markdowns are donated to charitable institutions (expert estimate9). Of these, the product group fruit and vegetables has the highest share of donations at around 65 %, followed by dairy products and other food products at around 35 % share of donations.
Meat, fish and poultry as well as bread and bakery products were donated between 12 and 15 % on average (see figure 3 and supplementary Annex A.1 table 6).
9 Expert opinion from Frank Horst (EHI Retail Institute). The statement is based on sample surveys from 2018.
Ergebnisse 9
Of the write-offs within the commodity groups, the fruit and vegetables has the highest share of donations with about 65 %, so 65 % of the write-offs were donated here, followed by dairy products as well as other foodstuffs with about 35 % share of donations. Of the write-offs in the product groups meat, fish and poultry as well as bread and bakery products, on average between 12 and 15 % were donated.
A numerically exact recording of donations is currently not carried out in the food retail sector.
Figure 3 Contributions to food banks and similar organisations
Source: Own representation according to expert estimate by Frank Horst (EHI Retail Institute), based on samples from 2018.
Since the food that is passed on largely fulfils its intended purpose of feeding people, it should not count as food waste. Due to a lack of data, it is currently not possible to make a statement on the further redistribution to animal feed from the total amount of waste. If the total amount of markdowns is considered and donations are deducted, the food waste in terms of value in organised retail is estimated to be about 1.74 billion euros, which corresponds to about 290 thousand tonnes.
Not all food waste that is recorded in the markdowns can be completely avoided. Some food can not be resold due to legal regulations (e.g. past the use-by date), some may no longer be donated (e.g. no longer fit for consumption) and some cannot be collected in time by the charitable institutions for organisational reasons.
Ergebnisse 10
3.1.2 Extended retail
This part of the report is still under construction.
3.1.3 Total food retail sector
The loss of turnover in the entire retail sector (organised and extended retail combined) is extrapolated at 4.1 billion euros, which is equivalent to about 710 thousand tonnes of food - food donations are included in this presentation (table 3). Due to a lack of data, it is currently not possible to make a statement about the processing into animal feed for the entire food retail sector.
Table 3 Turnover losses and losses in tonnes in the entire food retail sector Turnover in
product groups [billion Euro]
Turnover losses [%]
Turnover losses [billion Euro]
Losses [tonnes]
Bread and bakery products
24.92
-6.18
-1.51 - 334,130
Meat, fish and poultry 38.09 -2.81 -1.06 - 123,000
Dairy products and convenience
26.06
-1.61
-0.42 - 40,450
Fruit and vegetables 20.29 -4.26 -0.85 - 188,000
Other food products 78.64 -0.30 -0.25 - 28,010
Total 187.99 Mrd. € -1.76 % -4.09 Mrd. € - 713,795 t
Source: Own calculations according to the Dialogue Forum 2019.
By adding bakeries as types of businesses, the share of the corresponding product group increases (bread and bakery products). The inclusion of butchers also has a significant influence on meat, fish and poultry. The loss rates are subject to uncertainties, as they were transferred from the food retail in the Dialogue Forum 2019. However, they serve as a good estimate of the losses of the entire food retail sector. Due to the lack of figures on food donations in the other types of businesses, food donations of 30 % are also assumed here; in future, surveys should be carried out in all types of businesses in order to minimise this uncertainty. This results in food waste worth about 2.9 billion euros for the entire food retail sector, which corresponds to about 500 thousand tonnes.
Ergebnisse 11
3.2 Wholesale
This part of the report is still under construction.
No statements can yet be made about the food wholesale on the basis of the available data.
Four companies are already participating intensively in the discussions and collecting data.
However, in order to be able to report anonymously and representatively, a larger spectrum of participating companies must be covered. In the following years, a corresponding monitoring in the food wholesale sector is planned.
Ergebnisse im Kontext bisheriger Arbeiten 12
4 Results in the context of previous work
4.1 Placing food waste from food retail in the national context
Comparisons of the food waste quantities determined in this report with other stages of the food supply chain are only possible to a limited extent, as there is little reliable data. In addition to missing data, it should be noted that the data available for the individual stages do not have the same basis for a comparison in Germany: The values calculated for the food retail sector in the course of this report include all food products recorded through markdowns, irrespective of the recovery or disposal channel to which they are sent. For other stages of the food supply chain, e.g. in private households, only the actual (food) waste is measured. In addition, the survey methods differ and only allow limited comparisons. We therefore refrain from classifying the results along the entire food supply chain.
Reliable data are available for private households in Germany, which is why they should be used to place the results from retail: The majority of food waste is generated in private households (6.14 million tonnes), which corresponds to about 75 kilos per capita in 2015 (Schmidt et al 2019). In comparison, food waste generated in the entire food retail sector (approx. 500 thousand tonnes) is significantly lower. This corresponds to about 6 kilos per capita in 2019.
However, the retail sector can work towards improvements towards the consumers as well as food production and processing and (in cooperation with all stakeholders) make a significant contribution to strengthening the responsible use of food and a higher appreciation of food.
The retail and wholesale sector are taking numerous measures to reduce food waste. In doing so, the sectors are also faced with the challenge of having to balance conflicting goals. For example, packaging protects sensitive products and thus prevents food waste, but at the same time the reduction of packaging waste is an environmental policy goal that conflicts with this.
In addition, legal hurdles can act as barriers to the transfer of food (e.g. in liability issues or in the case of faulty labelling).
When assessing food waste, it must be considered that some of it is unavoidable. Avoidable food waste is food that is still fit for consumption and sale at the time of its disposal, or would have been fit for consumption and sale if it had been placed on the market in good time.
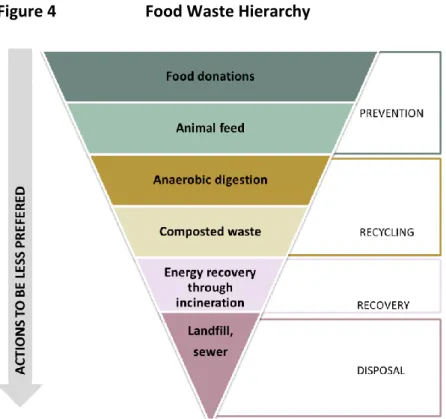
In addition, the recovery of food waste must be included in the assessment: The Food Waste Hierarchy based on the waste hierarchy of the Waste Framework Directive (2008/98/EC) evaluates food donation as well as redistribution to animal feed as prevention, anaerobic digestion as well as composting as recycling, energy recovery by incineration as recovery and landfill/sewer as disposal. The measures are to be preferred to each other in the order mentioned.
Ergebnisse im Kontext bisheriger Arbeiten 13
Figure 4 Food Waste Hierarchy
Source: Own representation based on Wegner et al. (2020); modified based on WRAP (2018).
4.2 Comparison of waste studies in food retail
Estimates of food waste from food retail are available in the literature for some countries (Orr and Schmidt 2020). The estimates differ greatly with regard to the data quality of the surveys.
While the presented projection for Germany is based on detailed, more precise data, the calculations in the literature are based on very small samples, short study periods and partly on information from interviews or empirical surveys on site. Internationally, there are only a few comparable studies, for example in Austria (Lebersorger and Schneider 2014). The losses recorded there in organised retail are at a similar level as in the analyses presented here. In Austria the loss rate is about 1.5 % of total turnover, in Germany about 1.7 %. We refrain from further direct comparisons.
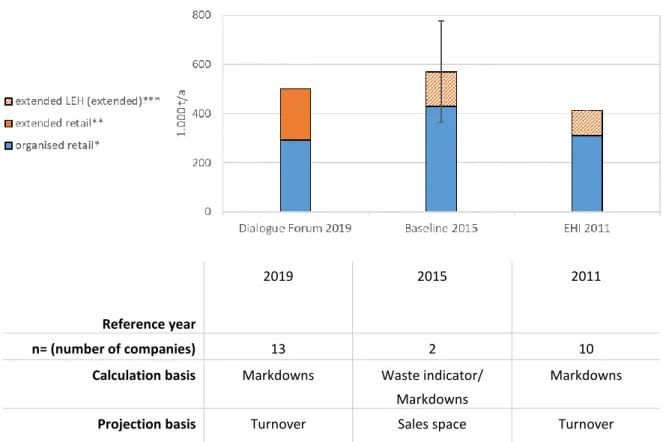
Nevertheless, the results should be placed in the context of previous studies in Germany on food waste in food retail (see Figure 4). On the one hand, there is the baseline 2015 (Schmidt et al. 2019, a derivation from the Stuttgart Study - Hafner et al. 2011) and on the other hand a survey conducted by the EHI Retail Institute in 2011 (EHI 2011). The respective methodology of the survey as well as the extrapolation, market definitions and reference years differ.
Ergebnisse im Kontext bisheriger Arbeiten 14
Figure 5 Different studies (methods and results) on losses and donations in food retail (no comparison possible because of different data basis and different methods)
Reference year
2019 2015 2011
n= (number of companies) 13 2 10
Calculation basis Markdowns Waste indicator/
Markdowns
Markdowns
Projection basis Turnover Sales space Turnover
*organised retail: supermarkets, discounters, hypermarkets.
**extended food retail: drugstores, beverage retailers, bakeries, butchers, petrol stations, online retailers, markets and stalls.
***extended retail (added): current estimate; was not included in the studies.
Source: Own representation and Schmidt et. al 2019 (*added), EHI 2011 (*added).
For the Baseline 2015, only the organised food retail and markets in wholesale10 were considered, therefore no statement is possible for the entire retail and wholesale sector. For the 2011 EHI study, only the organised food retail was considered. In order to classify the results of this report compared to the previous studies, the area of the extended food retailer was estimated on the basis of food turnover figures. The figures can be found in Appendix A.2.
In the baseline 2015, food waste in food retail is reported to be between 270 thousand and 580 thousand tonnes (mean value at 430 thousand tonnes) (Schmidt et al 2019). The waste indicator of the REWE Group 2015 (16.4 kg/m2) as well as a survey from 77 shops of another company (7.65 kg/m2) were included in the calculation. Since the extrapolation was made using the sales area in organised food retail (35.5 million m2), only food waste in organised food retail should be referred to here. Furthermore, no statement can be made about the ratio of sales space with non/near-food products to food products. Additionally, in the
10 The wholesale markets supply customers from the qualified, independent food retail trade - specialist shops for fruit and vegetables and weekly markets - as well as bulk consumers and the upmarket gastronomy sector with fresh produce.
Ergebnisse im Kontext bisheriger Arbeiten 15
baseline 2015, the markets in wholesale are reported to have food waste between 40 thousand and 54 thousand tonnes (Schmidt et al. 2019). However, these estimates leave out a large part of the wholesale food sector (Orr and Schmidt 2020).
The Baseline 2015 was created with the best available data at the time and the authors write that there are hardly any representative samples on which to base statistically robust statements" (Schmidt et al 2019). Furthermore, it is stated that at the time of publication it could not be assessed whether the data quality as well as methods used allow the mapping of changes at the national level. The baseline is intended to serve as a starting point and basis for discussion for the reporting of food waste in Germany (Schmidt et al 2019). The Baseline 2015 was also intended as a starting point for further research, as the authors themselves noted:
A joint further development of the baseline, towards a time series, requires the cooperation of all actors within the five dialogue forums of the National Strategy to Reduce Food Waste (Schmidt et al 2019). In this context, the knowledge gained should not only reflect the respective sectors, but also serve the projection at a national level (Schmidt et al. 2019). The Baseline 215 therefore has a different interest in knowledge and serves a different purpose than the presented monitoring report.
The EHI study 2011 and the data from the Dialogue Forum presented in this report projected the data via the turnover. In addition, more companies with a higher turnover participated in the data presented within the framework of the Dialogue Forum (72 billion to 35.5 billion euros).
Ergebnisse im Kontext bisheriger Arbeiten 16
This monitoring report contributes to the goals of the National Strategy to Reduce Food Waste to improve the quality of data through cooperation in the sector and thus to be able to make reliable statements. The data used here contributes to an improvement of the data basis for the food retail sector (no non-food shops and a larger sample and for the first time provides an estimate for the extended food retail). However, the data available are incomplete and do not represent the entire food retail; data for the wholesale sector are not yet available. These and further uncertainties are to be reduced in the future - through cooperation with the members of the Dialogue Forum:
- Food donations: Model projects in the companies are planned for 2021 in order to be able to represent the amount of food donations better and therefore gain a higher data quality.
- Wholesale: For 2021, further companies in the wholesale sector are to be acquired in order to supplement the already existing data and thus be able to publish aggregated and anonymised data. In addition, the methodological procedure for conversion and for food donations is to be adapted if necessary. Cash and carry companies are part of the food wholesale sector. In this report for 2019, food retail and cash and carry data cannot be disaggregated in the sample and are therefore used for the loss rates, but not for projection to the national level; in future reports, this inaccuracy is to be avoided.
- Entire food retail sector: It would be desirable for other companies to participate in the Dialogue Forum in order to be able to represent other types of food retail businesses, as currently it is mainly the organised food retail sector that participates.
- Returns: Returns are partly included in markdowns. A differentiation of this data should be better mapped in the future.
Schlussfolgerungen 17
5 Conclusion
Losses on turnover due to markdowns in the entire food retail sector were 4.1 billion euros in 2019, which corresponds to about 710 thousand tonnes of food. It is assumed that about 30 % of all markdowns are redistributed as food donations. Losses redistributed as animal feed and other redistribution is estimated to be much lower, but its extent is currently unknown. This results in food waste in the entire food retail sector worth about 2.9 billion euros, which corresponds to about 500 thousand tonnes. In organised food retail, the turnover losses were 2.5 billion euros (approx. 420 thousand tonnes). Food waste in organised food retail, after deduction of food donations, is thus about 1.7 billion euros, which corresponds to about 290 thousand tonnes.
Due to the internal company records over an entire year, the results on food waste and redistribution in the German food retail sector are based on a very high data quality.
Furthermore, depending on the market definition, the participating companies cover between 35 and 50 % of the food retail turnover. Internationally, there are only a few comparable studies, for example in Austria (Lebersorger and Schneider 2014). The losses in organised food retail there are 1.5 % of total food turnover. In the analyses presented here for organised food retail in Germany, a rate of 1.7% was calculated. The classification in the national context along the food supply chain shows that the amount of food waste generated in the German food retail sector per year is significantly lower in total than that at the level of private households (Schmidt et al. 2019). However, retail can work towards improvements upstream and downstream in cooperation with all stakeholders and thus make a significant contribution to reducing food waste along the food supply chain.
In connection with this first report for 2019, a comprehensive concept for data collection and analysis has been developed, which can be expanded to also represent the extended food retail and wholesale sector better in the future. In addition, cooperation to improve the quality of data on food donations has been promised in order to close the existing information gap in the future. Through the constructive cooperation in the Dialogue Forum on Wholesale and Retail, the companies in food retail and wholesale, associations, the EHI Retail Institute, CSCP and the Thünen Institute have laid the foundations for being able to reliably determine losses in the food trade on a broad data basis and to jointly further develop the method used.
For example, this includes the further improvement of the data basis for the conversion into mass data.
The findings will be used to draw up an accord in the Dialogue Forum on Wholesale and Retail as part of the National Strategy to Reduce Food Waste. The better the data and thus the more meaningful the analysis, the more statements can be made about the effectiveness of further reduction measures. This will also enable companies to assess the reduction potential from a practical point of view in order to select particularly effective measures to reduce food waste better.
Literatur 18
Literature
BMEL (2019) Nationale Strategie zur Reduzierung der Lebensmittelverschwendung, Referat 216 – Nachhaltige Ernährung, Reduzierung von Lebensmittelverschwendung.
Bundesverband E-Commerce und Versandhandel Deutschland e.V. (2020) Pressemitteilung vom 21.
Januar 2020 (Online-Umsatz (brutto) mit Lebensmitteln) Deutscher Fleischer-Verband (e.V.) (2020) Jahrbuch 2020.
Scope Ratings GmbH (2019) Tankstellenmarkt in Deutschland (Umsatzanteile der Warengruppen bei Tankstellen-Shops)
EHI Retail Institute (2011) Nahrungsmittelverluste im Lebensmitteleinzelhandel, Köln.
EHI Retail Institute (2019) Umsatz der Cash & Carry Märkte in Deutschland, Köln.
EHI Retail Institute (2020) Nettoumsatz der Lebensmittelgeschäfte nach Betriebsformen, Köln.
Information Resources GmbH (2018) Grundgesamtheiten Deutschland 2018 (Bruttoumsatz der Getränkeabholmärkte)
Lebersorger S, Schneider F (2014) Aufkommen an Lebensmittelverderb im österreichischen Lebensmittelhandel: Endbericht im Auftrag der ECR-Arbeitsgruppe Abfallwirtschaft 2014, 26 p
Orr L, Schmidt TG (2020) Monitoring der Lebensmittelverluste im Lebensmittelhandel. Braunschweig:
Johann Heinrich von Thünen-Institut, 50 p, Thünen Working Paper 154
Schmidt TG, Schneider F, Leverenz D, Hafner G (2019) Lebensmittelabfälle in Deutschland: Baseline 2015. Braunschweig: Johann Heinrich von Thünen-Institut, 103 p. Thünen Report 71 Statistisches Bundesamt (2020) Jahreserhebung im Handel, Ergebnis: 45341-0001-WZ08-478
(Nettoumsatz im Einzelhandel an Verkaufsständen und Märkten)
The Nielsen Company (2017) Nielsen Consumer Deutschland. Verbraucher - Handel -Werbung The Nielsen Company (2018) Nielsen Consumers 2018 (Umsatz der Drogeriemärkte)
The Nielsen Company (2019) Nielsen Consumers 2019 (Umsatz der Tankstellen)
VN - Vereinte Nationen (2015) Transformation unserer Welt: die Agenda 2030 für nachhaltige Entwicklung, 38 p. Ergebnisdokument des Gipfeltreffens der Vereinten Nationen
Verordnung (EG) Nr. 767/2009 des Europäischen Parlaments und des Rates vom 13. Juli 2009 über das Inverkehrbringen und die Verwendung von Futtermitteln, zur Änderung der Verordnung (EG) Nr. 1831/2003 des Europäischen Parlaments und des Rates und zur Aufhebung der Richtlinien 79/373/EWG des Rates, 80/511/EWG der Kommission, 82/471/EWG des Rates, 83/228/EWG des Rates, 93/74/EWG des Rates, 93/113/EG des Rates und 96/25/EG des Rates und der Entscheidung 2004/217/EG der Kommission Text von Bedeutung für den EWR (2009)
WRAP (2018) Courtauld 2025 signatory data report: 2015 and 2016: Final Report, hg. v. WRAP
Zentralverband des deutschen Bäckerhandwerks e.V. (2020) Zahlen und Fakten: Bäckerhandwerk in
Deutschland: Strukturzahlen 2012 bis 2019.
https://www.baeckerhandwerk.de/baeckerhandwerk/zahlen-fakten/. Zuletzt besucht 23.11.2020
Anhang 19
Appendix
A.1 Original Data
Presentation of the loss rates supplementary to Figure 2.
Table 4 Loss data according to commodity groups Minimum
[%]
Maximum [%]
Weighted average [%]
Bread and bakery products - 1.13 - 11.71 - 6.18 Meat, fish and poultry - 0.02 - 5.14 - 2.81 Dairy products and
convenience
- 0.01 - 3.25 - 1.61 Fruit and vegetables - 0.08 - 8.46 - 4.26 Other food products - 0.02 - 1.19 - 0.30
Total -1.76 %
Source: Own calculations according to the Dialogue Forum 2019.
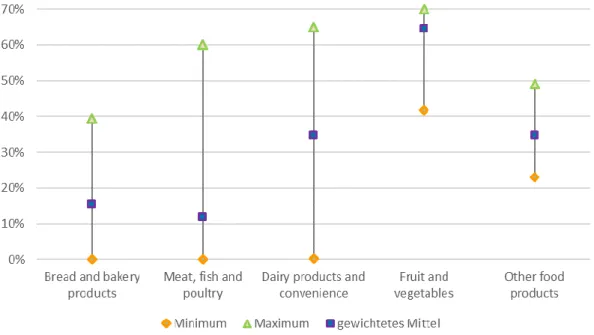
Presentation of the share of food donations to food banks and similar organisations in the recorded losses as a supplement to Figure 3.
Table 5 Contributions to food banks and similar organisations Minimum
[%]
Maximum [%]
Weighted average [%]
Bread and bakery products 41.70 70 64.50
Meat, fish and poultry 0 39.40 15.50
Dairy products and convenience
0 60 11.90
Fruit and vegetables 0.30 65 34.80
Other food products 22.90 49 34.70
Source: Own calculations according to Frank Horst (EHI Retail Institute), based on samples from 2018.
Anhang 20
A.2 Projection
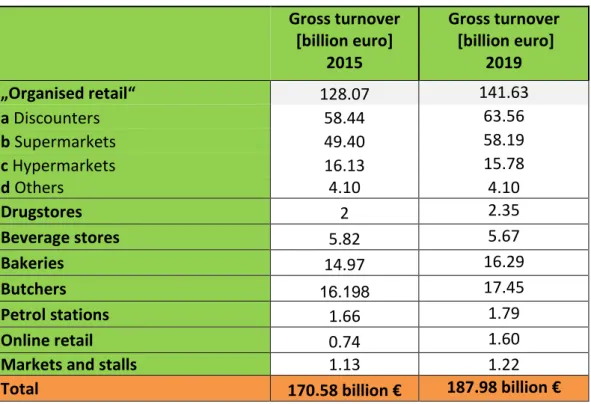
Table 6 shows the calculated gross food sales for 2015 and 2019.
Table 6 Food turnover by establishment type for 2015 and 2019
Gross turnover [billion euro]
2015
Gross turnover [billion euro]
2019
„Organised retail“ 128.07 141.63
a Discounters 58.44 63.56
b Supermarkets 49.40 58.19
c Hypermarkets 16.13 15.78
d Others 4.10 4.10
Drugstores 2 2.35
Beverage stores 5.82 5.67
Bakeries 14.97 16.29
Butchers 16.198 17.45
Petrol stations 1.66 1.79
Online retail 0.74 1.60
Markets and stalls 1.13 1.22
Total 170.58 billion € 187.98 billion €
Source: Own calculations based on the data provided on handelsdaten.de and the sources indicated for each type of business.
Table 7 shows the turnover losses by type of business, the following assumptions were made (see chapter 2.4): Where statistics on the distribution of turnover of the different product groups existed, the turnover was added. In organised food retail, the results of the Dialogforum from operational data were used (79% of turnover from food). For two types of businesses, no subdivision of the product groups could be made, which is why average values were used. In order to calculate the turnover losses of the product groups, the product groups from the turnover statistics used had to be assigned to the product groups used in the dialogue forum on wholesale and retail.
Anhang 21
Table 7 Food turnover and turnover losses by type of business in 2019
Gross turnover [billion euro]
Turnover losses [billion euro]
„Organised retail“ 141.63 - 2.49
a Discounters 63.56
b Supermarkets 58.19
c Hypermarkets 15.78
d Others 4.10
Drugstores 2.35 - 0.01
Beverage retailers 5.67 - 0.02
Bakeries 16.29 - 1.01
Butchers 17.45 - 0.49
Petrol stations 1.79 - 0.03
Online retail 1.60 - 0.03
Markets and stalls 1.22 - 0.02
Total 187.98 billion € - 4.09 billion €
Source: Own calculations based on the data provided on handelsdaten.de and the sources indicated for each type of business.
1 Organised food retail
• Time series: 2010-2019
• Source: handelsdaten.de; EHI 2020 (Net turnover)
• Assumptions Calculation:
o Net turnover * 1,0811 = Gross turnover
o Gross turnover * 0,7912 = Gross turnover food
o Commodity groups: Bread and bakery products, fish, meat and poultry, dairy products and convenience, fruit and vegetables, other foodstuffs
2 Drugstores
• Time series: 2010-2017 (Gross turnover); 2013-2017 (Share food)
• Source: handelsdaten.de; The Nielsen Company GmbH 2018 (Gross turnover); GfK Consumer Panel 2019 (Share food)
• Assumptions Calculation:
o Trend calculation for 2018+2019
o Commodity groups: Dairy products and convenience (fresh), other food (dry food, confectionery, beverages)
3 Beverage stores
• Time series: 2010-2017
• Source: handelsdaten.de; Information Resources GmbH 2018 (Gross turnover food)
11 Assumption
12 Information from the analysis presented in the dialogue forum
![Table 1 Conversion of monetary values into weights Product groups Minimum [€/kg] Maximum [€/kg] Conversion factor (weighted average) [€/kg]](https://thumb-eu.123doks.com/thumbv2/1library_info/4026231.1542119/12.892.118.777.142.368/conversion-monetary-weights-product-minimum-maximum-conversion-weighted.webp)
![Table 2 Overview of turnover losses and losses in tonnes in organised retail Turnover in product groups [billion Euro] Turnover losses [%] Turnover losses [billion Euro] Losses [tonnes]](https://thumb-eu.123doks.com/thumbv2/1library_info/4026231.1542119/14.892.115.839.533.819/overview-turnover-organised-turnover-product-billion-turnover-turnover.webp)
![Table 3 Turnover losses and losses in tonnes in the entire food retail sector Turnover in product groups [billion Euro] Turnover losses [%] Turnover losses [billion Euro] Losses [tonnes]](https://thumb-eu.123doks.com/thumbv2/1library_info/4026231.1542119/16.892.110.802.466.756/turnover-turnover-product-billion-turnover-turnover-billion-losses.webp)
![Table 4 Loss data according to commodity groups Minimum [%] Maximum [%] Weighted average [%]](https://thumb-eu.123doks.com/thumbv2/1library_info/4026231.1542119/25.892.112.648.371.580/table-according-commodity-groups-minimum-maximum-weighted-average.webp)