crystals
Article
Structural Chemistry of Halide including Thallides A 8 Tl 11 X 1 − n (A = K, Rb, Cs; X = Cl, Br; n = 0.1–0.9)
Stefanie Gärtner
1,2,*
ID, Susanne Tiefenthaler
1, Nikolaus Korber
1 ID, Sabine Stempfhuber
2and Birgit Hischa
21
Institute of Inorganic Chemistry, University of Regensburg, 93040 Regensburg, Germany;
Susanne.tiefenthaler@ur.de (S.T.); Nikolaus.korber@ur.de (N.K.)
2
Central Analytics, X-ray Crystallography Dept., University of Regensburg, 93040 Regensburg, Germany;
sabine.stempfhuber@ur.de (S.S.); Birgit.hischa@ur.de (B.H.)
*
Correspondence: Stefanie.gaertner@ur.de; Tel.: +49-941-943-4446
Received: 23 July 2018; Accepted: 7 August 2018; Published: 10 August 2018
Abstract: A
8Tl
11(A = alkali metal) compounds have been known since the investigations of Corbett et al. in 1995 and are still a matter of current discussions as the compound includes one extra electron referred to the charge of the Tl
117−cluster. Attempts to substitute this additional electron by incorporation of a halide atom succeeded in the preparation of single crystals for the lightest triel homologue of the group, Cs
8Ga
11Cl, and powder diffraction experiments for the heavier homologues also suggested the formation of analogous compounds. However, X-Ray single crystal studies on A
8Tl
11X to prove this substitution and to provide a deeper insight into the influence on the thallide substructure have not yet been performed, probably due to severe absorption combined with air and moisture sensitivity for this class of compounds. Here, we present single crystal X-Ray structure analyses of the new compounds Cs
8Tl
11Cl
0.8, Cs
8Tl
11Br
0.9, Cs
5Rb
3Tl
11Cl
0.5, Cs
5.7K
2.3Tl
11Cl
0.6and K
4Rb
4Tl
11Cl
0.1. It is shown that a (partial) incorporation of halide can also be indirectly determined by examination of the Tl-Tl distances, thereby the newly introduced cdd/cd
avratio allows to evaluate the degree of distortion of Tl
117−clusters.
Keywords: thallide; intermetallics; single crystal; X-ray structure analysis
1. Introduction
Naked cluster anions of the main group elements are well-known for group 14 and 15 elements in solid-state [1–4]. Most of these compounds can be described in terms of the Zintl-Klemm concept [5–7]
by formally transferring the valence electrons of the electropositive element to the electronegative under formation of salt-like structures, so called polyanionic salts. Homoatomic group 14 or 15 element polyanions are known since Zintl himself in 1930 stated the existence of Pb
94−during potentiometric titrations in liquid ammonia solutions [5]. In contrast, the existence of naked group 13 element clusters is not self-evident due to lower values for the electron affinity of group 13 elements which results in a predominantly metallic character of the analogous compounds [3,8]. The first naked thallium cluster was described in 1967 by Hansen and Smith in the binary solid-state compound Na
2Tl [9], which contains Tl
4tetrahedra with a calculated formal charge of − 8 by assuming complete electron transfer. These tetrahedral assemblies are related to the structures of ATt (A: alkali metal, Tt: group 14 element) [10–12] and white phosphorus due to their formal iso-(valence)-electronic character. The largest (empty) thallide cluster is represented by the Tl
117−cluster which is present in binary materials A
8Tl
11[13,14] and A
15Tl
27[15] (A = K, Rb, Cs). The A
8Tr
11(Tr = group 13 element) structure type was first described in 1991 for the lighter homologue indium in K
8In
11[16], of which the crystal structure proved the presence of a naked, pentacapped trigonal prismatic shaped In
11cluster, which was
Crystals2018,8, 319; doi:10.3390/cryst8080319 www.mdpi.com/journal/crystals
Crystals2018,8, 319 2 of 10
assigned a charge of − 7. Additionally, one extra-electron per formula unit is present, being responsible for the metallic character. The additional electron, referred to the charge of − 7 of the cluster anion, is not necessary for the stability of the clusters [17] and can be replaced by halide atoms, which are located on a − 3 void (Wyckoff position 6b) at the origin of the unit cell resulting in a diamagnetic character of the compounds. Halide incorporation was proven for the lighter homologue of the group, Cs
8Ga
11Cl by X-ray single crystal structure analysis [18]. Powder diffraction experiments suggested the formation of the heavier homologues Rb
8Ga
11Cl, Cs
8Ga
11X (X = Br, I), Rb
8In
11Cl, Cs
8In
11Cl, Cs
8Tl
11X (X = Cl, Br, I). Recently, continuative studies on halides A
8Tr
11(Tr = Ga, In) have been reported [19].
However, the formation of Rb
8Tl
11Cl was termed as doubtful due to the lack of a significant change in the lattice constants compared to the binary phase Rb
8Tl
11, which also is a common problem for the remaining halide including thallides of this structure family. Therefore, well-resolved single crystal X-ray diffraction studies should provide a deeper insight into the involvement and the role of halide in A
8Tl
11X compounds. Thereby, we concentrated on the heavier alkali metals K, Rb and Cs as for sodium no experimental evidence of Tl
11clusters is reported.
The questions we wanted to answer were: (1) How does the geometry of the thallide cluster change on halide incorporation; (2) Is there a Rb
8Tl
11Cl? (3) How do mixed cation sites affect the amount of halide incorporation?
In Section 3 (Results), we report on the first single crystal X-Ray structure determination of halide including thallides, Cs
8Tl
11Cl
0.8, Cs
8Tl
11Br
0.9, Cs
5Rb
3Tl
11Cl
0.5, Cs
5.7K
2.3Tl
11Cl0
.6and K
3.98Rb
4.02Tl
11Cl
0.1. Subsequently, (Section 4, Discussions), the crystal structures are investigated according to the questions listed above.
2. Materials and Methods
All compounds have been synthesized via a stoichiometric approach using high temperature solid state techniques. Cesium and rubidium were produced by the reduction of the corresponding alkali metal halide with elemental calcium [20] and distilled twice, potassium was segregated for purification. Thallium lumps have been stored under inert atmosphere and were used without further purification. The starting materials were enclosed in tantalum crucibles (for stoichiometric approaches see Appendix A) which were subsequently placed in quartz glass ampoules and sealed under argon atmosphere. The same temperature program was used for all compounds: Heating to 700
◦C with a heating rate of 50
◦C/h, holding for 24 h, cooling to room temperature with a cooling rate of 3
◦C/h to allow for crystallization.
All compounds are very sensitive towards moisture and oxygen and degeneration of the crystals was observed (gassing) in dried mineral oil within few hours. Suitable single crystals for X-ray structure analysis were isolated in dried mineral oil and mounted on a Rigaku SuperNova (Rigaku Polska Sp. Z o. o. Ul, Wroclaw, Poland) (Mo-source, Eos detector) using MiTeGen loops. Thereby, the transfer needed to be very quick as the crystals started to decompose as soon as the mineral oil film became too thin. Once being placed on the diffractometer in the nitrogen stream at 123 K the crystals remained stable and data collection was possible.
Powder diffraction samples were measured in sealed capillaries (0.3–0.5 mm) on a Powder on a STOE Stadi P diffractometer (STOE, Darmstadt, Germany) (monochromatic Mo-K
α1radiation λ = 0.70926 Å) equipped with a Dectris Mythen 1 K detector.
3. Results
All compounds crystallize in the K
8In
11structure type (rhombohedral, spacegroup R − 3c) and especially for the mixed alkali metal compounds many of the crystals happened to form typical
“multicrystals”. Due to the presence of reverse/obverse twinning a R(obv) filter was applied during
data reduction [21]. The materials naturally possess very high absorption coefficients ( µ > 60 mm
−1),
therefore small single crystals have been chosen for the X-ray analyses. However, the data sets
Crystals2018,8, 319 3 of 10
still suffer from severe absorption effects which could be reduced by carefully applying numerical absorption correction [21]. Thereby, the adjustment of the correct shape played a dominant role.
Table 1 lists the data for the structure determination. For the chloride including compounds two additional, unresolved but several times reproduced residual electron density peaks ( ≈ 1.5 Å beside the chlorine atom, ≈ 2.2 Å beside cesium; along the c-axis) are present, which we attribute to unresolved absorption effects as this direction is along the thinnest direction of the plate like crystals. For the bromine including compound this effect is not as dominant as for the chlorine including ones but still is observed.
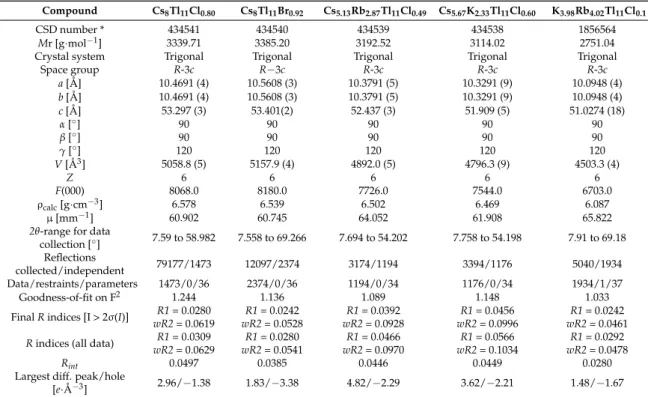
Table 1.
Crystal data and structure refinement details.
Compound Cs8Tl11Cl0.80 Cs8Tl11Br0.92 Cs5.13Rb2.87Tl11Cl0.49 Cs5.67K2.33Tl11Cl0.60 K3.98Rb4.02Tl11Cl0.1
CSD number * 434541 434540 434539 434538 1856564
Mr [g·mol−1] 3339.71 3385.20 3192.52 3114.02 2751.04
Crystal system Trigonal Trigonal Trigonal Trigonal Trigonal
Space group R-3c R−3c R-3c R-3c R-3c
a[Å] 10.4691 (4) 10.5608 (3) 10.3791 (5) 10.3291 (9) 10.0948 (4)
b[Å] 10.4691 (4) 10.5608 (3) 10.3791 (5) 10.3291 (9) 10.0948 (4)
c[Å] 53.297 (3) 53.401(2) 52.437 (3) 51.909 (5) 51.0274 (18)
α[◦] 90 90 90 90 90
β[◦] 90 90 90 90 90
γ[◦] 120 120 120 120 120
V[Å3] 5058.8 (5) 5157.9 (4) 4892.0 (5) 4796.3 (9) 4503.3 (4)
Z 6 6 6 6 6
F(000) 8068.0 8180.0 7726.0 7544.0 6703.0
ρcalc[g·cm−3] 6.578 6.539 6.502 6.469 6.087
µ[mm−1] 60.902 60.745 64.052 61.908 65.822
2θ-range for data
collection [◦] 7.59 to 58.982 7.558 to 69.266 7.694 to 54.202 7.758 to 54.198 7.91 to 69.18 Reflections
collected/independent 79177/1473 12097/2374 3174/1194 3394/1176 5040/1934
Data/restraints/parameters 1473/0/36 2374/0/36 1194/0/34 1176/0/34 1934/1/37
Goodness-of-fit on F2 1.244 1.136 1.089 1.148 1.033
FinalRindices [I > 2σ(I)] R1= 0.0280 wR2= 0.0619
R1= 0.0242 wR2= 0.0528
R1= 0.0392 wR2= 0.0928
R1= 0.0456 wR2= 0.0996
R1= 0.0242 wR2= 0.0461 Rindices (all data) R1= 0.0309
wR2= 0.0629
R1= 0.0280 wR2= 0.0541
R1= 0.0466 wR2= 0.0970
R1= 0.0566 wR2= 0.1034
R1= 0.0292 wR2= 0.0478
Rint 0.0497 0.0385 0.0446 0.0449 0.0280
Largest diff. peak/hole
[e·Å−3] 2.96/−1.38 1.83/−3.38 4.82/−2.29 3.62/−2.21 1.48/−1.67
* Further details of the crystal structure investigation(s) may be obtained from The Cambridge Crystallographic data centre CCDC on quoting the deposition number CSD-xxxxxx or the the deposition number CCDC-xxxxxxx at https://www.ccdc.cam.ac.uk/structures/?
With only cesium being present in Cs
8Tl
11Cl
0.8and Cs
8Tl
11Br
0.9we obtained phase pure materials according to the powder diffraction pattern of the bulk material (Figure 1; refined cell contstants at room temperature: Cs
8Tl
11Cl
0.8: a = 10.566 (5) Å, c = 53.67 (3) Å, R − 3c; Cs
8Tl
11Br
0.9: a = 10.613 (3) Å, c = 53.680 (19) Å).
The well-crystallized Cs
8Tl
11X crystals and the resulting good quality single crystal diffraction data allowed the splitting of one alkali metal position according to the site occupancy factor (s.o.f.) of the halide atom (see Section 4.3).
For the mixed alkali metal compounds, we always additionally observed less reduced A
15Tl
27phases as a side product. This observation became reasonable when we determined the N
Evalue
(number of electrons per thallium atom) which sums up to a value of 8/11 = 0.72 for A
8Tl
11,
15/27 = 0.55 for A
15Tl
27and 7/11 = 0.63 for A
8Tl
11X. The formation of less reduced A
15Tl
27were
completely comprehensible if the higher reduced A
8Tl
11X
x(x << 1) phases would have formed when
the halide content was significantly less than 1, because the overall degree of reduction was given by
the stoichiometric approach for A
8Tl
11X. If less halide was incorporated, this is according to a higher
degree of reduction and consequently, a less reduced phase was formed in addition. The remaining
halide re-crystallized as (mixed) AX, of which we also could observe single crystals. The crystals for
the mixed alkali metal compounds A
8Tl
11X
xhappened to form multicrystals together with A
15Tl
27Crystals2018,8, 319 4 of 10
and for the reported single crystals (except K
4Rb
4Tl
11Cl
0.1) the data quality was worse compared to Cs
8Tl
11X phases. Therefore, the splitting of the alkali metal position could only be observed for K
4Rb
4Tl
11Cl
0.1, for the remaining mixed alkali compounds splitting positions could not be reasonably introduced. In these cases, we only refined the s.o.f. of the halide (see Section 4.3).
Crystals 2018, 8, x FOR PEER REVIEW 3 of 10
Table 1 lists the data for the structure determination. For the chloride including compounds two additional, unresolved but several times reproduced residual electron density peaks (≈1.5 Å beside the chlorine atom, ≈2.2 Å beside cesium; along the c-axis) are present, which we attribute to unresolved absorption effects as this direction is along the thinnest direction of the plate like crystals. For the bromine including compound this effect is not as dominant as for the chlorine including ones but still is observed.
Table 1. Crystal data and structure refinement details.
Compound Cs8Tl11Cl0.80 Cs8Tl11Br0.92 Cs5.13Rb2.87Tl11Cl0.49 Cs5.67K2.33Tl11Cl0.60 K3.98Rb4.02Tl11Cl0.1 CSD number * 434541 434540 434539 434538 1856564
Mr [g·mol−1] 3339.71 3385.20 3192.52 3114.02 2751.04 Crystal system Trigonal Trigonal Trigonal Trigonal Trigonal
Space group R-3c R−3c R-3c R-3c R-3c
a [Å] 10.4691 (4) 10.5608 (3) 10.3791 (5) 10.3291 (9) 10.0948 (4) b [Å] 10.4691 (4) 10.5608 (3) 10.3791 (5) 10.3291 (9) 10.0948 (4) c [Å] 53.297 (3) 53.401(2) 52.437 (3) 51.909 (5) 51.0274 (18)
α [°] 90 90 90 90 90
β [°] 90 90 90 90 90
γ [°] 120 120 120 120 120
V [Å3] 5058.8 (5) 5157.9 (4) 4892.0 (5) 4796.3 (9) 4503.3 (4)
Z 6 6 6 6 6
F(000) 8068.0 8180.0 7726.0 7544.0 6703.0
ρcalc [g·cm−3] 6.578 6.539 6.502 6.469 6.087
μ [mm−1] 60.902 60.745 64.052 61.908 65.822
2θ-range for data
collection [°] 7.59 to 58.982 7.558 to 69.266 7.694 to 54.202 7.758 to 54.198 7.91 to 69.18 Reflections
collected/independent 79177/1473 12097/2374 3174/1194 3394/1176 5040/1934 Data/restraints/paramete
rs 1473/0/36 2374/0/36 1194/0/34 1176/0/34 1934/1/37 Goodness-of-fit on F2 1.244 1.136 1.089 1.148 1.033 Final R indices [I > 2σ(I)] R1 = 0.0280
wR2 = 0.0619
R1 = 0.0242 wR2 = 0.0528
R1 = 0.0392 wR2 = 0.0928
R1 = 0.0456 wR2 = 0.0996
R1 = 0.0242 wR2 = 0.0461 R indices (all data) R1 = 0.0309
wR2 = 0.0629
R1 = 0.0280 wR2 = 0.0541
R1 = 0.0466 wR2 = 0.0970
R1 = 0.0566 wR2 = 0.1034
R1 = 0.0292 wR2 = 0.0478
Rint 0.0497 0.0385 0.0446 0.0449 0.0280
Largest diff. peak/hole
[e·Å−3] 2.96/−1.38 1.83/−3.38 4.82/−2.29 3.62/−2.21 1.48/−1.67
* Further details of the crystal structure investigation(s) may be obtained from The Cambridge Crystallographic data centre CCDC on quoting the deposition number CSD-xxxxxx or the the deposition number CCDC-xxxxxxx at https://www.ccdc.cam.ac.uk/structures/?
With only cesium being present in Cs
8Tl
11Cl
0.8and Cs
8Tl
11Br
0.9we obtained phase pure materials according to the powder diffraction pattern of the bulk material (Figure 1; refined cell contstants at room temperature: Cs
8Tl
11Cl
0.8: a = 10.566 (5) Å, c = 53.67 (3) Å, R
−3c; Cs
8Tl
11Br
0.9: a = 10.613 (3) Å, c = 53.680 (19) Å).
(a) (b)
Crystals 2018, 8, x FOR PEER REVIEW 4 of 10
(c) (d)
Figure 1. Measured (a) and calculated (c) powder diffraction patterns of Cs8
Tl
11Cl
0.8; Measured (b) and calculated (d) powder diffraction patterns of Cs
8Tl
11Br
0.9(diffractograms generated by the program STOE WinXPOW adapted from [22], with permission from © 1887 STOE.
The well-crystallized Cs
8Tl
11X crystals and the resulting good quality single crystal diffraction data allowed the splitting of one alkali metal position according to the site occupancy factor (s.o.f.) of the halide atom (see Section 4.3).
For the mixed alkali metal compounds, we always additionally observed less reduced A
15Tl
27phases as a side product. This observation became reasonable when we determined the N
Evalue (number of electrons per thallium atom) which sums up to a value of 8/11 = 0.72 for A
8Tl
11, 15/27 = 0.55 for A
15Tl
27and 7/11 = 0.63 for A
8Tl
11X. The formation of less reduced A
15Tl
27were completely comprehensible if the higher reduced A
8Tl
11X
x(x << 1) phases would have formed when the halide content was significantly less than 1, because the overall degree of reduction was given by the stoichiometric approach for A
8Tl
11X. If less halide was incorporated, this is according to a higher degree of reduction and consequently, a less reduced phase was formed in addition. The remaining halide re-crystallized as (mixed) AX, of which we also could observe single crystals. The crystals for the mixed alkali metal compounds A
8Tl
11X
xhappened to form multicrystals together with A
15Tl
27and for the reported single crystals (except K
4Rb
4Tl
11Cl
0.1) the data quality was worse compared to Cs
8Tl
11X phases. Therefore, the splitting of the alkali metal position could only be observed for K
4Rb
4Tl
11Cl
0.1, for the remaining mixed alkali compounds splitting positions could not be reasonably introduced. In these cases, we only refined the s.o.f. of the halide (see Section 4.3).
4. Discussions
4.1. How Does the Geometry of the Thallide Cluster Change on Halide Incorporation?
All A
8Tl
11and A
8Tl
11X
xcompounds include Tl
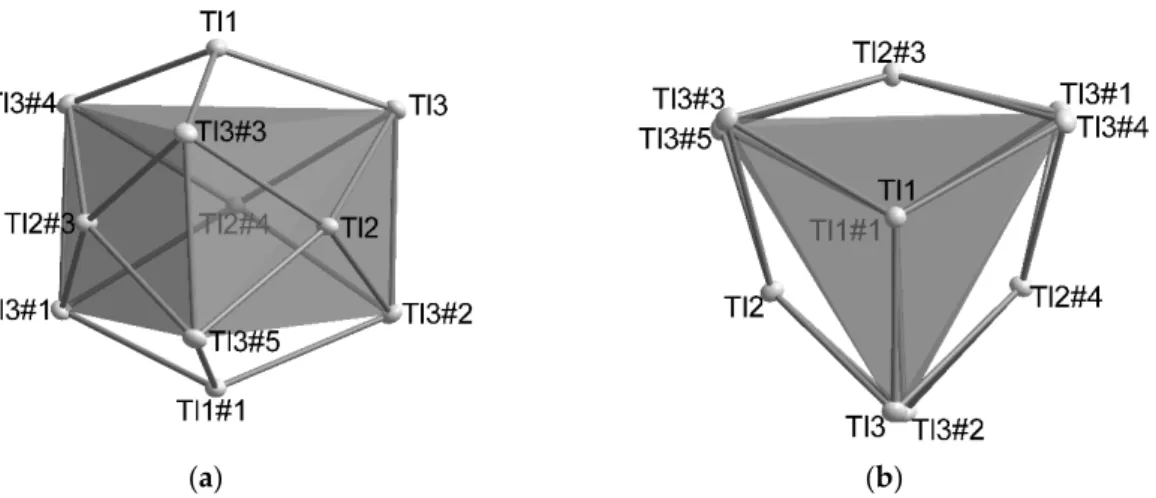
117−clusters, which are best described as a very compressed, fivefold-capped trigonal prism (Figure 2). Three symmetry independent thallium atoms are located on three different Wyckoff positions of space group R-3c: Tl1(12c; 3-fold rotational axis), Tl2 (36f; general position) and Tl3 (18e; 2-fold rotational axis) build a cluster consisting of 11 Tl atoms with point group D
3. The deviations from point group D
3hare very small and are represented by a distortion of the height of the trigonal prism built by Tl3-atoms. This distortion is also reflected in the distances of Tl2–Tl3 (d(Tl2–Tl3): = cd) as there are two crystallographic independent distances present (d(Tl2–Tl3) = d(Tl2–Tl3#5); d(Tl3#3–Tl2) = d(Tl3#2–Tl2)). The degree of distortion decreases with increasing similarity of the capping distances (cd).
Figure 1.
Measured (a) and calculated (c) powder diffraction patterns of Cs
8Tl
11Cl
0.8; Measured (b) and calculated (d) powder diffraction patterns of Cs
8Tl
11Br
0.9(diffractograms generated by the program STOE WinXPOW [22]).
4. Discussions
4.1. How Does the Geometry of the Thallide Cluster Change on Halide Incorporation?
All A
8Tl
11and A
8Tl
11X
xcompounds include Tl
117−clusters, which are best described as a very
compressed, fivefold-capped trigonal prism (Figure 2). Three symmetry independent thallium atoms
are located on three different Wyckoff positions of space group R-3c: Tl1(12c; 3-fold rotational axis),
Tl2 (36f ; general position) and Tl3 (18e; 2-fold rotational axis) build a cluster consisting of 11 Tl atoms
with point group D
3. The deviations from point group D
3hare very small and are represented by a
distortion of the height of the trigonal prism built by Tl3-atoms. This distortion is also reflected in
the distances of Tl2–Tl3 (d(Tl2–Tl3): = cd) as there are two crystallographic independent distances
present (d(Tl2–Tl3) = d(Tl2–Tl3#5); d(Tl3#3–Tl2) = d(Tl3#2–Tl2)). The degree of distortion decreases
with increasing similarity of the capping distances (cd).
Crystals2018,8, 319 5 of 10
Crystals 2018, 8, x FOR PEER REVIEW 5 of 10
(a) (b)
Figure 2. Two perspectives (a) side view; (b) top view show the distortion of the trigonal prism in the
Tl
117−cluster which results in the point group D
3for the cluster; Symmetry operations for the generation of equivalent atoms: #1: 1/3 + x − y, 2/3 − y, 7/6 − z; #2: 1/3 + y, −1/3 + x, 7/6 − z; #3: 1 − y, x − y, z; #4: 1 – x + y, 1 − x, z; #5: 4/3 − x, 2/3 – x + y, 7/6 − z.
In Tables 2 and 3 the distances as well as the distortion angles are listed and the dependence on the amount of halide incorporation is clearly evident. In contrast, the height of the trigonal prism (Tl3–Tl3) as well as the distance of the capping atom Tl2 to the mean plane built by Tl3 atoms [d(Tl2-plane) = 0.5 Å in all compounds] do not significantly change. Based on these observations we introduced a cdd/cd
avratio (cdd: capping distance difference; cd
av: average capping distance;
(Equation (1)) which allowed for a quick estimation of the degree of distortion. The dependence of the cdd/cd
avratio on the amount of halide is conspicuous and therefore allows for the evaluation of the involvement of halide atoms by solely analyzing the distances between heavy atom positions.
2 1
2 1
av
cd cd cdd
cd cd cd
2
= −
+
cd
1≤ cd
2(1)
Table 2. Selected distances in [Å] (numbering scheme according to, values taken from [1,15]), tilt
angle and cdd/cd
avvalue for K
8Tl
11and Rb
8Tl
11.
Atom 1 Atom 2 K
8Tl
11Rb
8Tl
11Tl2 Tl3 3.0476 (4) 3.060 Tl2 Tl3
33.1396 (4) 3.157 Tl1 Tl3
13.1304 (4) 3.147 Tl3 Tl3
33.2054 (7) 3.219
Tilt [°] 4.69 (2) 4.90 cdd/cd
av[%] 2.97 3.12
Table 3. Selected distances in [Å] (numbering scheme according to), tilt angle and cdd/cdav
value for Cs
8Tl
11Cl
0.8, Cs
8Tl
11Br
0.9, Cs
5Rb
3Tl
11Cl
0.5and Cs
5.7K
2.3Tl
11Cl
0.6and K
4Rb
4Tl
11Cl
0.1.
Atom 1 Atom 2 Cs
8Tl
11Cl
0.8Cs
8Tl
11Br
0.9Cs
5Rb
3Tl
11Cl
0.5Cs
5.7K
2.3Tl
11Cl
0.6K
4Rb
4Tl
11Cl
0.1Tl2 Tl3 3.0656 (4) 3.0743 (2) 3.0605 (6) 3.0554 (7) 3.0564 (2) Tl2 Tl3
33.0632 (4) 3.0766 (2) 3.0896 (6) 3.0656 (4) 3.1298 (3) Tl1 Tl3
13.0894 (4) 3.1006 (2) 3.1049 (7) 3.0884 (8) 3.1274 (3) Tl3 Tl3
33.2019 (11) 3.2102 (4) 3.2025 (11) 3.1873 (11) 3.2104 (4) Tilt [°] 0.12 (2) 0.069 (7) 0.94 (2) 0.34 (5) 2.352 (7)
cdd/cd
av[%] 0.08 0.07 0.95 0.32 2.38
Figure 2.
Two perspectives (a) side view; (b) top view show the distortion of the trigonal prism in the Tl
117−cluster which results in the point group D
3for the cluster; Symmetry operations for the generation of equivalent atoms: #1: 1/3 + x − y, 2/3 − y, 7/6 − z; #2: 1/3 + y, − 1/3 + x, 7/6 − z; #3:
1 − y, x − y, z; #4: 1 – x + y, 1 − x, z; #5: 4/3 − x, 2/3 – x + y, 7/6 − z.
In Tables 2 and 3 the distances as well as the distortion angles are listed and the dependence on the amount of halide incorporation is clearly evident. In contrast, the height of the trigonal prism (Tl3–Tl3) as well as the distance of the capping atom Tl2 to the mean plane built by Tl3 atoms [d(Tl2-plane) = 0.5 Å in all compounds] do not significantly change. Based on these observations we introduced a cdd/cd
avratio (cdd: capping distance difference; cd
av: average capping distance;
(Equation (1)) which allowed for a quick estimation of the degree of distortion. The dependence of the cdd/cd
avratio on the amount of halide is conspicuous and therefore allows for the evaluation of the involvement of halide atoms by solely analyzing the distances between heavy atom positions.
Table 2.
Selected distances in [Å] (numbering scheme according to, values taken from [1,15]), tilt angle and cdd/cd
avvalue for K
8Tl
11and Rb
8Tl
11.
Atom 1 Atom 2 K8Tl11 Rb8Tl11
Tl2 Tl3 3.0476 (4) 3.060
Tl2 Tl3
33.1396 (4) 3.157
Tl1 Tl3
13.1304 (4) 3.147
Tl3 Tl3
33.2054 (7) 3.219
Tilt [
◦] 4.69 (2) 4.90
cdd/cd
av[%] 2.97 3.12
Table 3.
Selected distances in [Å] (numbering scheme according to), tilt angle and cdd/cd
avvalue for Cs
8Tl
11Cl
0.8, Cs
8Tl
11Br
0.9, Cs
5Rb
3Tl
11Cl
0.5and Cs
5.7K
2.3Tl
11Cl
0.6and K
4Rb
4Tl
11Cl
0.1.
Atom 1 Atom 2 Cs8Tl11Cl0.8 Cs8Tl11Br0.9 Cs5Rb3Tl11Cl0.5 Cs5.7K2.3Tl11Cl0.6 K4Rb4Tl11Cl0.1
Tl2 Tl3 3.0656 (4) 3.0743 (2) 3.0605 (6) 3.0554 (7) 3.0564 (2)
Tl2 Tl3
33.0632 (4) 3.0766 (2) 3.0896 (6) 3.0656 (4) 3.1298 (3)
Tl1 Tl3
13.0894 (4) 3.1006 (2) 3.1049 (7) 3.0884 (8) 3.1274 (3)
Tl3 Tl3
33.2019 (11) 3.2102 (4) 3.2025 (11) 3.1873 (11) 3.2104 (4)
Tilt [
◦] 0.12 (2) 0.069 (7) 0.94 (2) 0.34 (5) 2.352 (7)
cdd/cd
av[%] 0.08 0.07 0.95 0.32 2.38
cdd cd
av= | cd
2− cd
1|
cd2+cd1 2
; cd
1≤ cd
2(1)
Crystals2018,8, 319 6 of 10
4.2. Is There a Rb
8Tl
11Cl?
Despite numerous efforts we did not succeed in producing crystals of Rb
8Tl
11Cl of sufficient quality for a reliable determination of halide incorporation directly from the electron density maps.
The incorporation of halide cannot be completely ruled out at this point as there is some residual electron density at Wyckoff position 6b according to the position of the halide atom in the previously discussed compounds. The s.o.f. for a chlorine atom at this position refined to a value of 0.08. However, the cdd/cd
avratio of 2.4% compared to 3.0% (K
8Tl
11) and 3.1% (Rb
8Tl
11) and a tilt angle of 2.4
◦(K
8Tl
11: 4.7
◦, Rb
8Tl
11: 4.9
◦) are very similar to the values found in K
4Rb
4Tl
11Cl
0.1and suggest a minimal involvement of chloride. Therefore, we assume that Rb
8Tl
11Cl does exist, but the amount of incorporated chlorine is less than 10%, which also is in line with the stated observations of Corbett et al. from powder diffraction experiments.
4.3. How Do Mixed Cation Sites Affect the Amount of Halide Incorporation?
It needs to be emphasized that for the preparation of all compounds the same stoichiometric approach was employed and the dependence of the amount of halide incorporation on the cesium content is conspicuous. Therefore, the cation positions needed to be examined more in detail. There are two different cation positions in the asymmetric unit corresponding to Wyckoff position 36f for A1 and Wyckoff position 12c for A2. For Cs
8Tl
11X the A2 position showed the previously mentioned splitting. By taking this splitting as well as free s.o.f. values for the halide (later fixed at the s.o.f. value for Cs2A) into account, a significantly improved model could be refined (Figure 3).
Crystals 2018, 8, x FOR PEER REVIEW 6 of 10
4.2. Is There a Rb
8Tl
11Cl?
Despite numerous efforts we did not succeed in producing crystals of Rb
8Tl
11Cl of sufficient quality for a reliable determination of halide incorporation directly from the electron density maps.
The incorporation of halide cannot be completely ruled out at this point as there is some residual electron density at Wyckoff position 6b according to the position of the halide atom in the previously discussed compounds. The s.o.f. for a chlorine atom at this position refined to a value of 0.08.
However, the cdd/cd
avratio of 2.4% compared to 3.0% (K
8Tl
11) and 3.1% (Rb
8Tl
11) and a tilt angle of 2.4° (K
8Tl
11: 4.7°, Rb
8Tl
11: 4.9°) are very similar to the values found in K
4Rb
4Tl
11Cl
0.1and suggest a minimal involvement of chloride. Therefore, we assume that Rb
8Tl
11Cl does exist, but the amount of incorporated chlorine is less than 10%, which also is in line with the stated observations of Corbett et al. from powder diffraction experiments.
4.3. How Do Mixed Cation Sites Affect the Amount of Halide Incorporation?
It needs to be emphasized that for the preparation of all compounds the same stoichiometric approach was employed and the dependence of the amount of halide incorporation on the cesium content is conspicuous. Therefore, the cation positions needed to be examined more in detail. There are two different cation positions in the asymmetric unit corresponding to Wyckoff position 36f for A1 and Wyckoff position 12c for A2. For Cs
8Tl
11X the A2 position showed the previously mentioned splitting. By taking this splitting as well as free s.o.f. values for the halide (later fixed at the s.o.f.
value for Cs2A) into account, a significantly improved model could be refined (Figure 3).
Figure 3. Introduction of split positions and free s.o.f. values for the halide in Cs8
Tl
11Br
0.9results in an improved model (residual electron density maps, generated by Olex2 adapted from [23], with permission from © 2009 Wiley.
For Cs
5Rb
3Tl
11Cl
0.5and Cs
5.7K
2.3Tl
11Cl
0.6the position of A1 is mixed occupied by both alkali metals and the s.o.f. values for cesium on the mixed position are very similar to the s.o.f. values of the halide position. The position of A2 is only occupied by the heavier alkali metal cesium, which is in accordance with the observations of Corbett et al. for the binary A
8Tl
11phases [14]. In summary, this would mean a favored halide incorporation when cesium is present on both crystallographically independent alkali metal positions. To prove this assumption, we investigated the system K-Rb-Tl in a stoichiometric approach to produce K
4Rb
4Tl
11Cl which resulted in crystals of K
4Rb
4Tl
11Cl
0.1(besides the side products (K,Rb)
15Tl
27and (K,Rb)Cl). Careful investigation of the data of K
4Rb
4Tl
11Cl
0.1showed the splitting of the A2 position, whereby convergence of the refinement was achieved when A1 and one splitting position are mixed occupied by Rb and K. The second splitting position Rb2A is exclusively occupied by Rb. The overall s.o.f. for A2 was fixed at unity using a SUMP restraint. At the max. peak of the residual electron density a chlorine atom was placed of which the s.o.f. refined at 0.103 (13) and was fixed according to the s.o.f. of Rb2A (Figure 4).
Figure 3.
Introduction of split positions and free s.o.f. values for the halide in Cs
8Tl
11Br
0.9results in an improved model (residual electron density maps, generated by Olex2 [23]).
For Cs
5Rb
3Tl
11Cl
0.5and Cs
5.7K
2.3Tl
11Cl
0.6the position of A1 is mixed occupied by both alkali
metals and the s.o.f. values for cesium on the mixed position are very similar to the s.o.f. values of
the halide position. The position of A2 is only occupied by the heavier alkali metal cesium, which is
in accordance with the observations of Corbett et al. for the binary A
8Tl
11phases [14]. In summary,
this would mean a favored halide incorporation when cesium is present on both crystallographically
independent alkali metal positions. To prove this assumption, we investigated the system K-Rb-Tl in a
stoichiometric approach to produce K
4Rb
4Tl
11Cl which resulted in crystals of K
4Rb
4Tl
11Cl
0.1(besides
the side products (K,Rb)
15Tl
27and (K,Rb)Cl). Careful investigation of the data of K
4Rb
4Tl
11Cl
0.1showed the splitting of the A2 position, whereby convergence of the refinement was achieved when
A1 and one splitting position are mixed occupied by Rb and K. The second splitting position Rb2A is
exclusively occupied by Rb. The overall s.o.f. for A2 was fixed at unity using a SUMP restraint. At the
max. peak of the residual electron density a chlorine atom was placed of which the s.o.f. refined at
0.103 (13) and was fixed according to the s.o.f. of Rb2A (Figure 4).
Crystals2018,8, 319 7 of 10
Crystals 2018, 8, x FOR PEER REVIEW 7 of 10
Figure 4. Introduction of split positions and free s.o.f. values for the halide in K4
Rb
4Tl
11Cl
0.1results in an improved model (residual electron density maps, generated by Olex2 adapted from [23], with permission from © 2011 Olex2 Wiley.
The resulting coordination sphere of the halide is best described as distorted cubic, where the longer distances are along the room diagonal of the cubic arrangement from the halide to the position of A2. This distance shortens significantly for X-A2 by introducing split positions (same s.o.f.
as halide), resulting in a less distorted cubic arrangement (Figure 5). This cubic arrangement greatly resembles the coordination of the halide in the CsCl structure type (d(Cs-Cl) = 3.573 Å; d(Cs-Br) = 3.718 Å). The distances within the the distorted cubic arrangements as well as the s.o.f. values for the halide/split position in Cs
8Tl
11X (X = Cl or Br) and K
4Rb
4Tl
11Cl
0.1are listed in Tables 4 and 5 lists distances as well as s.o.f. values of the mixed occupied sites within Cs
5Rb
3Tl
11Cl
0.5and Cs
5.7K
2.3Tl
11Cl
0.6.
(a) (b)
Figure 5. Distorted cubic arrangement around the halide (a); respectively void (b). Cs1: x, y, z; Cs1#1:
1 − y, x − y, z; Cs1#2: 1−x + y, 1 − x. z; Cs1#3: 4/3 − x, 2/3 − y, 2/3 − z; Cs1#4: 1/3 + y, 2/3 – x + y, 273 − z;
Cs1#5: 1/3 + x − y, -1/3 + x, 2/3 − z; Cs2A/B: x, y, z; Cs2A/B#1: 4/3 − x, 2/3 − y, 2/3 − z.
Table 4. Distances in [Å] within the distorted cubic arrangement around the halide/void and s.o.f.
values for the halide/Cs2A (split position) in Cs
8Tl
11X (X = Cl or Br) and K
4Rb
4Tl
11Cl
0.1.
Position 1–Position 2 Cs
8Tl
11Br
0.9Cs
8Tl
11Cl
0.8Position 1–Position 2 K
4Rb
4Tl
11Cl
0.1Cs2A-X1 3.990 (2) 3.991 (9) Rb2A-X1 3.80 (2)
Cs2B-void 4.388 4.354 K2B/Rb2B-void 4.096 (3)
Cs1-X1/void 3.6705 (4) 3.5876 (7) K1/Rb1-X1/void 3.5994 (9) s.o.f. (X1/Cs2A) 0.924 (6) 0.76 (2) s.o.f. (X1/Rb2A) 0.103 (13)
Figure 4.Introduction of split positions and free s.o.f. values for the halide in K
4Rb
4Tl
11Cl
0.1results in an improved model (residual electron density maps, generated by Olex2 [23]).
The resulting coordination sphere of the halide is best described as distorted cubic, where the longer distances are along the room diagonal of the cubic arrangement from the halide to the position of A2. This distance shortens significantly for X-A2 by introducing split positions (same s.o.f. as halide), resulting in a less distorted cubic arrangement (Figure 5). This cubic arrangement greatly resembles the coordination of the halide in the CsCl structure type (d(Cs-Cl) = 3.573 Å; d(Cs-Br) = 3.718 Å). The distances within the the distorted cubic arrangements as well as the s.o.f. values for the halide/split position in Cs
8Tl
11X (X = Cl or Br) and K
4Rb
4Tl
11Cl
0.1are listed in Tables 4 and 5 lists distances as well as s.o.f. values of the mixed occupied sites within Cs
5Rb
3Tl
11Cl
0.5and Cs
5.7K
2.3Tl
11Cl
0.6.
Crystals 2018, 8, x FOR PEER REVIEW 7 of 10
Figure 4. Introduction of split positions and free s.o.f. values for the halide in K4
Rb
4Tl
11Cl
0.1results in an improved model (residual electron density maps, generated by Olex2 adapted from [23], with permission from © 2011 Olex2 Wiley.
The resulting coordination sphere of the halide is best described as distorted cubic, where the longer distances are along the room diagonal of the cubic arrangement from the halide to the position of A2. This distance shortens significantly for X-A2 by introducing split positions (same s.o.f.
as halide), resulting in a less distorted cubic arrangement (Figure 5). This cubic arrangement greatly resembles the coordination of the halide in the CsCl structure type (d(Cs-Cl) = 3.573 Å; d(Cs-Br) = 3.718 Å). The distances within the the distorted cubic arrangements as well as the s.o.f. values for the halide/split position in Cs
8Tl
11X (X = Cl or Br) and K
4Rb
4Tl
11Cl
0.1are listed in Tables 4 and 5 lists distances as well as s.o.f. values of the mixed occupied sites within Cs
5Rb
3Tl
11Cl
0.5and Cs
5.7K
2.3Tl
11Cl
0.6.
(a) (b)
Figure 5. Distorted cubic arrangement around the halide (a); respectively void (b). Cs1: x, y, z; Cs1#1:
1 − y, x − y, z; Cs1#2: 1−x + y, 1 − x. z; Cs1#3: 4/3 − x, 2/3 − y, 2/3 − z; Cs1#4: 1/3 + y, 2/3 – x + y, 273 − z;
Cs1#5: 1/3 + x − y, -1/3 + x, 2/3 − z; Cs2A/B: x, y, z; Cs2A/B#1: 4/3 − x, 2/3 − y, 2/3 − z.
Table 4. Distances in [Å] within the distorted cubic arrangement around the halide/void and s.o.f.
values for the halide/Cs2A (split position) in Cs
8Tl
11X (X = Cl or Br) and K
4Rb
4Tl
11Cl
0.1.
Position 1–Position 2 Cs
8Tl
11Br
0.9Cs
8Tl
11Cl
0.8Position 1–Position 2 K
4Rb
4Tl
11Cl
0.1Cs2A-X1 3.990 (2) 3.991 (9) Rb2A-X1 3.80 (2)
Cs2B-void 4.388 4.354 K2B/Rb2B-void 4.096 (3)
Cs1-X1/void 3.6705 (4) 3.5876 (7) K1/Rb1-X1/void 3.5994 (9) s.o.f. (X1/Cs2A) 0.924 (6) 0.76 (2) s.o.f. (X1/Rb2A) 0.103 (13)
Figure 5.Distorted cubic arrangement around the halide (a); respectively void (b). Cs1: x, y, z; Cs1#1:
1 − y, x − y, z; Cs1#2: 1 − x + y, 1 − x, z; Cs1#3: 4/3 − x, 2/3 − y, 2/3 − z; Cs1#4: 1/3 + y, 2/3 – x + y, 273 − z; Cs1#5: 1/3 + x − y, − 1/3 + x, 2/3 − z; Cs2A/B: x, y, z; Cs2A/B#1: 4/3 − x, 2/3 − y, 2/3 − z.
Table 4.
Distances in [Å] within the distorted cubic arrangement around the halide/void and s.o.f.
values for the halide/Cs2A (split position) in Cs
8Tl
11X (X = Cl or Br) and K
4Rb
4Tl
11Cl
0.1.
Position 1–Position 2 Cs8Tl11Br0.9 Cs8Tl11Cl0.8 Position 1–Position 2 K4Rb4Tl11Cl0.1
Cs2A-X1 3.990 (2) 3.991 (9) Rb2A-X1 3.80 (2)
Cs2B-void 4.388 4.354 K2B/Rb2B-void 4.096 (3)
Cs1-X1/void 3.6705 (4) 3.5876 (7) K1/Rb1-X1/void 3.5994 (9)
s.o.f. (X1/Cs2A) 0.924 (6) 0.76 (2) s.o.f. (X1/Rb2A) 0.103 (13)
Crystals2018,8, 319 8 of 10
Table 5.
Distances in [Å] within the cubic arrangement around the halide/void in Cs
5Rb
3Tl
11Cl
0.5and Cs
5.7K
2.3Tl
11Cl
0.6. The s.o.f. values for Cs at the mixed occupied A1 site resemble the s.o.f. values for the halide (numbering scheme according to Figure
5).Position 1–Position 2 Cs5Rb3Tl11Cl0.5 Cs5.7K2.3Tl11Cl0.6
A2-X1/void 4.099 (2) 4.002
A1-X1/void 3.6160 (13) 3.5492 (2)
s.o.f. (A1 = Cs) 0.521 (12) 0.612 (9)
s.o.f. (X1) 0.50 (4) 0.60 (4)
The same stoichiometric approach to produce the hitherto presented compounds also was employed by using solely potassium. Here, we only observed well crystallized halide-free K
8Tl
11and K
15Tl
27phases. The previously stated stability of the halide including A
8Tr
11X phases might not exclusively be caused by the effect of charge balance due to halide incorporation but by the stabilization of a preferably heavier halide atom in a distorted cubic arrangement including cesium preferentially (Figure 6). If less (or no) cesium is involved, then less (or even no) halide will be incorporated. If rubidium is involved as the heaviest alkali metal, then the amount of incorporated halide seems to be limited to approximately 10%. In return, the Tl
11clusters themselves seem to tolerate any charge between 7
−and 8
−.
Crystals 2018, 8, x FOR PEER REVIEW 8 of 10
Table 5. Distances in [Å] within the cubic arrangement around the halide/void in Cs5
Rb
3Tl
11Cl
0.5and Cs
5.7K
2.3Tl
11Cl
0.6. The s.o.f. values for Cs at the mixed occupied A1 site resemble the s.o.f. values for the halide (numbering scheme according to Figure 5).
Position 1–Position 2 Cs
5Rb
3Tl
11Cl
0.5Cs
5.7K
2.3Tl
11Cl
0.6A2-X1/void 4.099 (2) 4.002
A1-X1/void 3.6160 (13) 3.5492 (2) s.o.f. (A1 = Cs) 0.521 (12) 0.612 (9)
s.o.f. (X1) 0.50 (4) 0.60 (4)
The same stoichiometric approach to produce the hitherto presented compounds also was employed by using solely potassium. Here, we only observed well crystallized halide-free K
8Tl
11and K
15Tl
27phases. The previously stated stability of the halide including A
8Tr
11X phases might not exclusively be caused by the effect of charge balance due to halide incorporation but by the stabilization of a preferably heavier halide atom in a distorted cubic arrangement including cesium preferentially (Figure 6). If less (or no) cesium is involved, then less (or even no) halide will be incorporated. If rubidium is involved as the heaviest alkali metal, then the amount of incorporated halide seems to be limited to approximately 10%. In return, the Tl
11clusters themselves seem to tolerate any charge between 7
−and 8
−.
Figure 6. The unit cell of Cs8
Tl
11Br
0.9shows the two characteristic components: Tl
11clusters and the distorted cubic arrangement around the halide atom.
Author Contributions: Conceptualization, S.G.; Methodology, S.G., S.T., B.H., S.S.; Validation, S.G.; Formal
Analysis, S.G., S.S., B.H.; Investigation, S.G., S.T.; Resources, N.K.; Writing-Original Draft Preparation, S.G., S.T.; Writing-Review & Editing, S.G.; Visualization, S.G., S.T.; Supervision, S.G.; Project Administration, S.G.
Funding: This work was supported by the German Research Foundation (DFG) within the funding programme
Open Access Publishing.
Acknowledgment: The authors thank Marc Schlosser (working group of A. Pfitzner) for collecting the powder
diffraction patterns and Dr. Michael Bodensteiner (X-ray Structure department) for discussions concerning the refinement of (K,Rb)
8Tl
11Cl
0.1.
Conflicts of Interest: The authors declare no conflict of interest.
Figure 6.
The unit cell of Cs
8Tl
11Br
0.9shows the two characteristic components: Tl
11clusters and the distorted cubic arrangement around the halide atom.
Author Contributions:
Conceptualization, S.G.; Methodology, S.G., S.T., B.H., S.S.; Validation, S.G.; Formal Analysis, S.G., S.S., B.H.; Investigation, S.G., S.T.; Resources, N.K.; Writing-Original Draft Preparation, S.G., S.T.;
Writing-Review & Editing, S.G.; Visualization, S.G., S.T.; Supervision, S.G.; Project Administration, S.G.
Funding:
This work was supported by the German Research Foundation (DFG) within the funding programme Open Access Publishing.
Acknowledgments:
The authors thank Marc Schlosser (working group of A. Pfitzner) for collecting the powder diffraction patterns and Dr. Michael Bodensteiner (X-ray Structure department) for discussions concerning the refinement of (K,Rb)
8Tl
11Cl
0.1.
Conflicts of Interest:
The authors declare no conflict of interest.
Crystals2018,8, 319 9 of 10
Appendix
Stoichiometric approaches
Cs
8Tl
11Cl
0.8: 0.445 g Cs (3.3 mmol), 1.076 g Tl (5.3 mmol Tl) and 0.081 g CsCl (0.51 mmol) Cs
8Tl
11Br
0.9: 0.413 g Cs (3.1 mmol), 0.998 g Tl (4.9 mmol Tl) and 0.091 g CsBr (0.44 mmol)
Cs
5Rb
3Tl
11Cl
0.5: 0.246 g Cs (1.9 mmol), 0.128 g Rb (1.5 mmol), 1.124 g Tl (5.5 mmol) and 0.061 g RbCl (0.5 mmol)
Cs
5.7K
2.3Tl
11Cl
0.6: 0.264 g Cs (2 mmol), 0.058 g K (1.5 mmol), 1.117 g Tl (5.5 mmol) and 0.037 g KCl (0.5 mmol)
K
3.98Rb
4.02Tl
11Cl
0.1: 0.154 g Rb (1.8 mmol), 0,052 g K (1.3 mmol), 1.0134 g Tl (5 mmol) and 0.034 g KCl (0.45 mmol)
References
1. Gärtner, S.; Korber, N. Polyanions of group 14 and group 15 elements in alkali and alkaline earth metal solid state compounds and solvate structures. In Zintl Ions Principles and Recent Developments, Fässler, T.F., Ed.;
Springer: Berlin, Germany, 2011; pp. 25–56.
2. Gärtner, S.; Korber, N. Chapter 1.09-Zintl anions. In Comprehensive Inorganic Chemistry II, 2nd ed.; Reedijk, J., Poeppelmeier, K., Eds.; Elsevier: Amsterdam, The Netherlands, 2013; pp. 251–267.
3. Corbett, J.D. Polyanionic clusters and networks of the early p-element metals in the solid state: Beyond the zintl boundary. Angew. Chem. Int. Ed.
2000,39, 670–690. [CrossRef]
4. Scharfe, S.; Kraus, F.; Stegmaier, S.; Schier, A.; Fässler, T.F. Zintl ions, cage compounds, and intermetalloid clusters of group 14 and group 15 elements. Angew. Chem. Int. Ed.
2011,50, 3630–3670. [CrossRef] [PubMed]
5. Zintl, E.; Goubeau, J.; Dullenkopf, W. Salzartige Verbindungen und intermetallische Phasen des Natriums in flüssigem Ammoniak. Z. Phys. Chem.
1931,154, 1–46. [CrossRef]
6. Zintl, E.; Dullenkopf, W. Über den Gitterbau von NaTl und seine Beziehung zu den Strukturen des
β-Messings.Z. Phys. Chem.
1932,B16, 195–205. [CrossRef]
7. Eisenmann, B.; Cordier, G. Structural patterns of homo-and heteronuclear anions in zintl phases and related intermetallic compounds and concepts for their interpretation. In Chemistry, Structure and Bonding of Zintl Phases and Ions; Kauzlarich, S.M., Ed.; VCH Verlagsgesellschaft mbH: Weinheim, Germany, 1996; pp. 61–137.
8. Guloy, A.M. Polar intermetallics and zintl phases along the zintl border. In Inorganic Cemistry in Focus III;
Wiley-VCH Verlag GmbH & Co.: Weinheim, Germany, 2006.
9. Hansen, D.A.; Smith, J.F. Structure and bonding model for Na
2Tl. Acta Cryst.
1967,22, 836–845. [CrossRef]
10. Marsh, R.E.; Shoemaker, D.P. The crystal structure of NaPb. Acta Cryst.
1953, 197–205. [CrossRef]11. Busmann, E. Die kristallstrukturen von KSi, RbSi, KGe, RbGe und CsGe. Z. Anorg. Allg. Chem.
1961,313, 90–106. [CrossRef]
12. Lorenz, C.; Gärtner, S.; Korber, N. Ammoniates of zintl phases: Similarities and differences of binary phases A
4E
4and their corresponding solvates. Crystals
2018,8, 276. [CrossRef]
13. Blase, W.; Cordier, G.; Muller, V.; Haussermann, U.; Nesper, R.; Somer, M. Preparation and crystal-structures of Rb
8In
11,K
8Tl
11, and Rb
8Tl
11band-structure calculations on K
8In
11. Z. Naturforsch. B
1993,48, 754–760.
[CrossRef]
14. Dong, Z.-C.; Corbett, J.D. A
8Tl
11(A = K, Rb, or Cs) Phases with Hypoelectronic Tl
117−cluster anions:
Syntheses, structure, bonding and properties. J. Cluster Sci.
1995,6, 187–201. [CrossRef]
15. Dong, Z.C.; Corbett, J.D. A
15Tl
27(A = Rb,Cs): A structural type containing both isolated clusters and condensed layers based on the tl-11 fragment. Syntheses, structure, properties, and band structure. Inorg.
Chem.
1996,35, 1444–1450. [CrossRef] [PubMed]
16. Sevov, S.C.; Corbett, J.D. A remarkable hypoelectronic indium cluster in K
8In
11. Inorg. Chem.
1991,30, 4875–4877. [CrossRef]
17. Wang, F.; Wedig, U.; Prasad, D.; Jansen, M. Deciphering the chemical bonding in anionic thallium clusters. J.
Am. Chem. Soc.
2012,134, 19884–19894. [CrossRef] [PubMed]
18. Henning, R.W.; Corbett, J.D. Cs
8Ga
11, a new isolated cluster in a binary gallium compound. A family of valence analogues A
8Tr
11X: A = Cs, Rb; Tr = Ga, In, Tl; X = Cl, Br, I. Inorg. Chem.
1997,36, 6045–6049.
[CrossRef] [PubMed]
Crystals2018,8, 319 10 of 10

![Figure 3. Introduction of split positions and free s.o.f. values for the halide in Cs 8 Tl 11 Br 0.9 results in an improved model (residual electron density maps, generated by Olex2 adapted from [23], with permission from © 2009 Wiley](https://thumb-eu.123doks.com/thumbv2/1library_info/3936776.1532443/6.892.138.759.568.767/figure-introduction-positions-improved-residual-electron-generated-permission.webp)
![Table 5. Distances in [Å] within the cubic arrangement around the halide/void in Cs 5 Rb 3 Tl 11 Cl 0.5 and Cs 5.7 K 2.3 Tl 11 Cl 0.6](https://thumb-eu.123doks.com/thumbv2/1library_info/3936776.1532443/8.892.325.568.524.884/table-distances-å-cubic-arrangement-halide-void-cs.webp)
