Agricultural & Applied Economics Association
The Cost of Subsistence Author(s): George J. Stigler Reviewed work(s):
Source: Journal of Farm Economics, Vol. 27, No. 2 (May, 1945), pp. 303-314
Published by: Oxford University Press on behalf of the Agricultural & Applied Economics Association Stable URL: http://www.jstor.org/stable/1231810 .
Accessed: 23/01/2013 12:05
Your use of the JSTOR archive indicates your acceptance of the Terms & Conditions of Use, available at . http://www.jstor.org/page/info/about/policies/terms.jsp
.
JSTOR is a not-for-profit service that helps scholars, researchers, and students discover, use, and build upon a wide range of content in a trusted digital archive. We use information technology and tools to increase productivity and facilitate new forms of scholarship. For more information about JSTOR, please contact support@jstor.org.
.
Agricultural & Applied Economics Association and Oxford University Press are collaborating with JSTOR to digitize, preserve and extend access to Journal of Farm Economics.
http://www.jstor.org
THE COST OF SUBSISTENCE GEORGE J. STIGLER
University of Minnesota
LABORATE investigations have been made of the adequacy of diets at various income levels, and a considerable number of "low-cost," "moderate," and "expensive" diets have been rec- ommended to consumers. Yet, so far as I know, no one has deter- mined the minimum cost of obtaining the amounts of calories, protein, minerals, and vitamins which these studies accept as ade- quate or optimum. This will be done in the present paper, not only for its own interest but because it sheds much light on the meaning of conventional "low-cost" diets.
This paper is organized under five headings, devoted to
1. The quantities of the various nutrients which should be con- tained in an average person's diet.
2. The quantities of these nutrients which are found in certain common foods.
3. The methodology of finding the minimum cost diet.
4. The minimum cost diet in August 1939 and August 1944.
5. Comparison with conventional low-cost diets.
The curious may wish to turn first to Table 2, which gives the com- position and cost of the most economical diets in August 1939 and 1944 for an active economist (weighing 70 kilograms) who lives in a large city.
Nutritive Requirements
The economist uses a production function to describe the rela- tionship between the quantities of the productive services and the quantity of product. The product derived from an increment of pro- ductive service A is usually assumed (1) to diminish as the quantity of A increases, and (2) to depend upon the quantities of the other productive services used with A.
This approach can be applied also to the relationship between quantities of nutrients and "health" (used here generically to de- scribe strength, vigor, avoidance of disease, etc.). The findings of nutrition studies clearly indicate:
1. After certain minimum values of the nutrients are secured, additional quantities yield decreasing (and in some cases eventually negative) returns to health.
2. The optimum quantity of any nutrient depends upon the quantities of the other nutrients available.
808
GEORG1 J. STIGLER
A few of the many illustrations of these findings may be given.
Diminishing returns is illustrated by the facts that the amount of calcium in the body increases much more slowly than the input of calcium, and that increases of longevity are not proportional to increases of calcium inputs.' The incidence of goiter was found to vary in inverse proportion to the amount of iodine in the water in Michigan localities.2 An example of substitution is the recommenda- tion of 30 micrograms of thiamine per 100 calories not derived from fats,3 and one of complementarity is the loss of riboflavin which ac- companies a deficiency of thiamine.4
The science of nutrition is much too young to have attained even an approximate measurement of the "health" function for repre- sentative individuals, or to determine the extent of individual varia- tion. The optimum quantity of calories is known fairly accurately, but the requirements of other nutrients are known only roughly or not at all. Many minima (to which 50 percent is usually added as a safety factor) are found by determining the lowest level of input compatible with a stable rate of loss of the nutrient through ex- creta. It is probable that nutrient requirements have been over- stated; for example, a 5 month experiment on young men with riboflavin held at less than two-thirds of the recommended level led to the conclusion that they did not suffer any clinical or physiologi- cal defects.5 The interrelationships among the various nutrients are even more obscure, and they are virtually ignored in dietary recommendations.
The ultimate health function will doubtless be very complex. In addition to calories, the body requires about thirteen minerals (some in very minute quantities), and perhaps half as many vita- mins. Protein contains two dozen amino acids, of which almost
1 Sherman, H. C., H. L. Campbell, and C. S. Lanford, "Experiments on the Relation of Nutrition to the Composition of the Body and the Length of Life,"
Proceedings of the National Academy of Science, XXV (1939), 16-20.
2 Curtis, G. M. and M. B. Fertman, "Iodine in Nutrition," Journal of the Ameri- can Medical Association, Vol. 121 (February 6, 1943), p. 423.
3 Sherman, H. C., Chemistry of Food and Nutrition (6th ed., 1941), p. 360.
4 Sure, B., "Vitamin Interrelationships, III," Journal of Nutrition, XXVII (1944), 447-52.
6 The tests were made on conscientious objectors; see A. Keys, A. F. Henschel, O. Mickelsen, J. M. Brozek, and J. H. Crawford, "Physiological and Biochemical Functions in Normal Young Men on a Diet restricted in Riboflavin," Journal of Nutrition, XXVII (1944), 165-78. Similar results were found for thiamine when the daily output was .9 mg.; see A. Keys, A. F. Henschel, O. Mickelsen, and J. M.
Brozek, "The Performance of Normal Young Men on Controlled Thiamine In- takes," Journal of Nutrition, XXVI (1943), 399-415.
304
THE COST OF SUBSISTENCE
half are necessary to human beings.6 The precise determination of our needs for these-and no doubt other yet undiscovered-nu- trients lies far in the future.
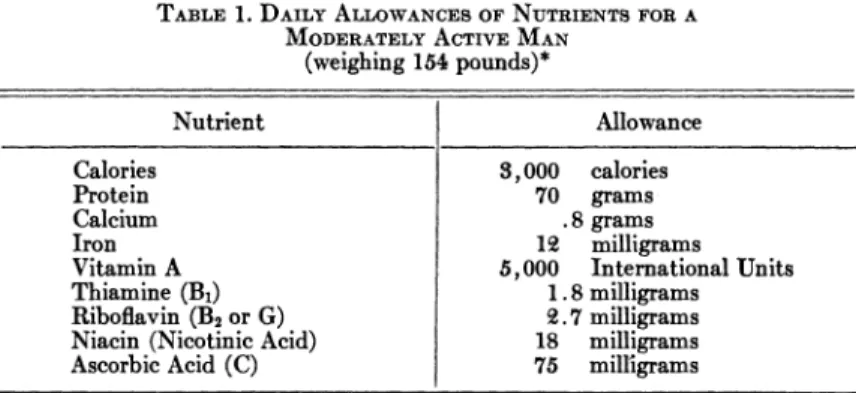
Nevertheless standards of dietary adequacy have been estab- lished, perhaps prematurely and certainly very tentatively. The
"allowances" (a term used to indicate their preliminary nature) of the National Research Council embody what is presumably the 1943 consensus of the experts; they are given in Table 1. Other minerals and vitamins are believed to be supplied in adequate quan- tities if these nutrients are secured from natural foods. The require- ments are net of losses in the preparation of food. These standards are met by the minimum cost diets derived subsequently.
TABLE 1. DAILY ALLOWANCES OF NUTRIENTS FOR A MODERATELY ACTIVE MAN
(weighing 154 pounds)*
Nutrient Allowance
Calories 3,000 calories
Protein 70 grams
Calcium .8 grams
Iron 12 milligrams
Vitamin A 5,000 International Units
Thiamine (B1) 1.8 milligrams
Riboflavin (B2 or G) 2.7 milligrams
Niacin (Nicotinic Acid) 18 milligrams
Ascorbic Acid (C) 75 milligrams
* National Research Council, Recommended Dietary Allowances, Reprint and Circular Series No. 115, January, 1943.
Nutritive Values of Foods
The minimum cost of an adequate diet is obviously governed by the nutritive values and costs of the foods eligible for inclusion.
The very restricted list of foods considered in this study is discussed in Section 3 and the foods are listed in Tables A and B. It may be mentioned here that only natural foods are included; vitamin pills are excluded because they do not contain all of the nutrients (known and unknown) which are necessary to good health.7
The nutritive values of common foods are known only roughly,
6 For summaries of the present knowledge, see Yearbook of Agriculture, 1939, Food and Life; H. C. Sherman, Chemistry of Food and Nutrition (6th ed., 1941).
7 Puppies put on a diet in which the vitamins were provided from synthetic sources lived only 100 to 150 days; see J. P. Lambooy and E. S. Nasset, "The Inadequacy of Eight Synthetic B Vitamins for the Nutrition of Puppies," Journal of Nutrition, XXVI (1943), 293-302.
305
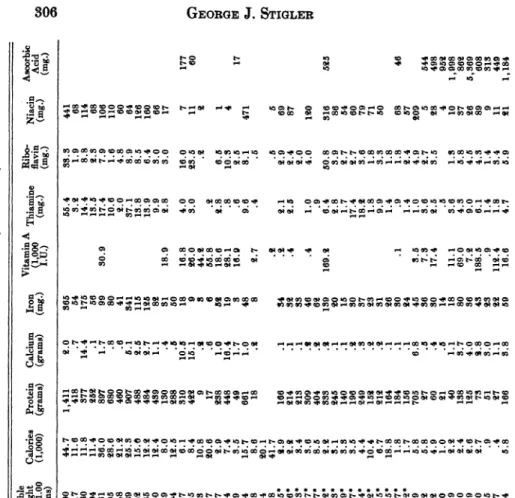
TABLE A. NUTRITIVE VALUES OF COMMON FoODS PER DOLLAR OF EXPENDITURE, AUGUST 15, 1939
Price EdibleVianA io
Commodity Unit Aug. 15. 1989 per $1.00 Weight Calories (1,000) (grams) Protein Calcium (grams) (m Io iai (1,00 Thia mi am. nemga.inAci Rio Niai Ascorbic
(cents) (grams) I.U.) mg) (g)(mg.) (mg.) 0
0)
**1. Wheat Flour (Enriched) 10 lb. 86. 0 12, 600
2. Macaroni 1 lb. 14.1 8,217
8. Wheat Cereal (Enriched) 2.8 oz. 24.2 8,2t80
4 . Corn Flakes S oz. 7.1 8,194
5. Corn Meal 1 lb. 4.6 9,861
6. Hominy-Grits 24 oz. 8.5 8,005
7. Rice 1 lb. 7.5 6,048
s. RAolled Oats i lb. 7.1 6,889
9. White Bread (Enriched) 1 lb. 7.9 5,742, 10. Whole Wheat Bread 1 lb. 9.1 4,985
11. Rye Bread 1 lb. 9.2 4,980
12. Pound Cake 1 lb. 24.8 1,829
18. Soda Crackers 1 lb. 15.1 8,004
14. Milk 1 qt. 11.0 8,867
"*15. Evaporated Milk (can) 14i oz. 6.7 6,085
16. Butter 1 lb. 80.8 1,478
*17. Oleomargarine 1 lb. 16.1 2,817
15. Eggs 1 doz. 82.6 1,857
"19. Cheese (Cheddar) i lb. 2,4.2 1,874
20. Crea pt. 14.1 1,689
21. Peanut Butter li b. 17.9 2,554
22. Mayonnaise * pt 16.7 1,198
28. Crisco 1lFb. 20.8 2,284
24. Lard 1 lb. 9.8 4,628
25. Sirloin Steak 1 lb. 89.6 1,145*
26. Round Steak 1 lb. 86.4 1,2.46*
27. Rib Roast 1 lb. 29.2 1,558*
2R. Chuck Rhoast 1 lb. 22 6 2,007'
29. Plate 1 lb. 14.6 8,107'
"830. Liver (Beef) 1 lb. 26.8 1,692'
81. Leg of Lamb 1 lb. 27.6 1,648'
82.. Lamib Chops (Rib) 1 lb. 86.6 1,289'
88. Pork Chops 1 lb. 80.7 1,477'
84. Pork Loin Roast I lb. 2,4.2, 1,874*
85. Bacon 1 lb. 25.6 1,772'
86. Ham-smoked 1 lb. 27.4 1,655'
87. Salt Pork l lb. 16.0 2,835'
88. Roasating Chicken 1 lb. 80.8 1,497'
89. Veal Cutlets 1 lb. 42.3 1,072'
40. Salmon, Pink (can) 16 oz. 18.0 8,489
41. Apples 1 lb. 4.4 9,072
42. Bananas 1 lb. 6.1 4,982
48. Lemons 1 doz. 26.0 2,880
44. Oranges 1 doz. 80.9 4,489
'45. Green Beans 1 lb. 7.1 5,750
"'46. Cabbage 1 lb. 8.7 8,949
47. Carrotis I bunch 4.7 6,080
48. Celery 1 stalk 7.8 8,915
49. Lettuce 1 head 8.2I 2.,247
'50. Onions 1 lb. 8.6 11,844
44.7 11.6 11.8 11.4 86. 0 28.6 21.2t 15.8 12.2.
12.4 8.0 12.5 6.1 8.4 10.8 210.6
2.9 7.4 8.5 15.7 8.6 2.0.1 41.7 8.4 8.6 8.5 2.2 8.5 4.4 10.4 6.7 18.8 1.8 1.7 5.8 5.8 4.9 1.0 21.2 2.4 2. 6 2.7 .9 .4 5.8
1,411 21.0 865
418 .7 54
877 14.4 175
252 .1I 56
897 1.7 99 80.9
680 .8 80
460 .6 41
907 5.1 841
488 2.5 115
484 2.7 125
489 1.1 82
180 .4 S1 18.9
2188 .5 50
810 10.5 18 16.8
422. 15.1 9 26. 0
9 .2 8 44.2
17 . 6 6 55.8
288 1.0 52 18. 6
448 16.4 19 218.1
49 1.7 8 16.9
661 1.0 48
18 . 2 8 2. 7
166 2,14 218 800 404 888 2!45 140 196 249 152 2129 164 184 156 705 27 60 911 40 1388 1925 78 51 2.7 166
. I .1I . I .2 .2 . 1 .91 .2 .8 .2 .1 . 1 6.8 .5 .4 .5 1.1 8.7 4.0 2.8 8.0 1.1 8.8
54 82, 88 46 62 189 20 15 80 87 283 81 26 30 24 45 86 80 14 18 80 86 48 28 922 59
.2 .92 .4 .4 169.21
. 1 8.5 7.8 17.4 11.1 69.0 7.2t 188.5 . 9 112.4 16.6
55.4 8.2t 14.4 18.5 17.4 10.6 2. 0 87.1 18.8 18.9 9.9 2.8 4.0 S. 0 . 2 21.8 . 8 .60 9.6
. 4 2.1 2.5 1.0 . 9 6.4 2. 8 1.7 17.4 18.2 1.8 9.9 1.4 . 9 1.4 1.0 8.6 2.5 .56 8. 6 4.8 9.0 6. 1 1.4 1.8 4.7
88.83 441
1.9 68
8.8 114
2.83 68
7.9 106
1.6 110
4.8 60
8.9 64
8.5 126
6.4 160
8.0 66
3.0 17
16.0 7
283.5 1 1
. 2 21
6. 5 1
10.8 4
2. 5
8.1 471
2. 9 69
2.4 87
2.0
4.0 120
50.8 816
8.9 86
2. 7 54
2.7 60
8.6 79
1.8 71
8.8 50
1.8
1.8 68
2. 4 57
4.9 209
2.7 5
8.5 28
4
1.8 10
5.8 87
4.5 26
4.8 89
1.4 9
8.4 11
5.9 2.1
177
60 0
tIT 0 0
17 t1
464
49 5952
1,998 862. 5,8369
608 818 449 1,184
*51. Potatoes
"N2. Spinach
5553. Sweet Potatoes
54. Peaches (can) 55. Pears (can) 56. Pineapple (can) 57. Asparagus (can) 58. Green Beans (can)
59. Pork and Beans (can) 60. Corn (can) 61. Peas (can)
62. Tomatoes (can) 63. Tomato Soup (can)
*64. Peaches, Dried
*65. Prunes, Dried 66. Raisinsi, Dried 67. Peas, Dried
**8 Lima Beans, Dried
**69. Navy Beans, Dried 70. Coffee
71. Tea 72. Cocoa 73. Chocolate 74. Sugar 73. Corn Sirup 76. Molasses
77. Strawberry Preserves
15 lb. 34.0 16,810
1lIb. 8.1I 4,592
Illb. 5.1 7,649
No. tj 16.8 4,894 No. * t0. 4 4,030
No, t !21.38 3,993
No.2 2.7.7 1,945 No. 2 10.0 5,386
16 oz. 7.1 6,389
No.2i 10.4 5,452 No.29 13.8 4,109
No. 2 8.6 6,203
lOijoz. 7.6~ 3,917
I b. 15.7 2,889
l lb. 9.0 4,2.84
lS oz. 9.4 4,52
IlIb. 7.9 5,742
I lb. 8.9 5,097
1lIb. 5.9 7,688
1 lb. 22. 4 2,02,5
jilb. 17.4 652.
S oz. 8.6 2,637
S oz. 16.2 1,400
10 lb. 51.7 8,773
24 oz. 13.7 4,966
IS oz. 13.6 3,752.
l lb. 20.5 2.,213
14.3 336 1.8 118 6.7 29.4 7.1 198 2,522.
1.1 106 - 138 918.4 5.7 13.8 33 2,,755
9.6 138 2.7 54 2,90.7 8.4 5.4 83 1, 912
3.7 20 .4 10 21.5 .5 1.0 31 196
3.0 8 .3 8 .8 .8 .8 5 81
2. 4 16 .4 8 2.0 2.8 .8 7 399
.4 33 .3 12 16.3 1.4 2.1 17 2.72
1.0 54 2.0 65 53.9 1.6 4.3 32 431
7.5 364 4.0 134 3.5 8.3 7.7 56
5.2 136IS .2 16 121.0 1.6 2.7 42, 218
2.3 136 .6 45 84.9 4.9 2.5 37 870
1.3 63 .7 38 53.2 3.4 21.5 36 1,2.53
1.6 71 .8 43 57.9 3.5 2.4 67 862
8.5 87 1.7 173 86.8 1.2 4.3 55 57
12. 8 99 21.5 154 85.7 3.9 4.3 65 257
13.5 104 2.5 136 4.5 6.3 1.4 24 136
20.0 1,367 4.2 345 2.9 2.8.7 18.4 162,
17.4 1,055 3.7 459 5.1 26.9 38. 93
26.9 1,691 11.4 792 38.4 24.6 217
- - - - 4.0 5.1 50
- - - - 2.3 42
8.7 237 3.0 72. 2.0 11.9 40
8.0 77 1.3 39 .9 3.4 14
34.9 - - -
14.7 - .5 74 5
9.0 - 10.3 244 1.9 7.5 146
6.4 11 .4 7 .2 .2 .4 3
0
*Quantities including inedible portions. (12
wi
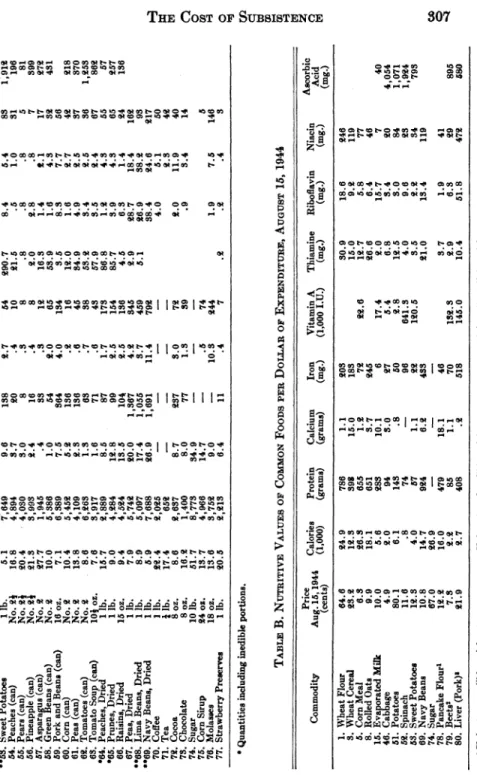
TABLE B. NuTRITIVE VALUES3 OF CommoN FoODS PER DOLLAR oF ExPENDITUREc, AUGUST 15, 1944w
Price . Ascorbic Z
Commodity Aug 15,1,944 Calories Protein Calcium Iron Vitamin A Thiamine Riboflavin Niacin Acid0
(cets (1,000) (grams) (grams) (mg.) (1,000 L.U.) (mg.) (mg.) (mg.) (mg.
1. Wheat Flour 64.6 24.9 786 1.1 203 30.9 18.6 246
3. Wheat Cereal 23.2. 12.3 398 15.0 183 15.0 9.2. 119
S. Corn Meal 6.3 26.3 655 1.21 72 221.6 12.7 5.8 77
8. Rolled Oats 9.9 18.1 651 3.7 245 26.6 6.4 46
15. Evaporated Milk 10.0 5. 6 283s 10.1 6 17.4 21.0 15.7 7 40
46. Cabbage 4.9 2.0 94 5.0 217 5.4 6.8 3.4 2.0 4,054
51. Ptatoes 80.1 6.1 143 .8 50 2.8 12.5 3.0 84 1,071
52. Spinach 11.6 . 8 74 - 96 641.3 4.0 9.6 23 1,924
53. Sweet Potatoes 12. 3 4.0 57 1.1 22 12.0.5 3.5 2.2 34 793
69. Navy Beans 10.8 14.7 924 6.2t 433 21. 0 18.4 119
74. Sugar 67.0 2.6.9 - - -
78. Pancake Flour' 121.2 16.0 479 18.1 46 3.7 1.9 410
79. Beets2 7.3 2.2 85 1.1 70 132.3 21.9 6.3 29 895
80. Liver (Pork)l 21. 9 2.7 408 .2. 518 145.0 10.4 51.8 472 580
I Unit: 20 oz.; edible weight: 4,647 g. 2 Unit: 1 bunch; edible weight: 4,971 g. a Unit: I lb.; edible weight: 5Z,071 g.
GEORGE J. STIGLER
and indeed they can be known only roughly. A large margin of un- certainty arises on several scores:
1. Many nutritive values have not been established quantitatively, or have been determined by obsolete and inaccurate techniques, or the determinations have large standard errors. Beef flank is known to contain the B complex, but the quantities are unknown. Vitamin A is measured by the rate of growth of rats, with standard errors averaging 10 or 15 percent of the mean values.
2. Most foods are not even approximately homogeneous, and wide ranges of nutritive values are found. For example, the milligrams of ascorbic acid in 100 grams of apples varies as follows with variety:8
Jonathan 4.4
McIntosh 2.0
Northern Spy 11.0
Ontario 20.8
Winesap 5.8
Winter Banana 6.6
Again, the ascorbic acid in milk varies with the season.
3. The maturity of the product, the length and conditions of storage, temperature, and similar factors are important. The ascorbic acid decreases with the maturing of corn, but the vitamin A content in- creases. Vitamin A, thiamine, and ascorbic acid are often lost during storage.
4. Even when the nutritive values of the food are known, they are much affected by the way the food is prepared. Well-done rib roasts of beef have 69 percent of the thiamine, 77 percent of the riboflavin, and 79 percent of the niacin present in the raw cuts. Cabbage has a high as- corbic acid content, but if it is boiled for several hours and the liquid discarded, virtually none of the vitamin survives. On the other hand the vitamin A in turnip greens is increased by cooking.
5. The proportion of food wasted is an additional unknown in the eval- uation of ordinary diets.9
6. The nutrients in foods cannot be wholly extracted. Spinach contains much calcium but it is not nutritionally available because of the pres- ence of oxalic acid.
Enough difficulties have been indicated to suggest the almost in- finite complexity of a refined and accurate assessment of nutritive value of a diet.
8 On this and subsequent points, see L. E. Booher, E. R. Hartzler, and E. M.
Hewston, A Compilation of the Vitamin Values of Foods in Relation to Processing and Other Variants, Department of Agriculture, Circular 638 (May 1942); and G. Adams and S. L. Smith, The Vitamin Content and the Preservation of Foods, Department of Agriculture, Miscell. Public. No. 536 (1944).
9 Another difficulty that may be mentioned in this connection is the variation in the quantity of food received for a given price, as when oranges are purchased by the dozen and celery by the stalk.
308
THE COST OF SUBSISTENCE
In the subsequent work, I use C. Chatfield and G. Adams' Proxi- mate Composition of American Food Materials for estimates of in- edible refuse, calories, and protein.10 The data on minerals and vitamins are from the unusually complete summary by A. D.
Bowes and C. F. Church, Food Values of Portions Commonly Used."
In light of the foregoing remarks it should not be necessary to be- labor the tentativeness of the figures.
The average nutritive values used are those of the foods as pur- chased. The losses due to waste and faulty preparation are ignored, as in most diet appraisals,l2 in part for the common reason that virtually nothing is known about the extent of these losses. But there is also the reason that these losses are largely avoidable, and a person who wished to minimize the cost of his food could reduce them to inappreciable amounts.
Methodology
The first step is to select a list of potential commodities; obvi- ously the wider this list the lower the cost of the "adequate" diet will probably be. The list here chosen consists of the commodities for which retail prices are reported by the Bureau of Labor Statis- tics.l3 The list is reproduced in Table A, along with the nutritive values of one dollar's expenditures on each commodity.
The BLS list is a short one, and it excludes almost all fresh fruits, nuts, many cheap vegetables rich in nutrients, and fresh fish. It is beyond question that with a fuller list the minimum cost of meeting the National Research Council's allowances could be reduced, possibly by a substantial amount.14
Since the prices are averages of many (large) cities, the mini- mum cost diet will in principle be affected by seasonal price pat- terns and should be computed separately for each month. This ef- fect will not prove to be great because seasonal foods play little
10 Department of Agriculture, Circular 549, June 1940.
" Privately printed, Philadelphia (5th ed., 1944).
12 Diets of Families of Employed Wage Earners and Clerical Workers in Cities, Department of Agriculture, Circular 507, January 1939; Family Food Consumption and Dietary Levels, Department of Agriculture, Miscellaneous Publication 405,1941.
13 The commodities are described in Retail Prices of Food, 1923-36, Bureau of Labor Statistics, Bulletin 635, October 1937. The price quotations are averages of 51 large cities in 1939 and 56 cities in 1944; they were taken from the Monthly Labor Review, October 1939 and December 1944.
14 A physiological chemist to whom I showed the diets recommended in turn a mixture he fed to rats, which would (in 1945) cost a man about $27 a year.
309
GEORGE J. STIGLER
part in the minimum cost diet.15 It may be noted also that since the prices are averages, they overstate the cost for a representative city because a food with lower-than-average price can be exploited and a food with higher-than-average price curtailed.
As a first step in finding the minimum cost diet, one may exclude any commodity all of whose nutritive values (per dollar of expen- diture) are less than those of some other commodity. This pro- cedure is carried a trifle farther in practice, by excluding also a commodity which is definitely inferior to another in its important nutrients and only slightly superior in others. For example, white bread (commodity no. 9) has less than half the nutrients (per dol- lar) of white flour (commodity no. 1) except for calcium, for which neither commodity is an economical source. This preliminary weed- ing reduces the list of eligible foods from 77 to 15, and excludes all meats except liver, all sugars, beverages, and patented cereals. The survivors are starred in Table A.
Thereafter the procedure is experimental because there does not appear to be any direct method of finding the minimum of a linear function subject to linear conditions. By making linear combina- tions of various commodities it is possible to construct a composite commodity which is superior in all respects to some survivor, and by this process the list of eligible commodities can be reduced at least to 9 (which are double starred in Table A). The nutritive values of each of these commodities is then expressed in terms of days' supply of requirements. Various combinations of commodities were used to fulfill certain nutrient requirements,16 and the one finally chosen is presented in Section 4. There is no reason to be- lieve that the cheapest combination was found, for only a handful of the 510 possible combinations of commodities were examined.17 On the other hand the annual cost could not have been reduced by more than a few dollars by a better selection from these com- modities.18
16 Although it is possible that if the diets had been constructed with prices for some other month, other foods would have been chosen.
16 An excess of calories is objectionable, but there is no reason to expect ill effects of moderately excessive intakes of the other nutrients. In the test of various combi- nations of foods, those nutrients (in addition to calories) which would, if fulfilled, necessarily imply fulfillment of other nutrient conditions were used in the algebraic solution.
17 As a matter of fact, each of these combinations will have a different cost with each set of linear (nutrient) conditions, and there are many such nutrient conditions because excesses are in general unobjectionable.
18 The nutrient with the highest cost (when secured from its most economical
310
THE COST OF SUBSISTENCE
The derivation of the minimum cost budget for 1944 follows the same procedure.19 The surviving commodities surviving the first test are reproduced in Table B.20 Because of computational limi- tations, fewer trial combinations were investigated but again no large reduction in cost is possible by further search.
It should be added that the content of a diet can be altered sub- stantially without affecting its cost appreciably. In the process of finding the 1939 minimum cost budget several alternative budgets of only slightly higher costs were found among the most preferable commodities.21 It also appears reasonable to suppose that the num- ber of commodities could be increased materially without increas- ing much the cost of the diet, although the laborious calculations necessary to illustrate this were not undertaken.
The Minimum Cost Diets
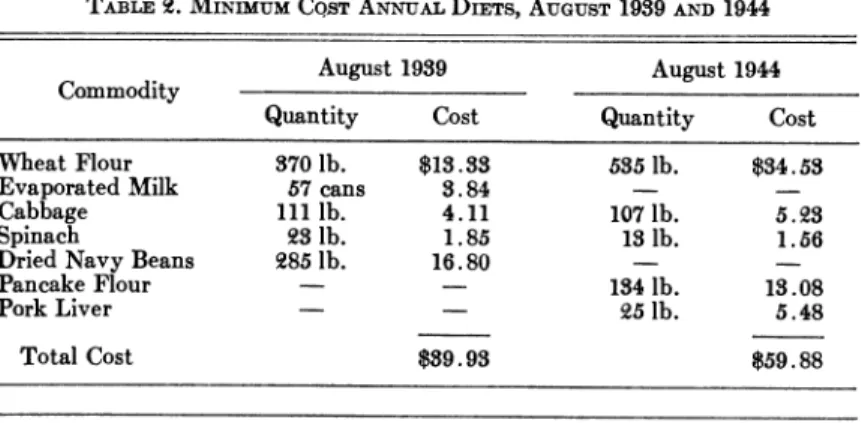
The minimum cost diets for August 1939 and August 1944 are given in Table 2, and their nutritive values are compared with the National Research Council's allowances in Table 3. Consideration
TABLE 2. MINIMUM COST ANNUAL DIETS, AUGUST 1939 AND 1944
August 1939 August 1944
Commodity
Quantity Cost Quantity Cost
Wheat Flour 370 lb. $13.83 585 lb. $34.53
Evaporated Milk 57 cans 3.84 -
Cabbage 111 lb. 4.11 107 lb. 5.28
Spinach 23 lb. 1.85 13 lb. 1.56
Dried Navy Beans 285 lb. 16.80
Pancake Flour - 134 lb. 13.08
Pork Liver - -5 lb. 5.48
Total Cost $39.93 $59.88
source) is calories; it would require $24.50 to supply for a year the calories from flour (commodity no. 1). But then only 61 days' calcium would be provided, and the most efficient source (cheese, no. 19) could meet the deficiency only at a cost of
$14.90, and the contribution to calories would be relatively small. The requirements for vitamin A and ascorbic acid would still be unfilled. Use of other commodities for calories yields a similar conclusion.
19 The corresponding table of nutritive values can of course be secured simply by multiplying the entries in Table A by the ratio of 1989 to 1944 prices.
20 It will be observed that three new commodities are added to the list. The BLS abandoned price quotations on 19 commodities in Table A (including one starred commodity, dried lima beans), and 12 new commodities were examined in making Table B.
21 The minimum cost diet for 1989, which differs greatly from that for 1944, would have cost only 13 percent more than the latter in 1944.
311
GEORGE J. STIGLER
of the lists in Table 2 will suggest reasons in addition to those given in the preceding sections for not recommending the diets.
The cost of the minimum cost diet rose exactly 50 percent from 1939 to 1944; the cost of food in the BLS index of retail prices of food rose 47 percent in the same period. The fact that the minimum cost diet, with its variable composition, increased slightly more than the (relatively) fixed-composition index of the BLS, is indica- tive of the fact (which the detailed data confirm) that the more efficient food sources rose relatively more in price.
TABLES . ADEQUACY OF MINIMUM COST DIETS, AUGUST 1939 AND 1944 Percent of Year's Allowance*
Nutrient
August 1939 August 1944
Calories 100 100
Protein 194 141
Calcium 100 100
Iron 425 245
Vitamin A 100 100
Thiamine 220 185
Riboflavin 100 100
Niacin 148 179
Ascorbic Acid 100 100
* The allowances are given in Table 1.
In this connection it is interesting to notice that the quantity of wheat flour is increased substantially between the two dates, al- though its price rose more than other eligible cereals. This is an artificial example of the Giffen paradox, that
a rise in the price of bread makes so large a drain on the resources of the poorer labouring families and raises so much the marginal utility of money to them, that they are forced to curtail their consumption of meat and the more expensive farinaceous foods; .. .22
The purpose of the determination of the minimum cost diet will be explained in the next section, but in the light of comments of friends a few remarks (which are really a digression) may be added here. It is usually objected that relative prices would change if the commodities in Table 2 became the sole objects of demand. No one recommends these diets for anyone, let alone everyone; it would be the height of absurdity to practice extreme economy at the dinner table in order to have an excess of housing or recreation or
22 Marshall, A., Principles of Economics (8th ed.), p. 132.
312
THE COST OF SUBSISTENCE
leisure. Waiving this point, all dietary studies accept the prices paid by consumers since these are the conditions of purchase which face the individual buyer. Moreover, any sensible system of prices will lead to similar results. If a society were so misguided as to adopt a minimum diet, it cannot be doubted that the prices of the commodities would fall once agriculture, transportation, food proc- essing, and distributive industries were readjusted to this reduced task.
Comparison with Other Diets
It would no doubt be possible to cull from the literature a very large number of absurd estimates of the minimum cost of subsist- ence. Instead, I shall list a few restrained estimates by competent dieticians:
1. In 1936 Carpenter and Stiebeling described a minimum cost diet which "gives the cheapest combination of foods that it is desirable to use for an indefinite period," which cost (in 1935) about $125 a person.23 (It would have cost about $100 in 1939.) A restricted diet for emergency use was also given; it cost $83 in 1935.
2. In 1939 Stiebeling and Clark estimated the cost of an "eco- nomical fair diet," as they unenthusiastically described it, at
$78 to $104 per person in villages and cities. If the recom- mended classes of commodities are chosen from the BLS list, the 1939 cost would be about $94 and the 1944 cost about
$138. This was explicitly stated not to be a minimum diet, but it was implied that much less was not tolerable.24
3. M. S. Rose presented an unqualifiedly minimum diet which would have cost about $115 in 1939.25
These low-cost diets of the professional dieticians thus cost about two or three times as much as a minimum cost diet.
Why do these conventional diets cost so much? The answer is evident from their composition. The dieticians take account of the palatability of foods, variety of diet, prestige of various foods, and other cultural facets of consumption. Primarily on such grounds
23 Diets to Fit the Family Income, Department of Agriculture, Farmer's Bulletin No. 1757 (1936), p. 10.
24 Yearbook of Agriculture, 1939, p. 833: The diet is for families "in straightened circumstances"; it covers "average minimum requirements but does not afford as wide a margin of safety as desirable.... "
2 Foundations of Nutrition (1935), p. 472.
313
GEORGE J. STIGLER
can one explain their emphasis on meats and the inclusion of sugar.2 There are two fundamental objections to so merging the physio- logical and the cultural components of diet. The first is that the particular judgments of the dieticians as to minimum palatability, variety, and prestige are at present highly personal and non-scien- tific, and should not be presented in the guise of being parts of a scientifically-determined budget. The second reason is that these cultural judgments, while they appear modest enough to govern- ment employees and even to college professors, can never be valid in such a general form. No one can now say with any certainty what the cultural requirements of a particular person may be, and on its face it will always be impossible to determine a unique cul- tural minimum diet for 140 million Americans of transcendental variety of background, social position, and cultural values. If the dieticians persist in presenting minimum diets, they should at least report separately the physical and cultural components of these diets.
26 Tax-supported bureaucrats and professors may also have another reason for certain of their practices.
314