in Stephan’s Quintet
Optical spectroscopy & radio observations with the LBT & IRAM 30m
Inaugural Dissertation
Erlangung des Doktorgrades zur
der Mathematisch-Naturwissenschaftlichen Fakultät der Universität zu Köln
vorgelegt von
Lenita Mari Madeleine Yttergren aus Krylbo, Schweden
Köln, 2020
Tag der mündlichen Prüfung:
11. September 2020
One of the most fundamental questions in astronomy is that of the evolution of galaxies. Ever since the quantum fluctuations present at the era of recombination, structures have evolved in the Universe. Dark matter halos facilitate congregation of baryonic matter and the gravitational attraction creates groups and clusters of galaxies.
Galaxies evolve through both external and internal processes. Internal processes are driven by instabilities in the galactic disk, spiral arms, bars and oval distortions, while external processes are driven by outside forces, such as galaxy mergers and harassment. External processes can have an immense impact on the galaxies in- volved, by altering the galaxies’ morphology and content by moving large amounts of gas and inciting starbursts and active galactic nuclei (AGN).
Due to the abundance of gas and the proximity of the galaxies in the early Uni- verse, it is accepted that galaxy mergers/interactions occurred often and were vital in driving galaxy evolution. The environment in which a galaxy resides plays an important role in its formation and evolution, and more than half of the galaxies in the Universe reside in galaxy groups. Compact galaxy groups are perfect laborato- ries for studying galaxy evolution through extreme galaxy interactions due to their galaxy density and activity. These groups can also reveal key information regarding the connections between galaxies and their environment, as well as details regarding galaxy evolution at high redshift. Low-redshift compact galaxy groups allow us to study the impact of galaxy interactions and mergers on galaxy evolution at high- resolution, thereby providing an insight into the conditions of the galaxies in the early Universe when such interactions were more common.
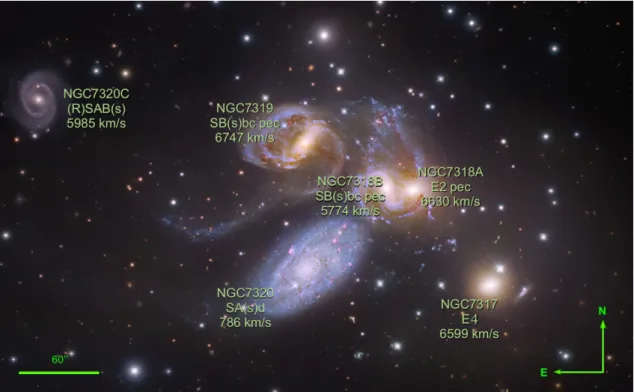
Stephan’s Quintet is a nearby compact galaxy group of 5 galaxies with a rich and intriguing history of interactions. The past interactions can be traced via the tidal tails coursing through the group, while the current interaction is causing a galaxy- wide ridge of shock-driven star formation. This shocked star-forming ridge is enabled by the large amount of intergalactic gas present in the group, deposited in the intergalactic medium (IGM) during the previous galaxy interactions. Stephan’s Quintet is one of the most well-studied groups in our Universe and every time the group has been observed in a new wavelength window or with higher resolution and sensitivity, new fascinating features have been revealed and our understanding of the processes and structures increased.
Multi-wavelength analyses of galaxies are essential, since it is only through compar- ison and combination of the tracers of galaxy dynamics (i.e., stars, atomic gas and molecular gas) that we can truly study the evolution of galaxies. To fill in blanks in the wavelength ranges covering Stephan’s Quintet and contribute to increased understanding of our Universe, I have carried out optical spectroscopy and radio observations.
The optical wavelength regime provides information regarding the stellar population as well as the atomic gas, while spectroscopy enables spatial and spectral informa- tion to be gathered simultaneously. This facilitates studies of the abundances and kinematics as well as the excitation mechanisms across the group.
Covering a part of Stephan’s Quintet in multiple slits with the Multi-Object Double
Spectrograph at the Large Binocular Telescope in Tucson, Arizona, USA, I am able to achieve a pseudo-Integral Field Spectroscopy observation of the main part of, and the most intense, interactions and activity in group. Focusing on the nucleus of the galaxies and the large-scale dynamics, I detail the kinematics of the IGM and the galaxies. I present an extensive analysis of the mapped area, including fluxes, velocity dispersions, line-of-sight velocities and excitation mechanisms in NGC7319, NGC7318A and B, NGC7317, the bridge, the west ridge and the star-forming ridge.
NGC7319 shows a disturbed galaxy, where the gaseous disk is decoupled from the stellar disk. I find a broad line region component in the nucleus, revealing for the first time the Seyfert 1 nature of this galaxy, and I confirm the presence of a blue outflow to the south-west of the nucleus at an average of476±13.8 km/s. The stellar and gaseous disks are approximately perpendicular to each other and the gas is excited by AGN radiation, indicating that the gas is present in a large-scale nuclear wind.
The data further reveal extensive gas emission in the shocked star-forming ridge as well as in the west ridge (south-west of the NGC7318 pair) and the bridge connecting the NGC7318 pair and NGC7319. I confirm dual velocity components (as suggested by Duarte Puertas et al. (2019)) in several parts of the IGM and note that the shock increases the ionisation to LINER-like emission-line ratios in several regions along the star-forming ridge and the west ridge. Furthermore, the multiple velocity components present in many parts of the IGM and galaxies, spanning 5600≠7000 km/s, coincide with that of other galaxies, revealing the potential origin.
Cold molecular gas, best traced by CO emission detected in radio wavelengths, is a key ingredient in star formation and one of the main ingredients in galaxies.
Analysing the behaviour of molecular gas is vital in determining the morphology and understanding the evolution of galaxies. I have, therefore, observed Stephan’s Quintet using the IRAM 30m telescope in Sierra Nevada, Spain. Adopting an on-the- fly mapping technique I observed the 12CO(1æ 0), (2æ 1) and the 13CO(1æ 0) emission in a 5.67 arcmin2 area covering the group. I present maps and spectra of the emission, including abundances and velocities of the respective three CO lines, as well as molecular hydrogen gas masses. I further discuss the line ratios together with the excitation temperatures and the optical depth.
I find that the brunt of the CO emission is in/near NGC7319, extending towards and into the bridge and the star-forming ridge. 52≠56% of the molecular hydrogen gas mass in Stephan’s Quintet is in/near NGC7319, while 38≠40% is in the star- forming ridge, the final 4≠10% is spread out across the NGC7318 pair and their surroundings. The distribution of 12CO(2 æ 1), however, favours NGC7317, the NGC7318 pair, SQ-A and the star-forming ridge, which retain approximately half of the 12CO(2æ1)emission, while NGC7319 contains less than 20%. This highlights the increased temperatures present in the shocked star-forming ridge. The data confirms the presence of multiple velocity components in the group, spanning5600≠ 7200km/s. Up to 4 clearly distinguishable velocity components can be found, with NGC7319 and the star-forming ridge showing the highest number of components.
Again the velocity components often coincide with that of the other galaxies, tracing the complex history of the group. Furthermore, the CO line ratios indicate optically thick gas at low temperature in NGC7319 and the bridge. While in the star-forming ridge and SQ-A, the gas is found to be dense, optically thick and warm, as expected
considering the current interaction of the IGM and NGC7318B. The gas surrounding NGC7318B at a line-of-sight velocity of ≥5800 km/s shows an inclination towards being warm, dense and optically thin.
This work favours a group evolution scenario of Stephan’s Quintet that includes previous interactions of both NGC7319-NGC7317 and NGC7319-NGC7320C, and a scenario in which NGC7318B has passed through and is currently located in front of the group, supported by the multi-component IGM and the tidal streams that connect NGC7318B to the IGM and the galaxies. In addition, NGC7318B increases the group’s energy and adds to the IGM gas content which stalls the gas deple- tion required for aging the group further. The enhancements of the passages of NGC7320C and NGC7318B are expected to be vital in hindering the group’s im- minent merger into a final fossil state. NGC7318B shows us the impact of diffuse IGM, while NGC7319 reveals a fascinating case of AGN feeding and feedback in a decoupled stellar/gas disk. NGC7319 shows lack of ongoing star formation while still appearing to contain molecular gas, although likely off-nuclear, with an out- flow impacting the surrounding gas and structures - raising questions regarding the feeding mechanisms and lifetime of this AGN.
Stephan’s Quintet differs from other groups due to the prominent extended tidal features and the currently occurring collision with NGC7318B. It is possible that these structures are short-lived and that all compact groups exhibit this kind of variety of galaxy interaction indicators, stellar and gaseous tidal features and galaxy- wide shock structures at some point during their evolution. Understanding these processes in Stephan’s Quintet sheds light on the evolution of galaxies at a time in the history of the Universe when gas was abundant and interactions were common.
gemäß der Promotionsordnung vom 12. März 2020
Hiermit versichere ich an Eides statt, dass ich die vorliegende Dissertation selbst- ständig und ohne die Benutzung anderer als der angegebenen Hilfsmittel und Liter- atur angefertigt habe. Alle Stellen, die wörtlich oder sinngemäß aus veröffentlichten und nicht veröffentlichten Werken dem Wortlaut oder dem Sinn nach entnommen wurden, sind als solche kenntlich gemacht. Ich versichere an Eides statt, dass diese Dissertation noch keiner anderen Fakultät oder Universität zur Prüfung vorgelegen hat; dass sie - abgesehen von unten angegebenen Teilpublikationen und eingebun- denen Artikeln und Manuskripten - noch nicht veröffentlicht worden ist sowie, dass ich eine Veröffentlichung der Dissertation vor Abschluss der Promotion nicht ohne Genehmigung des Promotionsausschusses vornehmen werde. Die Bestimmungen dieser Ordnung sind mir bekannt. Darüber hinaus erkläre ich hiermit, dass ich die Ordnung zur Sicherung guter wissenschaftlicher Praxis und zum Umgang mit wissenschaftlichem Fehlverhalten der Universität zu Köln gelesen und sie bei der Durchführung der Dissertation zugrundeliegenden Arbeiten und der schriftlich ver- fassten Dissertation beachtet habe und verpflichte mich hiermit, die dort genannten Vorgaben bei allen wissenschaftlichen Tätigkeiten zu beachten und umzusetzen. Ich versichere, dass die eingereichte elektronische Fassung der eingereichten Druckfas- sung vollständig entspricht.
Köln, 08.07.2020
(Lenita Mari Madeleine Yttergren)
’Interactions among intermediate redshift galaxies. The case of SDSSJ134420.86+663717.8’
P. Misquitta, M. Bowles, A. Eckart, M. Yttergren, G. Busch, M. Valencia-S., N.
Fazeli. Published in Astronomy & Astrophysics, Volume 639, id.A30, 14 pp., July 2020.
’Near-infrared observations of the gas structure and kinematics in the circumnu- clear region of NGC 1672’
N. Fazeli, A. Eckart, G. Busch,M. Yttergren, F. Combes, P. Misquitta, C. Straub- meier. Published in Astronomy & Astrophysics, Volume 638, id.A36, 13 pp, June 2020.
’GLINT. Gravitational-wave Laser INterferometry Triangle’
S. Aria, R. Azevedo, R. Burow, F. Cahill, L. Ducheckova, A. Holroyd, V. Huarcaya, E. Järvelä, M. Koßagk, C. Moeckel, A. Rodriguez, F. Royer, R. Sypniewski, E. Vit- tori, M. Yttergren. Published in Experimental Astronomy, Volume 44, Issue 2, pp.181-208, November 2017.
’A blueprint for a simultaneous test of quantum mechanics and general relativity in a space-based quantum optics experiment’
S. Pallister, S. Coop, V. Formichella, N. Gampierakis, V. Notaro, P. Knott, R.
Azevedo, N. Buchheim, S. de Carvalho, E. Järvelä, M. Laporte, J. Kaikkonen, N.
Meshksar, T. Nikkanen and M. Yttergren. Published in EPJ Quantum Technol- ogy 2017 4:2, 7 February 2017.
’Glass transition and relaxation dynamics of propylene glycol - water solutions con- fined in clay’
K. Elamin, J. Björklund, F. Nyhlén, M. Yttergren, L. Maartensson, J. Swenson.
Published in The Journal of Chemical Physics, 17 July 2014.
Erklärung vii
Weitere Publikationen ix
List of Figures xv
List of Tables xix
Abbreviations & Acronyms xxi
1 Introduction 1
2 Astronomical Background 5
2.1 Matter Distribution & Structure Formation . . . 6
2.2 Galaxy Evolution . . . 8
2.2.1 Secular Evolution in Spiral Galaxies . . . 9
2.2.2 Kinematics of Elliptical Galaxies . . . 11
2.2.3 Galaxy Mergers & Interactions . . . 13
2.2.4 Shocks . . . 16
2.3 Star Formation . . . 17
2.4 Black Holes . . . 21
2.4.1 AGN Classification & Unification . . . 21
2.4.2 Feeding & Feedback . . . 24
2.5 Galaxy Groups . . . 26
2.5.1 Types of Groups . . . 26
2.5.2 Properties & Peculiarities of Compact Groups . . . 28
2.6 Observations to Trace Physical Properties . . . 30
2.6.1 Radio . . . 31
2.6.2 Infrared . . . 32
2.6.3 Optical . . . 33
2.6.4 Ultraviolet . . . 35
2.6.5 X-ray . . . 35
3 The Story of Stephan’s Quintet & this Thesis 37 3.1 Simulations . . . 40
3.2 Radio . . . 41
3.3 Infrared . . . 43
3.4 Optical . . . 45
3.5 Ultraviolet . . . 47
3.6 X-ray . . . 48
3.7 The Aims of this Thesis . . . 49
I Atomic Gas & Stellar Kinematics in Stephan’s Quintet 51
4 Optical Astronomy 53 4.1 Optical Telescopes . . . 534.2 The Large Binocular Telescope . . . 55
4.2.1 The Multi-Object Double Spectrograph . . . 58
5 Observational Setup & Data Treatment 61 5.1 Observational Setup & Exposure Times . . . 61
5.2 Data Reduction . . . 63
5.2.1 Challenges . . . 65
5.3 Initial Scientific Analysis . . . 66
5.3.1 The Stellar Continuum . . . 66
5.3.2 The Gas Emission Lines . . . 67
5.3.3 Particularly Challenging Aspects . . . 68
6 Results & Discussion 71 6.1 The Active Galaxy NGC7319 . . . 73
6.1.1 Maps & Spectra . . . 73
6.1.2 Kinematics & Rotation . . . 82
6.1.3 The Outflow . . . 84
6.1.4 Excitation Mechanisms using the BPT Diagnostic Diagrams . 86 6.1.5 The Bridge . . . 89
6.1.5.1 Gas Kinematics & Excitation Mechanisms . . . 92
6.2 The Star-Forming Ridge . . . 93
6.2.1 Spectra . . . 93
6.2.2 Gas Kinematics . . . 103
6.2.3 Excitation Mechanisms . . . 105
6.3 The NGC7318 Pair . . . 107
6.3.1 Maps & Spectra . . . 107
6.3.2 NGC7318A: Kinematics & Rotation . . . 110
6.3.3 NGC7318B: Kinematics & Rotation . . . 110
6.4 NGC7317 . . . 112
6.4.1 Spectrum . . . 112
6.4.2 Kinematics & Rotation . . . 113
7 Summary & Conclusions 115 7.1 The Galaxies & the IGM . . . 115
7.2 The Velocities & their Relation to the Galaxies . . . 117
II Molecular Gas Kinematics in Stephan’s Quintet 121
8 Radio Astronomy 123
8.1 Radio Telescopes . . . 123
8.2 IRAM 30m . . . 126
8.2.1 EMIR . . . 128
9 Observational Setup & Data Treatment 131 9.1 Observational Setup & Exposure Times . . . 131
9.2 Data Reduction . . . 134
9.2.1 Challenges . . . 136
9.3 Initial Scientific Analysis . . . 137
9.3.1 CO Lines . . . 137
9.3.2 Molecular Hydrogen Gas Mass . . . 138
9.3.3 Excitation Temperature & Optical Depth . . . 138
9.3.4 Particularly Challenging Aspects . . . 139
10 Results & Discussion 141 10.1 Maps of Overall CO Emission . . . 142
10.2 The Active Galaxy NGC7319 . . . 144
10.2.1 Spectra . . . 144
10.2.2 Molecular Hydrogen Gas Mass & Kinematics . . . 150
10.2.3 Line Ratios; Excitation Temperature & Optical Depth . . . . 150
10.3 The Star-Forming Ridge & the Bridge . . . 152
10.3.1 Spectra . . . 152
10.3.2 Molecular Hydrogen Gas Mass & Kinematics . . . 157
10.3.3 Line Ratios; Excitation Temperature & Optical Depth . . . . 157
10.4 The NGC7318 Pair & NGC7317 . . . 159
10.4.1 Spectra . . . 159
10.4.2 Molecular Hydrogen Gas Mass & Kinematics . . . 164
10.4.3 Line Ratios; Excitation Temperature & Optical Depth . . . . 164
11 Summary & Conclusions 167 11.1 The Flux Distribution . . . 167
11.2 The Velocity Distribution . . . 168
11.3 The Line Ratios; Excitation Temperature & Optical Depth . . . 168
III Concluding Discussion & Remarks 171
12 The History, Future & Implications of Understanding Stephan’s Quintet 173 12.1 The Interaction History of Stephan’s Quintet . . . 17412.1.1 First: Creating an IGM Deposit . . . 175
12.1.2 Second: Creating the SW tail & NW tails . . . 177
12.1.3 Third: The Galaxy-Wide Shocked Star-Forming Ridge . . . . 178
12.2 Stephan’s Quintet Particulars . . . 180
12.2.1 The Effects of the Outflow in NGC7319 . . . 180
12.2.2 The Importance of the Bridge . . . 180
12.2.3 About the West Ridge . . . 181
12.3 Impact on Galaxy Groups, Black Hole Activity & Mergers . . . 183
12.3.1 Compact Galaxy Groups & the Galaxies Therein . . . 183
12.3.2 Stephan’s Quintet & Active Galaxies . . . 185
12.3.3 The NGC7318 Pair & Merging Galaxies . . . 187
12.4 Implications on Galaxy Evolution & the History of the Universe . . . 189
12.5 A Short Note on Further Research Required . . . 190
Acknowledgements I
References III
Lebenslauf XI
2.1 The cosmic microwave background . . . 6
2.2 Simulation of the distribution of matter . . . 7
2.3 The large scale structure as seen by the SDSS . . . 8
2.4 The Hubble classification scheme . . . 9
2.5 The process of galaxy evolution . . . 10
2.6 A sample of merging galaxies . . . 14
2.7 A simulation of a merger between two galaxies of similar size . . . 15
2.8 The Hertzsprung-Russell diagram as observed by Gaia . . . 18
2.9 Hertzsprung-Russell diagram incl. evolutionary track of the sun . . . 20
2.10 The first direct evidence of a black hole . . . 21
2.11 The geometric unification model of AGN . . . 23
2.12 Examples of the shape of jets in active galaxies . . . 25
2.13 Two Hickson Compact Groups . . . 27
2.14 Atmospheric opacity as a function of wavelength . . . 30
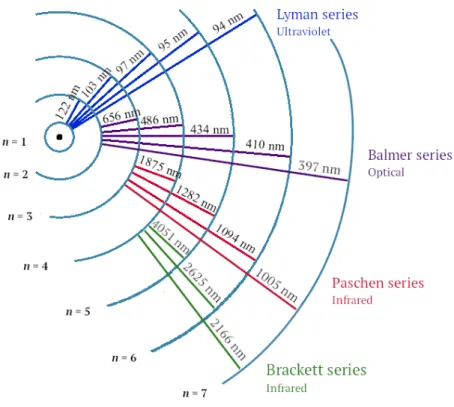
2.15 Hydrogen recombination lines . . . 33
3.1 Stephan’s Quintet . . . 37
3.2 Tidal and interaction structures in Stephan’s Quintet . . . 39
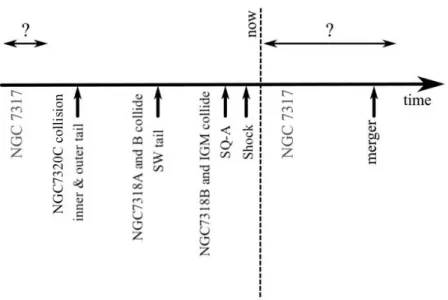
3.3 Timeline of the interactions and creation of tails and shocks . . . 41
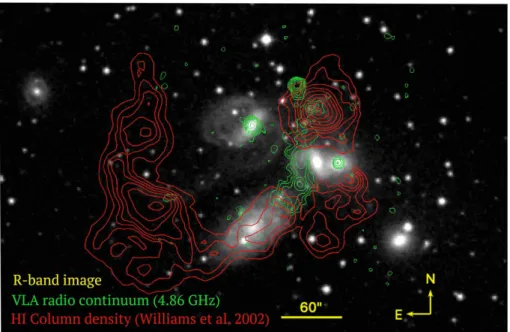
3.4 Radio continuum and HI column density in Stephan’s Quintet . . . . 42
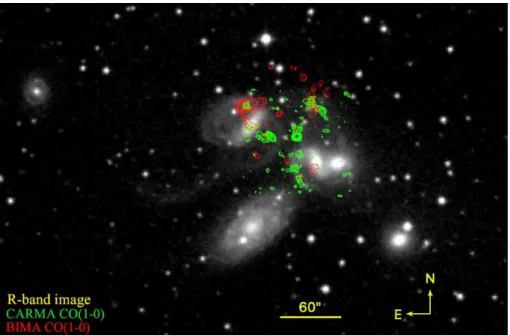
3.5 CARMA and BIMA CO in Stephan’s Quintet . . . 43
3.6 IRAS 60 µm continuum map . . . 44
3.7 Spitzer H2 and Herschel integrated [CII] . . . 45
3.8 Optical continuum and H– emission . . . 46
3.9 GALEX FUV emission . . . 48
3.10 Chandra X-ray and XMM-Newton emission in Stephan’s Quintet . . 49
4.1 The Large Binocular Telescope . . . 55
4.2 The Large Binocular Telescope schematic. . . 56
4.3 LBT AllSky camera image . . . 57
4.4 MODS transmission and reflection . . . 58
4.5 MODS schematic . . . 59
5.1 Slit positions used for LBT observations . . . 62
5.2 Examples of MODS1 Red raw image . . . 63
5.3 MODS1 Red image after MODS CCD Reduction Package application 64 5.4 Example of fully reduced MODS1 Red image . . . 65
5.5 Examples of the continuum fit with pPXF . . . 67
5.6 Examples of the gas emission line fits . . . 68
5.7 Example of the dual velocity components in the gas emission lines . . 69
6.1 The regions picked for closer analysis . . . 72
6.2 Stellar continuum in NGC7319 . . . 73
6.3 [OII]⁄3727 emission in NGC7319 . . . 74
6.4 H— NLR emisison in NGC7319 . . . 74
6.5 [OIII]⁄5008 emission in NGC7319 . . . 74
6.6 [OI]⁄6302 emission in NGC7319 . . . 75
6.7 H– NLR emission in NGC7319 . . . 75
6.8 [NII]⁄6585 emission in NGC7319 . . . 75
6.9 [SII]⁄6718,6732 emission in NGC7319 . . . 76
6.10 Spectrum of region 19_0 . . . 76
6.11 Spectrum of region 19_1 . . . 76
6.12 Spectrum of region 19_2 . . . 77
6.13 Spectrum of region 19_3 . . . 77
6.14 Spectrum of region 19_4 . . . 77
6.15 Spectrum of region 19_5 . . . 78
6.16 Spectrum of region 19_6 . . . 78
6.17 Spectrum of region 19_7 . . . 79
6.18 Fit of the H–≠[NII] in region 19_0 . . . 79
6.19 Table of fluxes and velocities in region 19_0-3 . . . 80
6.20 Table of fluxes and velocities in region 19_4-7 . . . 81
6.21 Stellar continuum vs [OIII]⁄5008 in NGC7319 . . . 83
6.22 [OIII]⁄5008 velocity field vs H– and stellar in NGC7319 . . . 84
6.23 Multiple velocity components in the [OIII]⁄5008 line in NGC7319 . . 85
6.24 log([NII]/H–) and log([OI]/H–) line ratios in NGC7319 . . . 86
6.25 log([SII]/H–)and log([OIII]/H—) line ratios in NGC7319 . . . 87
6.26 log([NII]/H–) BPT diagnostic diagram for region 19_0-6 and b_4 . . 87
6.27 log([SII]/H–)BPT diagnostic diagram for region 19_0-6 and b_4 . . 88
6.28 log([OII]/H–)BPT diagnostic diagram for region 19_0-6 and b_4 . . 88
6.29 Spectrum of region b_1 . . . 89
6.30 Spectrum of region b_2 . . . 89
6.31 Spectrum of region b_3 . . . 90
6.32 Spectrum of region b_4 . . . 90
6.33 Table of fluxes and velocities in the bridge . . . 91
6.34 Fit of the H–≠[NII] emission in the bridge. . . 92
6.35 Spectrum of region SF_1 . . . 93
6.36 Spectrum of region SF_2 . . . 94
6.37 Spectrum of region SF_3 . . . 94
6.38 Spectrum of region SF_4 . . . 94
6.39 Spectrum of region SF_5 . . . 95
6.40 Spectrum of region SF_6 . . . 95
6.41 Spectrum of region SF_7 . . . 95
6.42 Spectrum of region SF_8 . . . 96
6.43 Spectrum of region SF_9 . . . 96
6.44 Spectrum of region SF_10 . . . 96
6.45 Spectrum of region SF_11 . . . 97
6.46 Spectrum of region SF_12 . . . 97
6.47 Spectrum of region SF_13 . . . 97
6.48 Spectrum of region SF_14 . . . 98
6.49 Spectrum of region SF_15 . . . 98
6.50 Table of fluxes and velocities in region SF_1-4 . . . 99
6.51 Table of fluxes and velocities in region SF_5- . . . 100
6.52 Table of fluxes and velocities in region SF_9-12 . . . 101
6.53 Table of fluxes and velocities in region SF_13-15 . . . 102
6.54 The fit of dual velocity components in SF_1 . . . 103
6.55 The fit of dual velocity components in SF_2 . . . 103
6.56 The fit of dual velocity components in SF_5 . . . 104
6.57 The fit of dual velocity components in SF_7 . . . 104
6.58 The fit of dual velocity components in SF_8 . . . 104
6.59 log([NII]/H–) BPT diagnostic diagram for region SF_1-15 . . . 105
6.60 log([SII]/H–)BPT diagnostic diagram for region SF_1-15 . . . 106
6.61 log([OII]/H–)BPT diagnostic diagram for region SF_1-15 . . . 106
6.62 NGC7318A spectrum . . . 107
6.63 NGC7318B spectrum . . . 108
6.64 Table of fluxes and velocities in NGC7318A and B . . . 108
6.65 Maps of velocities in NGC7318A and B . . . 109
6.66 The velocity dispersion in NGC7318A as a function of radius. . . 110
6.67 NGC7318B rotation field fit and residual . . . 111
6.68 NGC7317 spectrum . . . 112
6.69 Table of velocities in NGC7317 . . . 112
6.70 NGC7317 line-of-sight velocity as a function of position . . . 113
6.71 NGC7317 velocity dispersion as a function of position . . . 113
7.1 Table of velocity components in the regions . . . 119
8.1 Single dish antenna reception pattern . . . 124
8.2 Effelsberg 100m telescope . . . 125
8.3 IRAM 30m telescope . . . 126
8.4 Atmospheric transmission in the IRAM 30m and EMIR range . . . . 127
8.5 Overview of the EMIR band combinations and frequencies . . . 129
8.6 Frequency ranges of a selection of EMIR backends . . . 129
9.1 Illustration of the positions of the boxes used for on-the-fly mapping . 132 9.2 EMIR technical setup . . . 133
9.3 Effect of platform correction . . . 134
9.4 Effect of baseline subtraction . . . 135
9.5 Example of 12CO(1æ0) emission line fit . . . 137
10.1 The regions chosen for closer analysis in the IRAM 30m data . . . 141
10.2 12CO(1æ0)summed flux map . . . 142
10.3 12CO(2æ1)summed flux map . . . 143
10.4 13CO(1æ0)summed flux map . . . 143
10.5 CO emission in NGC7319, region 19 . . . 144
10.6 CO emission in region 19_o . . . 145
10.7 CO emission in region 19_i . . . 145
10.8 CO emission in region 19_ii . . . 145
10.9 CO emission in region 19_iii . . . 146
10.10CO emission in region 19_iv . . . 146
10.11CO emission in region 19_v . . . 146
10.12CO emission in region 19_vi . . . 147
10.13Table of CO velocities, fluxes & M(H2) in/near NGC7319 . . . 148
10.14Table of I(CO) & M(H2) in/near NGC7319 in 200 km/s vel ranges . . 149
10.15CO emission in region b_i . . . 152
10.16CO emission in region b_ii . . . 153
10.17CO emission in region SQ-A . . . 153
10.18CO emission in region SF_i . . . 153
10.19CO emission in region SF_ii . . . 154
10.20CO emission in region SF_iii . . . 154
10.21CO emission in region SF_iv . . . 154
10.22Table of CO velocities, fluxes and M(H2) in the SF ridge & bridge . . 155
10.23Table of I(CO) & M(H2) in SF ridge & bridge in 200km/s vel ranges 156 10.24Table of Tmb12CO(2æ1)/Tmb12CO(1æ0) ratio in the SF ridge & bridge . . . . 158
10.25CO emission in NGC7318A . . . 160
10.26CO emission in NGC7318B . . . 160
10.27CO emission in region 18_i . . . 160
10.28CO emission in region 18_ii . . . 161
10.29CO emission in region 18_iii . . . 161
10.30CO emission in region 18_iv . . . 161
10.31CO emission in NGC7317 . . . 162
10.32Table of CO velocities, fluxes & M(H2) in/near NGC7318A,B & NGC7317 . . . 162
10.33Table of I(CO) & M(H2) in/near NGC7318A,B & NGC7317 in 200 km/s vel ranges . . . 163
11.1 Table of total CO fluxes, H2 masses and CO line ratios . . . 169
11.2 Table of CO line ratios from the fits in the regions . . . 170
12.1 Stephan’s Quintet and the regions in Chapter 12 . . . 173
12.2 Reminder of the structures in Stephan’s Quintet . . . 174
12.3 CO in Stephan’s Quintet . . . 175
12.4 Radio and X-ray emission showing shock induced SF . . . 179
12.5 H–[NII]⁄6585 peak amplitudes in NGC7319 . . . 181
12.6 HI, X-ray and H–≠[NII] . . . 182
12.8 The Antennae galaxies, Cartwheel galaxy and Stephan’s Quintet . . . 188
5.1 LBT exposure times . . . 62
9.1 CO molecular emission line frequencies . . . 131
9.2 The boxes scanned in the on-the-fly mapping . . . 132
9.3 CO line maps filtering levels . . . 135
Abbreviations & Acronyms
AGN Active Galactic Nucleus
ALMA Atacama Large Millimeter/submillimeter Array AO Adaptive Optics
BLR Broad-Line Region CCD Charge-Coupled Device
CFHT Canada-France-Hawaii Telescope
CLASS The GILDAS based Continuum and Line Analysis Single-dish Software CMB Cosmic Microwave Background
CO carbon monoxide DMH Dark Matter Halo dx Horizontal shifts
EHT Event Horizon Telescope ELT Extremely Large Telescope EMIR Eight MIxer Receiver FoV Field of View
FWHM Full Width at Half Maximum GALEX Galaxy Evolution Explorer GreG Grenoble Graphic software HCG Hickson Compact Group HRD Hertzsrpung-Russel Diagram HST Hubble Space Telescope IFS Integral Field Spectroscopy IGM Intergalactic Medium IMF Initial Mass Function IR Infrared
IRAF Image Reduction and Analysis Facility IRAM Institut de Radioastronomie Millimétrique ISM Interstellar Medium
LBT Large Binocular Telescope CDM Lambda Cold Dark Matter
LIGO Laser Interferometer Gravitational-Wave Observatory LINER Low-Ionization Nuclear Emission-line Region
LIRG Luminous Infrared Galaxy
LUCI LBT Utility Camera in the Infrared MIR Mid-Infrared
MODS Multi-Object Double Spectrograph NED NASA/IPAC Extragalactic Database NIR Near-Infrared
NLR Narrow-Line Region
OTF On-the-fly (an observation technique) PA Position Angle
PAH Polycyclic Aromatic Hydrocarbon pPXF Penalized Pixel-Fitting
QSO Quasi-Stellar Object
rms Root Mean Square
SDSS Sloan Digital Sky Survey SF Star-Forming
SFR Star-Formation Rate
SMBH Super-Massive Black Hole SNR Signal-to-noise ratio
SQ Stephan’s Quintet TDG Tidal Dwarf Galaxy
ULIRG Ultra-Luminous Infrared Galaxy UV Ultraviolet
VLTI Very Large Telescope Interferometer WISE Wide-field Infrared Survey Explorer
1
Introduction
To be the Universe observing itself is the purpose of human existence. And we have fulfilled this purpose for as long as we can remember. Observing the night sky, searching for a description of our place within the cosmos, and understanding the continued evolution of the infinite Universe in which we reside, entices some of the most profound human thoughts and questions. How did the Universe come to exist?
How will it end? Will it end? What are the building blocks of our Universe? What was and is the importance of dark matter and dark energy? How were structures such as stars, galaxies, galaxy groups and clusters formed? How do they evolve?
These and many more are the questions, the mysteries, that astronomy aims to solve.
With the 17th century came the invention of the telescope, a truly revolution- ary construction for the research field with unprecedented resolution and sensitivity.
Telescopes have thenceforth allowed many astronomical objects to be classified and analysed, and have enabled the development of models to describe many astronomi- cal phenomena. Today improving and developing new telescopes and methods to ob- serve astronomical objects in all wavelength regimes, is an important and very active field, creating such fascinating structures as the Laser Interferometer Gravitational- Wave Observatory (LIGO), and the Event Horizon Telescope (EHT). And although, observations and simulations have enabled immense progress and many questions to be answered, many more questions remain and new questions arise continuously.
As the cosmic microwave background (CMB) reveals the state of the Universe prior to the formation of structures such as stars and galaxies, it shows us a Universe that at first glance appears isotropic (Planck Collaboration et al., 2018). Fortunately, the CMB contains quantum fluctuations, anisotropies, that allowed the gathering of matter and the formation of structure. We still do not know how these small anisotropies grew into the structures we see today, but it is generally agreed upon that dark matter halos and their galaxies gathered, forming larger structures, galaxy groups and clusters (Springel et al., 2005). The significance of the environment on the evolution of a galaxy is being debated within the construct of the “nature vs nurture” scenario, where the importance of the formation environment is placed against past experiences as the main influence on a galaxy’s evolutionary path.
As of today, the environment appears to have an important impact on a galaxy’s evolution, as elliptical galaxies are more common in dense regions than star-forming spiral galaxies for example (Dressler, 1980).
It is believed that in the young Universe extreme galaxy interactions, such as galaxy mergers, were common and vital in driving galaxy evolution (Rodríguez- Baras et al., 2014). As many interacting/merging galaxies have been observed,
the process can be deemed common, and simulations show that the impact on the morphologies of the interacting galaxies often is substantial (Renaud et al., 2010;
Hwang et al., 2012; Misquitta et al., 2020). Furthermore, it has been suggested that these kinds of interactions can trigger black hole activity and starbursts (Ellison, 2019). And stars are a particularly important player in the evolution of the Universe, as they are the origin of heavier chemical elements, such as iron and oxygen. A key aspect to our understanding of the formation and evolution of galaxies therefore lies in the kinematics of the stars and the gas (Cappellari, 2017).
More than half of the galaxies in the Universe are found in groups (Hickson, 1997). Galaxy groups are beautiful structures in the night sky, and due to the close proximity of the galaxies the rate of interactions and the amount of gas present in the intergalactic medium is high. This enables the creation of stunning structures and facilitates discovery of new and fascinating details of the processes affecting the medium and the group’s galaxies. Galaxy groups are truly useful for studying galaxy properties and evolution as a function of the environment, and can reveal important details regarding the interconnected nature of galaxy evolution and group environment (Nishiura et al., 2000; Mihos, 2004; Kauffmann et al., 2004). Whether galaxy groups are gravitationally bound systems or not is currently a hot topic, and the observational definition of groups is still not well defined. Furthermore, nearby galaxy groups can provide us with a high resolution view on the extreme galaxy interactions that are believed to be particularly common in the early Universe (Rodríguez-Baras et al., 2014; Natale et al., 2010), revealing vital insights into galaxy evolution at higher redshifts and throughout cosmic time.
The bright nearby compact galaxy group Stephan’s Quintet is an optimal can- didate for studying a history of multiple galaxy interactions, shock induced star formation and galaxy evolution through extreme galaxy interactions. As this com- pact group has been extensively studied in multiple wavelength regimes, filling in the gaps proves enlightening and goes along the path of shedding light on the pro- cess of galaxy evolution. Exactly how this thesis is placed within the framework of the previous work on Stephan’s Quintet and compact galaxy groups, is detailed in Chapter 3, after the proper background knowledge has been provided.
This thesis begins with a scientific background, in Chapter 2, regarding the known picture of structure formation and evolution, the necessary definitions and the im- portance of observations in different wavelength regimes. In Chapter 3, a background of the compact galaxy group Stephan’s Quintet is presented, including a summary of the previous data published on this source. Thereafter, this work is split into two main parts, according to the observations and analysis carried out: optical spec- troscopy with the Large Binocular Telescope (LBT) and radio observations with the IRAM 30m telescope. Part I. Atomic Gas & Stellar Kinematics in Stephan’s Quin- tet, Chapter 4-7, contains a background to optical astronomy and the LBT, details on the data acquisition, reduction and analysis of the LBT optical spectroscopy data of the galaxy group, the results thereof and the summary and conclusions of these results. Part II. Molecular Gas Kinematics in Stephan’s Quintet, Chapter 8-11, has a similar layout as Part I. Beginning with an introduction to radio astronomy and the IRAM 30m telescope, then detailing the acquisition, reduction procedure and analysis of the IRAM 30m radio data, as well as the results and the summary
and conclusions thereof. TheSummary & Conclusions after each ‘Part’ refers only to the details obtained in Part I and II respectively. A further discussion, plac- ing the work carried out here in relation to other works, including its impact on the history of Stephan’s Quintet, compact groups, extreme galaxy interactions and galaxy evolution throughout cosmic time, is presented in the final chapter, Chapter 12. Concluding Discussion & Remarks.
2
Astronomical Background
The connections between the different processes and events in our Universe are many, complex and thoroughly entwined. This chapter provides a summary of the background knowledge necessary for understanding the results of this thesis, in as few words as possible.
The chapter begins with the distribution of matter in the Universe and the forma- tion of structures, such as the congregation of matter into galaxies, and continues with the concept of galaxy evolution, via internal and external processes. Thereafter, star formation and active galaxies, including the classification and unification of ac- tive galactic nuclei as well as the feeding and feedback processes of super-massive black holes, are discussed. The next section includes galaxy groups, particularly compact galaxy groups and their specific aspects and importance in galaxy evolu- tion. The chapter concludes with a summary of the advantages of observations in different wavelength regimes focused on tracers of galaxy evolution.
There is truly a magnificent amount of books and review articles on the topics discussed in this chapter, which forces a selection to be made. Unless stated oth- erwise the information detailed here relies on Sparke & Gallagher (2007); Netzer (2013); Schneider (2015).
2.1 Matter Distribution & Structure Formation
Let us begin by assuming a Lambda cold dark matter ( CDM) Universe, where the baryonic matter in the Universe makes up 4.89%, the dark matter 26.22% and the dark energy 68.89% (Planck Collaboration et al., 2018). The cosmic microwave background (CMB) shows the electromagnetic radiation from the recombination epoch, when the photons decoupled from matter, at a redshift ofz ≥1100, approxi- mately 380000 years after the Big Bang. The CMB shows the state of the Universe before the formation of structures such as galaxies and stars. The CMB exhibits anisotropies, as can be seen in Fig.2.1, which shows an image of the CMB obtained with the Planck satellite. The anisotropies begun as quantum fluctuations in the pri- mordial Universe, and grew under the inflation epoch and later under the influence of gravitational instabilities as the Universe expanded.
Figure 2.1: The cosmic microwave background as obtained with Planck. The temper- ature fluctuations are shown as colour differences. Credit: ESA and the Planck Collabo- ration.
The anisotropies are mirrored in primordial density fluctuations. As the dark mat- ter density fluctuations reach critical mass they collapse forming pressure-supported virialised objects called dark matter halos (DMHs). Baryonic matter falls into the DMHs, cooling and forming structures such as galaxies, galaxy groups (<50galax- ies, typically ≥ 1≠2 Mpc across), galaxy clusters (50≠1000 galaxies, ≥10 Mpc across) and superclusters (≥100 Mpc across). Approximately half of the galaxies in the Universe are contained in groups and clusters. The clusters no longer expand with the accelerated expansion of the Universe, due to their mutual gravitation attraction.
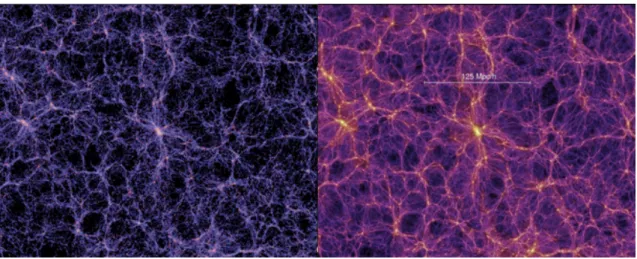
The filamentary structure of the Universe and the correlation of dark to baryonic matter can be seen in Fig.2.2, which displays the distribution of matter as obtained by the Millennium Simulation. The Millennium Simulation is a 3D N-body sim- ulation of the matter distribution of the Universe (Springel et al., 2005). Fig.2.2
displays two snapshots from the Millennium Simulation, showing the distribution of light, to the left, compared to the distribution of dark matter, to the right. A supercluster is present near the center of the image, its size, 125 Mpc/h, is marked in the image to the right.
Observationally, the distribution of dark matter can be obtained from observing the gravitational effect of dark matter on light, i.e., lensing. Fig.2.3 displays the Sloan Digital Sky Survey (SDSS) map of the large scale structure of the Universe, where each dot is an observed galaxy coloured according to the g-r colour of that galaxy.
Galaxy clusters themselves, can be observed in X-ray, since their intergalactic medium (IGM) is filled with hot gas (T≥ 107 K) that emits in X-ray. Further- more, galaxy clusters are typically split into regular and irregular, where the regular clusters are in a relaxed state and dominated by elliptical galaxies, and irregular clusters contain a fraction of spirals close to as large as the fraction in the general distribution of field galaxies.
Figure 2.2: 3D N-body simulation of the cosmic web as described the CDM model.
Left: The distribution of light. Right: The distribution of dark matter. Credit: the Millennium Simulation
Figure 2.3: The large scale structure of the Universe as observed by the SDSS. Each dot represents a galaxy, coloured according to its g-r colour. Credit: M. Blanton and SDSS.
2.2 Galaxy Evolution
1First, note that this thesis adopts the classical Hubble classification, illustrated in Fig.2.4, as elaborated by de Vaucoleur (de Vaucouleurs, 1959). As an example of the classification, the notation of the spiral galaxies, NGC7319 and NGC7320C, can be described as:
• NGC7319 SB(s)bc pec: a barred (B) rather loosely wound (bc) spiral galaxy, with a weak inner spiral (s) and peculiar/disturbed morphology (pec).
• NGC7320C (R)SAB(s): a spiral galaxy with a weak bar (AB), a weak inner spiral (s) and an outer ring (R).
Note that inner rings in general occur at the bar ends, i.e., at the inner Lindblad resonance. While the outer rings typically have a radius of approximately a factor of 1.2 times the radius of the bar. Additionally, it is common that the inner and outer rings contain HI, as well as star formation due to the accumulation of gas at these locations. For elliptical galaxies, the numbering system is in regards to the galaxy’s ellipticity, where a E0 galaxy appears round on the sky and an E5 galaxy’s semi minor axis is half of the semi major axis. Therefore, the naming convention of an elliptical galaxy depends on the viewing angle, contrary to spiral galaxy naming.
Furthermore, the later the Hubble type, the bluer the spectrum is and the stronger the emission lines are, indicating that the later Hubble type the younger galaxy.
1Apart from the aforementioned books, this chapter relies heavily on Kormendy (2013) and the references therein.
Figure 2.4: The Hubble classification scheme. Credit: NASA and ESA.
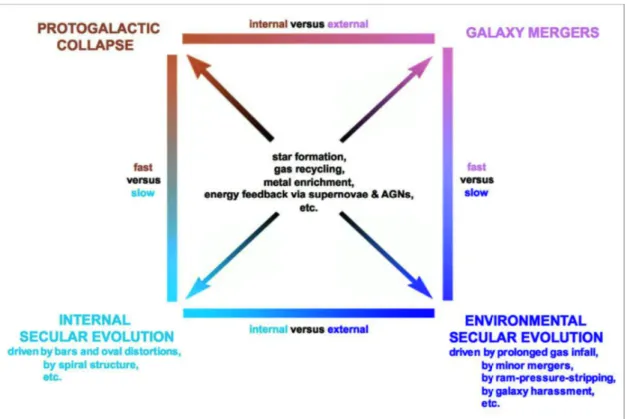
In the early Universe, galaxy evolution was driven by fast processes, such as hierarchical clustering and galaxy mergers. “Fast” is defined as happening on a free-fall timescale, a timescale that is proportional to the gravitational constant, G, and the density of the structure formed, fl, as: t à (Gfl)≠1/2. But as the Universe continues to expand the slow processes will eventually succeed to dominate the evolution of galaxies. Slow processes, i.e., secular, occur over the time span of many galaxy rotations and internal secular evolution is driven by non-axisymmetric structures, such as spiral patterns and bars. External processes driving secular evolution can be, for example, minor mergers or galaxy harassment. Fig.2.5 displays the galaxy evolution process split into four aspects; slow, fast, internal and external.
In general, galaxies are expected to evolve from ordered rotational systems, i.e., spiral disk galaxies, into systems governed by random motion, i.e., elliptical galaxies.
2.2.1 Secular Evolution in Spiral Galaxies
The second law of thermodynamics states that all closed systems aim to maximise entropy, i.e., disorder. An ordered system, such as a spiral galaxy, is continuously at odds with this law, entailing that an increase of order in one region simultaneously increase the disorder in another region. The spiral pattern, i.e., the density waves,
Figure 2.5: The process of galaxy evolution illustrated as fast vs slow and internal vs external. Image based on Kormendy (2013).
are particularly useful in this process, as they transport energy/angular momentum outwards, making inner regions denser and outer regions more diffuse.
In a spiral galaxy almost all of the energy of motion is due to the ordered rota- tion. At radiusr the energy of such a system, E(r), and the corresponding angular momentum, L(r), can be described as:
E(r) = r 2
d„
dr +„, L(r) =
A
r3d„
dr
B1/2
, (2.1)
where „ is the potential energy (Tremaine, 1989). The angular speed of rotation, Ê(r) = dE/dL, can then be related to the potential energy as: Ê = Ò(r≠1d„/dr).
As the disk spreads, a particle of unit mass at radius r2 moves outward and gains angular momentum, dL, relative to a particle of unit mass at radius r1, where r1 < r2. The change in energy that occurs is:
dE =dE1+dE2 =
C
≠
AdE dL
B
1
+
AdE dL
B
2
D
dL= [≠Ê(r1) +Ê(r2)]dL. (2.2) Since Ê(r) typically decreases outwards, the energy change is negative, leading to the conclusion that the spreading of a disk results in a lower energy state.
Measuring the speed,V(r), of a circular orbit at radiusr, the radial-force equation enables an estimation of the mass within that radius:
V2(r)
r = GM(< r)
r2 , (2.3)
whereGis the gravitational constant. The speed,V(r), makes up the rotation curve of a galaxy and can be obtained from the the line-of-sight velocity,Vlos:
Vlos(r, i) = Vs+V(r) sinicos„. (2.4) The line-of-sight velocity is also called the radial velocity, and it is the velocity that is commonly observed. Vs is the systemic velocity, which is the line-of-sight velocity of the centre of the galaxy. iis the angle of which the disk is tilted, measured from face on at i = 0, and „ is the azimuth angle in the disk. Common peak values of the rotation speed of spiral galaxies are Vmax = 150≠300 km/s, but values up to500 km/s have been observed. Brighter and more massive spiral galaxies rotate faster and their luminosity is related to their peak rotation speed according to the Tully-Fisher relation:
LI
4◊1010LI,§ ¥
A Vmax
200km/s
B4
(2.5) where the luminosity is measured in the I band at 0.8µm. An interesting tidbit, is that the Tully-Fisher relation indicates a clear correlation between the amount of dark matter, which governs the rotation curve, and the luminous baryonic matter.
Spiral galaxies often show warping or flaring (disk spreading) in the outer edges of the disks. It is also common, especially in barred galaxies, that V(r) ”= 0 along the apparent minor axis, showing radial motions, which is often comprised of gas moving towards the center of the galaxy. Furthermore, stellar bars exert gravita- tional torques on gas, creating shocks that can be traced by dust lanes and flows to the central region.
As gas moves into the centre of a galaxy, it adds to the dense inner regions of bulges, bars and black hole accretion disks. The feeding processes of black holes remain shrouded in mystery, but will be discussed briefly in Chapter 2.4. When all the angular momentum has been transferred outside of the corotation radius, or when the system has been disturbed through interactions/collisions, so a rotational disk can no longer be maintained, and the gas of the galaxy has been pulled out of the galaxy, fed into the central black hole or formed into stars - the galaxy is expected to reach a state very similar to an elliptical galaxy.
2.2.2 Kinematics of Elliptical Galaxies
While the luminosity of a spiral galaxy is connected to its rotational velocity, the luminosity of an elliptical galaxy is linked to its velocity dispersion, and a higher velocity dispersion means a higher luminosity. This chapter will detail how elliptical galaxies contain information about their origin, and that their slow rotation indicate that they have yet to relax into a final state.
Elliptical galaxies are gas poor, and a kinematic analysis relies on the stellar absorption features. The velocity dispersion of elliptical galaxies is commonly≥200 km/s, but range from≥50km/s in the least luminous ellipticals up to 500 km/s in the centres of the brightest objects. The luminosity in the V band can be connected to the velocity dispersion, ‡, of the galaxy, via the Faber-Jackson relation:
LV
2◊1010L§ ¥
A ‡ 200km/s
B4
(2.6)
The Faber-Jackson relation can also be used to estimate distances, although it is better to use theD≠‡relation, or the fundamental plane relation. TheD≠‡relation relates the galaxy’s central brightness to the luminosity, often settingDas the radius where the average surface brightness in the B-band is 20≠21 mag arcsec≠2. The fundamental plane relation connects the effective radius,Re, and the central velocity dispersion,‡c, to the surface brightness, Ie =I(Re), as:
ReÇc1.2Ie≠0.8. (2.7)
The rotation of elliptical galaxies are expected to follow the virial theorem. The virial theorem relates the long-term averages of the kinetic,KE, and potential, P E, energies of a bound system to each other as:
2ÈKEzzÍ+ÈP EzzÍ= 0. (2.8) A virialised system evolves by heat transfer, where if the centre is hotter than the outer regions, the heat flows outward, which in turn makes the centre contract and heat up. This cycle repeats until the central region collapses. The process requires different amounts of time depending on the structure in question, for globular clus- ters it is short and their collapse is imminent, but for elliptical galaxies this process is longer than the age of the Universe. The fact that elliptical galaxies have not yet reached a relaxed state can be deduced from the difference in the expected and observed rotation velocities.
Let us begin with deriving the velocity we expect in an elliptical galaxy. The kinetic and potential energies of a star,–, at position x–, gravitationally influenced by the other stars in the galaxy, of massesm— at positions x—, can be described as:
KEzz = 1 2
ÿ
–
m–vz–2 , (2.9)
P Ezz =≠ÿ
–”=—–,—
1 2
Gm–m—
|x–≠x—|3(z–≠z—)2, (2.10) where vz– is the z-component of the velocity of star – and vz— the z-velocity for star —. Assuming that the galaxy is axisymmetric and rotates around the z-axis, and that the rotation speed, V, and the velocity dispersions, ‡x and ‡z, are near constant along their axes, the potential and kinetic energies in the two directions can be related as:
ÈP EzzÍ
ÈP ExxÍ = ÈKEzzÍ
ÈKExxÍ ¥ ‡z2
12V2+‡x2 ¥
3B A
40.9
= (1≠‘)0.9, (2.11) where B/A is the galaxy’s axis ratio and ‘ © 1≠ B/A is the ellipticity. The measured/observed speed,Vm, is a fraction of the true rotation speed, V, i.e.,Vm ¥ fiV /4. Combining this knowledge with the assumption of isotropic motions, i.e.,
‡x=‡z =‡, an equation describing the observed velocity as a function of ellipticity emerges:
3Vm
‡
4
© fi 4
Ò2[(1≠‘)≠0.9≠1]¥
Û ‘
(1≠‘). (2.12)
Unfortunately, the values provided from Eq.2.12 do not match observations, Eq.2.12 results in too high values, indicating an anisotropic velocity dispersion. The slow observed rotation must be compensated by random motions and indicate that the relaxation is not complete. Actually, it is common to find kinematically decoupled cores in elliptical galaxies, where the inner part of the galaxy maintain a rotation separate from the outer parts of the galaxy - a clear indication of a system that retains information about how it was assembled and that it has yet to develop rotational axisymmetry.
2.2.3 Galaxy Mergers & Interactions
Galaxy encounters and mergers have immense impact on the galaxies involved, alter- ing their shape and structure by moving large amounts of gas and inciting starbursts and potentially active galactic nucleus (AGN). If mergers trigger AGNs at all red- shifts or not is still up for debate, but there are clear indications of a connection between mergers and AGN at z≥0 (Ellison (2019) and references therein). AGNs will be further discussed in Chapter 2.4.
An interaction between two galaxies, introduce a non-axisymmetric perturbation that breaks the conservation of angular momentum in the individual circular orbits, allowing gas to be funneled to within kpc distances from the nuclei. As most AGNs subsist in gas-rich spiral galaxies, it is reasonable to assume that they are fed with interstellar medium (ISM). Instabilities must be present in the system to enable transfer of the gas inwards, and at the very inner pc’s the viscosity is expected to take over the gas transfer. Mergers are particularly efficient in inducing instabilities and changes in galactic systems, which may be optimal for inciting such gas transfer.
Adding to the conviction of the AGN feeding and starbursts abilities of mergers, is that the atomic and molecular gas fractions have been found to be enhanced in those systems. H2 gas fractions in mergers have been found to be enhanced by a factor of 2-3 (Violino et al., 2018), while HI gas fractions by a factor of 3 (Ellison et al., 2018).
The impact of the merger/interaction event depends on the masses of the galaxies involved. Low-mass galaxies, i.e., dwarf satellites, orbit larger disk galaxies, and merge with the larger galaxy with negligible major impact on the spiral structure of the large galaxy. These kinds of mergers aid in triggering strong inflows of gas and bursts of star formation, and are believed to be a common occurrence, keeping galaxies star forming over long periods of time.
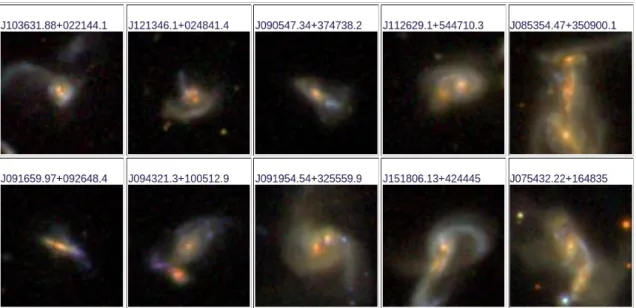
However, when two galaxies of approximately equal mass interact, the impact is distinct. Fig.2.6 displays 10 currently interacting galaxies, imaged by the SDSS.
Particularly interesting is that several of these mergers consist of one confirmed AGN and one starburst galaxy, where the radio emission originates from the starburst galaxy (currently being researched by my colleague Persis Misquitta). A typical example of a merger between two spiral galaxies of similar mass, a major merger, is displayed in Fig.2.7, simulated by V.Springel & S.D.M.White at MPA Garching in 1999. The first close encounter at 1 Gyr after the beginning of the simulation, results in two open bisymmetric spirals, while stars and gas in the outskirts of the encounter are ejected into what later forms tidal tails. The bridge that is created between the
Figure 2.6: A sample of 10 mergers imaged by the SDSS, illustrating the extreme interactions present in such merging objects.
galaxies at≥1 Gyr, is destroyed after the second close encounter, but the large tidal tails remain as an indication of the violent history. The final state of the simulation is a spheroidal system, similar to an elliptical galaxy. Although, observations show disturbed, interacting and peculiar galaxies with rings or bars, with colours that do not agree with those of elliptical galaxies. Combining simulations with observations is the best path towards understanding the process of such galaxy interactions and mergers (Toomre & Toomre, 1972; Barnes & Hernquist, 1992, 1996; Hopkins et al., 2008; Misquitta et al., 2020).
Observing the star formation rate (SFR) of the Universe reveals an increase at z = 1≠3 (Lilly et al., 1996; Madau et al., 1996; Sobral et al., 2013). Most stars in the Universe formed during this period which also coincides with a peak in black hole activity (Stott et al., 2013). Star formation in this period does not follow the main sequence star formation present in today’s Universe (more details on star formation is given in Chapter 2.3). Suggestions of an increase in the gas accretion rate has been put forward (Dekel et al., 2009), but observations suggest that it was an increase in galaxy merger rate that drove the increase in SFR atz ≥2 (Somerville et al., 2001; Hopkins et al., 2006). However, Stott et al. (2013) find no increase in number density of star-forming galaxies, nor increase in merger rate at z≥1≠2, and Pearson et al. (2019) deduced that in general merger have negligible effect on the SFR of galaxies. So although, large impact on SFR by galaxy merger, is observed, it is less common. Galaxy mergers may not have a significant and consistent effect on SFR, but astronomers agree that the process does induce starbursts.
In addition, the tidal debris of interacting galaxies can form self-gravitating en- tities called tidal dwarf galaxies (TDGs) (Zackrisson & Riehm, 2010; Duc, 2012;
Lisenfeld et al., 2016). TDGs are similar to common irregular dwarf galaxies or blue compact dwarfs, however, they exhibit a higher metallicity and lack of dark matter.
Figure 2.7: An example simulation of a merger scenario between two galaxies of similar size. The numbers is the time in Gyr from the start of the simulation. Credit: Max-Planck Institute of Astrophysics, simulated by V.Springel & S.D.M.White at MPA Garching in 1999.
2.2.4 Shocks
Astronomical shocks can be induced by a number of powerful phenomena, such as su- pernovae, density waves at the corotation radius, compression of gas at the bar ends and galaxy interactions, whenever one collection of matter moves into another faster than the local sound speed. Due to the low densities in the Universe, the shocks are often collisionless. Inside galaxy clusters shocks are induced by mergers, turbu- lent flow motions and infall of warm-hot intergalactic medium along filaments (Ryu et al., 2003; Ha et al., 2018). On galaxy scales, extended shock excitation caused by major gas flow due to merger processes has been observed in several nearby galax- ies, commonly in ultra-luminous and luminous infrared galaxies (ULIRGs, LIRGs) (Monreal-Ibero et al., 2010; Rich et al., 2011, 2015). It is common for late-stage mergers to exhibit significant ongoing shock excitation (Rich et al., 2015).
In the collision interface, the medium is heated by the kinetic energy and as it cools, the formation of molecular hydrogen combined with the compression of the ISM/IGM facilitate star formation. The infalling gas can fuel both star formation and AGN activity. And in turn, AGNs drive massive galactic outflows and additional shocks into the ISM and IGM.
In galaxy groups it is common that the galaxies are gas poor, after having lost their gas to the IGM in previous interactions with the other group members (more details of galaxy groups are provided in Chapter 2.5). As new galaxies rush to join the group their relative velocity with regards to the hot IGM gas is faster than the galaxy’s own speed of sound, creating a shock at the intersection of the galaxy’s gas and the hot IGM.
Common shocks in the Universe include radiation mediated shocks from super- novae explosions, relativistic shocks by AGN jets, accretion shocks at the edge of galaxy clusters and bow shocks caused by stellar winds. Radiation mediated shocks are not collisionless, and have obtained their name from the manner in which the shock dissipates, i.e., the shock dissipation mechanism is radiative. Relativistic shocks are induced in processes involving strong magnetic fields and particles accel- erated up to ultra-relativistic energies. They are commonly invoked in gamma-ray bursts, pulsar wind nebulae and AGN jets. Accretion shocks occur at the surface of a compact object and are caused by the compact object accreting matter from its environment at supersonic speed. Bow shocks occur when flowing ambient plasma, such as stellar wind, interacts with the magnetosphere of an object, such as a planet.
2.3 Star Formation
Star formation is playing a vital part in the evolution of the Universe and galaxies throughout cosmic time, driving creation of elements heavier than hydrogen and helium, and infusing the IGM through stellar winds and supernovae. The light from stars dominate the emission observed from galaxies, unless there is a luminous Quasi-Stellar Object (QSO) present in which the non-continuum emission from the nucleus overpower the continuum emission from the stellar population.
When self-gravitating molecular gas clouds cool they lose their radiative pressure support, contracting under gravity and forming dense cold gas clouds suitable for star formation. The Jeans criterion estimates the mass and radius of a cloud in which gravity overcomes the radiative pressure:
MJ =
A5kbT Gm
B3/2A
3 4fifl
B1/2
, RJ =
ˆı
ıÙ 15kbT
4fiGmpmfl, (2.13) where T is the temperature within the cloud, kb is the Boltzmann constant, G is the gravitational constant, m is the particle mass, mp the proton mass and fl the density of the cloud. The typical temperatures present at cloud collapse, ≥ 10 K, require effective radiative cooling. Molecular hydrogen cooling is insufficient, a more efficient coolant is carbon monoxide (CO), since CO molecules can reach collisionally excited states and reduce the cloud temperature as they radiate. Stars form via direct collapse of a gas cloud or via fragmentation. It is common that clouds, during collapse, remain radiatively transparent, i.e., sustain a constant temperature, while increasing its density. This transparency leads to a decrease of the Jeans mass and thereby fragmentation and structure formation of various masses simultaneously, i.e., formation of stellar clusters.
The initial mass of a star is used to determine its type, luminosity and life. The initial mass function (IMF) represent the number of stars that form of a given mass:
⁄ mU mL
m„(m) dm= 1M§, (2.14)
where„(m)dm is the fraction of stars within a mass interval ofdm around massm.
The limitsmLandmU, are usually set to≥0.1M§and≥100M§respectively, based on the fact that stars with a mass of . 0.08M§ cannot ignite hydrogen and stars with a mass of & 100M§ have not been observed. To estimate „(m) the Salpeter- IMF is often used: „(m) Ãm≠2.35. The Salpeter-IMF is derived from observations of stellar mass spectra of young star clusters and a good fit for stars more massive than our sun. The IMF is subjected to uncertainties and there are many questions remaining regarding the IMF, the IMF research field is a very active field.
Individual stars are classified by their spectral type, i.e., their atomic and molec- ular spectral lines. The lettered classification: O, B, A, F, G, K, M, ranges from the hottest O-type stars to the coldest M-type stars. In addition, each letter is further decomposed by a combination with a number sequence, 0-9, where 0 is the hottest and 9 the coolest for that type. There are further extensions of the classification, such as roman numerals noting different types of giants and dwarfs, as well as main
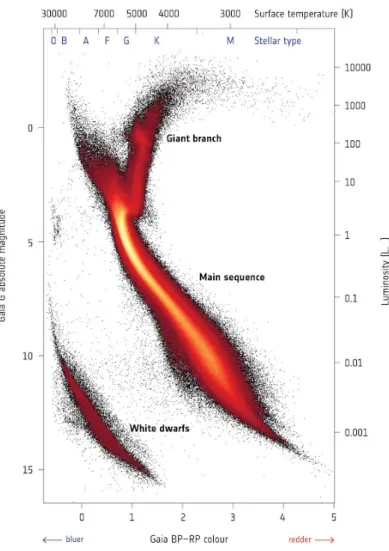
sequence stars. The stellar classification is commonly displayed in a Hertzsprung- Russel diagram (HRD), where the absolute magnitude of the star is shown as a function of the spectral type. Fig.2.8 displays the HRD of the observations of stel- lar populations by Gaia. Most of the stars lie within the main sequence (marked in Fig.2.8), and depending on their initial mass they follow different evolutionary tracks through the diagram.
Figure 2.8: The Hertzsprung-Russell diagram as observed by Gaia. Credit: ESA/Ga- ia/DPAC, CC BY-SA 3.0 IGO.
The colour of the stellar population is particularly useful for studying the star formation history in a galaxy, as individual stars cannot be distinguished in distant systems, and the age of a star is related to its colour. It is expected that SFR, star formation per unit time, decreases over time, since the gas content is depleted, and the spectral distribution can be related to the ratio of the SFR of today and the