Synthesis and spectroscopic characterization of alkali-metal intercalated ZrSe 2 †
Konstantin Nikonov,
∗aNiels Ehlen,
a‡, Boris Senkovskiy
a, Nihit Saigal
a, Alexander Fedorov
a, Alexei Nefedov
b, Christoph Wöll
b, Giovanni di Santo
c, Luca Petaccia
cand Alexander Grüneis
∗aWe report on the synthesis and spectroscopic characterization of alkali metal intercalated ZrSe
2single crystals. ZrSe
2is produced by chemical vapour transport and then Li intercalated. Inter- calation is performed from the liquid phase (via butyllithium) and from the vapour phase. Raman spectroscopy of intercalated ZrSe
2reveals phonon energy shifts of the Raman active A
1gad E
gphonon modes, the disappearance of two-phonon modes and new low wavenumber Raman modes. Angle-resolved photoemission spectroscopy is used to perform a mapping of the Fermi surface revealing an electron concentration of 4.7 × 10
14cm
−2. We also perform vapour phase intercalation of K and Cs into ZrSe
2and observe similar changes in the Raman modes as for the Li case.
1 Introduction
Intercalation chemistry between a wide range of host materials and intercalant species allows one to engineer the physical prop- erties of layered materials. Perhaps the best-studied example of this kind are the graphite intercalation compounds
1. For alkali and alkali-earth metal intercalants, the intercalant atom acts as a charge dopant and graphite becomes superconducting
2–4. In- tercalation of related layered materials such as boron nitride
5, transition metal dichalcogenides (TMDCs)
6,7and black phospho- rous
8,9has also been performed. The largest number of possi- ble combinations between host and intercalant exists for TMDCs which come in the largest variety of host structures
10. Some of the TMDCs like ZrSe
2are interesting materials for thermoelectric application. In particular, it has been shown that doping can be used to engineer the optimal Seebeck coefficient for a given tem- perature
11.Our experiments have also revealed that the structural quality of ZrSe
2remains intact after intercalation of alkali metals which allows performing a comparative study.
Regarding the intercalation, we have to distinguish 1) vapour and liquid phase phase intercalation, 2) electrochemical interca- lation and 3) liquid ammonia assisted intercalation. Vapour phase intercalation can be performed in an ampoule or by evaporating the alkali metal onto the surface of the host crystal. The latter is especially used in surface science experiments such as photoe- mission. The butyl-alkali intercalation method is based on inter-
aII. Physikalisches Institut, Universität zu Köln, Zülpicher Strasse 77, 50937 Köln, Germany. Fax: ++49 221 470 5178; Tel: ++49 221 4703461; E-mail:
grueneis@ph2.uni-koeln.de; nikonov@ph2.uni-koeln.de;
bInstitut für Funktionelle Grenzflächen, Karlsruher Institut für Technologie, Eggenstein- Leopoldshafen, Germany
cElettra Sincrotrone Trieste, Strada Statale 14 km 163.5, 34149 Trieste, Italy
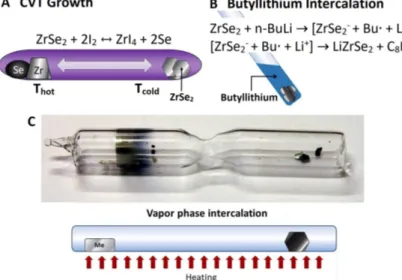
Fig. 1A) Schematics of the growth of ZrSe2single crystals by chemical vapour transport (CVT) reaction. B) butyllithium intercalation. C) Vapour- phase intercalation: photograph and sketch (Me stands for alkali metal).
action between butyl-alkali, typically butyllithium solution and ZrSe
2crystals immersed into it. At first an electron is transferred to ZrSe
2from Bu
−, forming ZrSe
−2, and Li
+ion diffuse into lay- ered structure of ZrSe
2to compensate negative charge. Then two butyl radicals combine and form octane, which readily evaporates from the solution.
The main downside of this method is the fact that due to the more unstable nature of other butyl-alkali compounds, only butyl- lithium solution can be easily acquired and is relatively safe to work with, thus limiting wide usage of this method to Li inter- calation only. Electrochemical intercalation can be peformed in an electrochemical cell where alkali metal ions are solved in an electrolyte. This method has been applied for the transition metal dichalcogenides
12. Ammonia-driven intercalation is based on the unique ability of liquid ammonia to form a stable solution with all alkali metals without chemical interaction. Low temperatures are required to keep ammonia in the liquid phase and also help to control the reaction rate and prevent destruction of crystals during intercalation.
After performing intercalation one wishes to characterize spec- troscopically the reaction product, in particular regards to the charge transferred from the intercalant to the host derived elec- tronic system. To that end angle-resolved photoemission (ARPES) is a key technique that allows to directly probe the electron en- ergy band structure. It has yielded e.g. the Fermi level shift of the potassium doped graphite compound with KC
8stoichiometry
13.
In the present work we prepare and spectroscopically study ZrSe
2alkali metal intercalation compounds
14. ZrSe
2is a semi- conductor of recent interest as it can be grown in high quality on high-k dielectrics and is therefore a good material for field effect transistor applications
15. ARPES spectroscopy has also revealed that spin-orbit coupling effects in ZrSe
2lead to a valence band splitting of ∼300 meV in the valence band at the A point of the 3D Brillouin zone
16. It has also been shown by ARPES that al- kali metal intercalation turns ZrSe
2into a metal both in case of Na
15and Cs doping
14,17with similar effects observed for ZrS
218. However the shape of the Fermi surface has not been shown and the carrier concentration has not been estimated. Raman spectroscopy of doped ZrSe
2revealed shifts of the Raman active phonon modes. However, the low wavenumber (LWN) Raman spectrum of intercalated ZrSe
2has not been studied yet. Little is known regarding the effect of different alkali intercalants. The present work addresses these issues. We prepare bulk Li doped ZrSe
2by butyllithium intercalation for Raman spectroscopy and surface Li doped ZrSe
2by evaporation of Li in ultra-high vac- uum conditions for ARPES. Raman spectroscopy reveals phonon shifts upon doping in agreement to previous literature. In addi- tion we observe peculiar low wavenumber (LWN) phonons upon intercalation that have not been reported so far. A mapping of the Fermi surface of Li doped ZrSe
2by ARPES reveals a carrier concentration of 4.7 × 10
14cm
−2. Finally, K and Cs intercalation compounds are prepared by vapour phase intercalation and char-
2 Synthesis
2.1 Synthesis of pristine ZrSe
2Large crystals of ZrSe
2were grown from pure substances by chemical transport reaction method in vapour phase (CVT)
19. Figure 1A depicts a sketch of the growth procedure. Stoichio- metric amounts of metallic Zr (Sigma-Aldrich) and granular Se were sealed in evacuated quartz tube along with a Pyrex cap- illary containing 0.05g of crystallised iodine as a transporting agent. Sealed ampoule was placed in a two-zone tubular fur- nace with temperature gradient of 115
◦C between cold (810
◦C) and hot (925
◦C) zones of the furnace and held for 120 hours. Un- der those conditions gaseous iodides of Zr are formed and trans- ported along the temperature gradient to the cold zone of the furnace. Temperature decreasing shifts chemical balance back to the forming of ZrSe
2which crystallizes in the cold end of the am- poule in form of thin shiny plates. The average crystal size was
∼5mm
2. The grown crystals were taken out from the ampoule, washed with distilled water and heated under vacuum to remove excess of selenium and iodine left on the crystal surface. Pris- tine ZrSe
2crystals are thin gray-colored platelets, hexagonal in shape and possess metallic shine. On the surface of large crystals one may see spiraling growth pattern. X-ray photoemission spec- troscopy (XPS) experiments were carried out at HESGM beam- line at Helmholtz Zentrum Berlin (HZB)
20. Figure 2A shows an XPS spectrum measured in the vicinity of the Zr and Se 3d core levels confirming the chemical purity of ZrSe
2single crys- tals. Figure 2B shows a Laue diffraction pattern confirming a good structural quality of grown ZrSe
2crystals. An overlay with a simulated diffraction pattern suggests an expected 1T-structure (Fig. 2C). We also have carried out x-ray diffraction to deter- mine the lattice parameters as a = b = 3.765(2)Angstrom and c = 6.145(3)Angstrom.These are in good agreement to the liter- ature
21.
2.1.1 Lithium intercalation
Figure 1B depicts a sketch of Lithium intercalation by the con- ventional butyllithium method
22. A ZrSe
2crystal was immersed into 1M n-butyllithium solution in hexane for 72h, washed with hexane and stored under Ar. The intercalated crystal turns blue and its surface begins to degrade. The Li doped crystals undergo deintercalation if exposed to atmosphere.
2.1.2 Vapour phase intercalation
Figure 1C depicts a photograph and a sketch of vapour phase in- tercalation. Potassium and caesium intercalations were carried out in this way. The alkali metal and ZrSe
2crystals were placed into an evacuated Pyrex ampoule. The ampoule was placed into a thermal gradient of 150-200
◦C for 96h. Alkali vapor interacts with ZrSe
2and metal atoms diffuse into the layered structure.
During this process direct contact of the crystals with molten
Fig. 2A) X-ray photoelectron spectroscopy of as-synthesized ZrSe2. The Zr 3d and Se 3d peaks are shown. B) Laue diffraction pattern of as- synthesized ZrSe2. The open circles depict calculations of diffraction spots. C) Sketch of the crystal structure of the 1T phase (Zr in blue, Se in red).
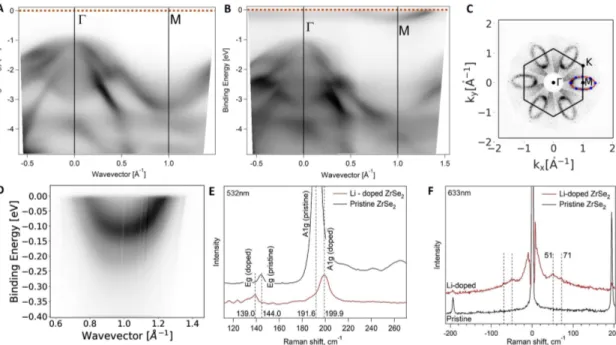
Fig. 3ARPES (hν=36eV, T=20 K) scan along the high symmetryΓMline of A) pristine and B) Li-doped ZrSe2. C) Fermi surface mapping (a symmetrization has been applied). The blue points denote the experimental ARPES maxima and the red line an elliptical fit. The area of the ellipse has been used to determine the charge carrier concentration (see text). The photon energy washν=36eV in all spectra. D) High-resolution ARPES spectra parallel to theΓMdirection showing a splitting in the conduction band. E) Raman spectra of pristine and Li-doped ZrSe2 measured with a green (λ=532 nm) laser. F) Low wavenumber Raman spectra of pristine and Li-doped ZrSe2(λ=633 nm). All Raman spectra were recorded at room temperature.
2.1.3 Lithium deposition
For the ARPES experiments, several monolayers of lithium were evaporated from a commercial SAES getter source onto the sur- face of ZrSe
2. The doping was performed in an ultra-high vacuum (UHV) chamber in steps up to the maximum Fermi level with the sample at 20 K. The amount of Li was calibrated by a quartz micro balance.
3 Spectroscopic characterization
3.1 Angle-resolved photoemission spectroscopy
Alkali metal doping of ZrSe
2leads to changes in electronic and crystal structure which can be observed using ARPES. ARPES was performed at the BaDElPh beamline
23of the Elettra synchrotron in Trieste (Italy) with linear s- and p- polarisation at tempera- tures of 20 K. The crystal surfaces were prepared in-situ in a vac- uum better than 5 × 10
−11mbar and at liquid He temperatures by cleaving with a top post inside the analysis chamber. Imme- diately after the cleave we determined the high-symmetry direc- tions through low-energy electron diffraction. ARPES data taken from pristine ZrSe
2are shown in Figure 3A and reveals a semi- conductor band structure with the valence band maximum at the Γ point of the Brillouin zone. Upon doping by Li this picture dras- tically changes and the Fermi level moves into the previously un- occuppied conduction band. Most importantly, at the M point in the BZ, a parabolic band appears which crosses the Fermi energy.
This clearly indicates a transition from semiconducting to metal- lic electronic properties. In order to estimate the charge carrier density on the ZrSe
2layers, we performed ARPES mapping of the Fermi surface. The Fermi surface map (hν = 36 eV) is shown in Figure 3C. This photon energy corresponds to the A point of the 3D BZ. A fit of the ARPES maxima using an ellipse allows to calculate the charge carrier density equal to 4.7 × 10
14elec- trons per square centimeter. Figure 3D depicts a cut through the pocket (hν = 22 eV). A splitting of the conduction band by about 100 meV can be seen which we tentatively attribute to spin-orbit coupling
16. Assuming a complete charge transfer for each Li ion, we estimate a stoichiometry of about 1 Li per two unit cells.
3.2 Raman spectroscopy
3.2.1 Butyllithium intercalated ZrSe
2The Raman spectra of pristine ZrSe
2that we obtained under am- bient conditions fit the literature data very well
24. Alkali metal intercalated ZrSe
2can not be measured in ambient conditions be- cause of the high reactivity with air. We have overcome this prob- lem in two ways. One is that we have made use of an ultra-high vacuum (UHV) Raman system
25,26. Samples were taken from the ampoules and mounted on a wobble stick in a vacuum suitcase in- side a glove box. Then, these samples were transferred into the UHV Raman without exposure to air. A second method that is a bit easier to apply works by reloading the intercalated samples into an ampoule with a flat surface (Hilgenberg) inside an Ar box.
Figure 3E depicts Raman spectra of pristine and Li doped ZrSe
2. Upon doping with alkali metals, the characteristic peaks of A
1gad E
gmodes are shifted to lower and higher wavenumbers, respec- tively. This observation is in good agreement to previous data
27. In the case of low frequency Raman spectra (Figure 3F) one can see low energy Raman modes at 51 cm
−1and 71 cm
−1appear- ing after doping. Interestingly, there are two more weak Raman modes present in pristine ZrSe
2at 240 cm
−1and 260 cm
−1(Fig- ure 3E). These have been assigned to two-phonon processes
24. Upon doping we can not observe them any more which points towards a loss of the resonance condition for two phonon scatter- ing upon shifting the Fermi level. Notably, Raman measurements at several spots across the samples revealed that the intercalated samples are homogeneous.
3.2.2 Cs and K intercalated ZrSe
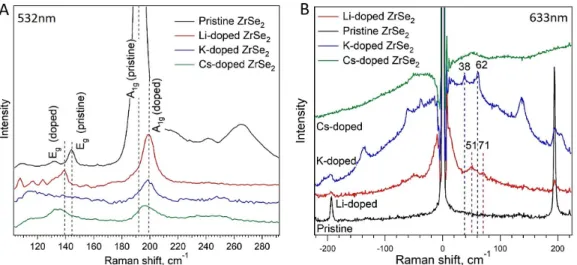
2Along with well-known Li intercalation we performed K and Cs in- tercalation from the vapour phase into bulk ZrSe
2crystals. These Raman spectra are shown in Figure 4A an display similar effects as in the lithium doping cases, i.e. the shifting of A
1gand E
gphonon modes. The phonon energy shift upon doping was exten- sively investigated for example for graphene
28. It has been shown for graphene that there are two main contributions: one is the lattice expansion which causes a downshift. The second contribu- tion is the phonon self energy which can change with doping. We speculate that a similar reasoning might be applied for ZrSe
2, too.
Interestingly, the low-wavenumber Raman modes for Li, K and Cs intercalants appear at different energies. For the K intercalated ZrSe
2, we observe them at 38 cm
−1and 62 cm
−1respectively, and for Cs intercalated ZrSe
2a broad mode around 60 cm
−1appears.
These modes have not been reported so far and could in principle be a result of one or several following reasons: 1) changes in the lattice structure and defect formation upon interaction with the alkali metal 2) dopant derived vibrations and 3) electronic Raman scattering. The high structural quality of doped samples as e.g.
evidenced by ARPES makes 1) unlikely. Moreover, the tempera- ture of the Raman measurements was room temperature which makes 3) unlikely. Since there is a distinct dopant dependence which shifts the phonons to lower wavenumber with increasing dopant mass, we speculate that the LWN phonon modes belong to alkali ion vibrations.
4 Conclusions and outlook
In conclusion we have synthesized Li doped ZrSe
2by butyllithium intercalation from the liquid phase and by evaporation of Li in UHV conditions onto the ZrSe
2surface. For the bulk sensitive Ra- man spectroscopy, the samples intercalated by butyllithium have been used. For the surface sensitive ARPES method Li evapora- tion in UHV has been applied. Upon Li doping, the semiconduc- tor ZrSe
2becomes metallic which is evidenced by the appearance of an elliptical Fermi surface around the M point in the 2D BZ.
Also the phonon system of ZrSe
2undergoes changes, in particular
phonon energy shifts of the Raman active A
1gand E
gphonons are
Fig. 4A) Raman modes of pristine and intercalated (Li, K, Cs) ZrSe2(λ=532 nm). B) Low-frequency Raman spectrum (λ=633 nm). All Raman spectra were recorded at room temperature.