• Keine Ergebnisse gefunden

Advancing Functional Understanding of Primary Production in Drylands: Insights from a Data-Integration Approach

N/A
N/A
Protected

Academic year: 2021

Aktie "Advancing Functional Understanding of Primary Production in Drylands: Insights from a Data-Integration Approach"

Copied!
153
0
0

Wird geladen.... (Jetzt Volltext ansehen)

Volltext

(1)

Advancing Functional Understanding of Primary Production in Drylands: Insights from a

Data-Integration Approach

I n a u g u r a l - D i s s e r t a t i o n

zur

Erlangung des Doktorgrades

der Mathematisch-Naturwissenschaftlichen Fakultät der Universität zu Köln

vorgelegt von

Jan Christian Ruppert

aus Bad Mergentheim

(2)

2

Berichterstatter:

Prof. Dr. Michael Bonkowski Prof. Dr. Hartmut Arndt

Prof. Dr. Stefan Porembski (Universität Rostock)

Vorsitz der Prüfung:

Prof. Dr. Frank Schäbitz

Beisitzerin:

Dr. Anja Linstädter

Tag der letzten mündlichen Prüfung: 26. Mai 2014

(3)

3

1. General Introduction ... 4

1.1 Dryland Ecosystems of the World ... 4

1.2 Primary Production in Drylands ... 8

1.3 General Methodological Approach and Database ... 16

1.4 Aims of this Dissertation ... 20

2. Publications of the Dissertation ... 25

2.1 Meta-Analysis of ANPP and Rain-Use Efficiency confirms indicative value for Degradation and Supports non-linear Response along Precipitation Gradients in Drylands ... 26

2.2 Convergence between ANPP Estimation Methods in Grasslands – A practical Solution to the Comparability Dilemma ... 51

2.3 Quantifying Dryland Resistance and Resilience to Drought: The Importance of Drought Intensity, Grazing Regime and Vegetation Structure ... 78

3. Additional Publications ... 121

3.1 Response of community-aggregated Plant Functional Traits along Grazing Gradients: Insights from African semi-arid Grasslands ... 122

3.2 Discrimination and Characterization of Management Systems in semi-arid Rangelands of South Africa using RapidEye Time Series ... 123

3.3 Effect of Tenure System on Biomass and Vegetation Cover in Two Biomes in South Africa .... 124

3.4 Are there consistent Grazing Indicators in Drylands? Testing Plant Functional Types of various Complexity in South Africa’s Grassland and Savanna Biome ... 125

4. Discussion ... 126

5. References ... 135

6. Summary / Zusammenfassung ... 143

7. Appendix ... 146

8. Danksagung ... 149

9. Declaration of Contribution as Author and Co-Author ... 151

10. Statutory Declaration and Statement (Erklärung) ... 152

11. Curriculum Vitae ... 153

(4)

General Introduction

4

1. General Introduction

1.1 Dryland Ecosystems of the World 1.1.1 Definition and Botanical Ecology

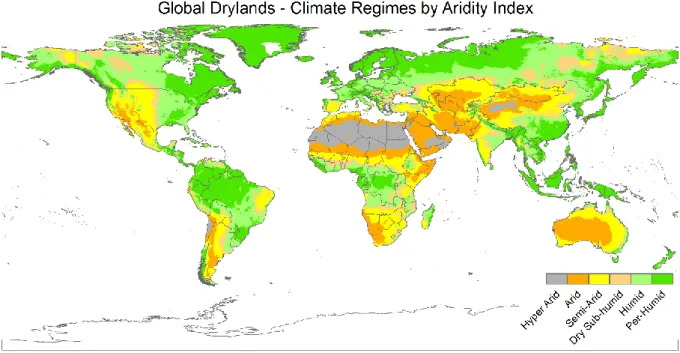
Dryland ecosystems – as indicated by their name – are defined and characterized by water deficiency during prolonged periods throughout the year (UNEP, 1997). Based on the UNEP aridity index, drylands are subdivided in four subtypes, in order of decreasing aridity: hyper-arid (desert), arid, semi-arid and dry sub-humid (Figure 1.1; UNEP, 1997).

All dryland-subtypes together cover roughly 41% of terrestrial earth surface spreading across all continents (except Antarctica; Figure 1.1) and are home to circa 35-40 % of Earth’s human population (approximately 2.5 billion in 2005; MEA, 2005). Besides the shortage of water availability in these regions – either due to low rainfall and/or high evapotranspiration – they are also characterized by a pronounced spatiotemporal variability in rainfall (Davidowitz, 2002). The combination of a relatively strong water limitation, a high inter- and intra-annual variability of precipitation, and a high spatial heterogeneity in other vegetation-relevant factors (e.g. edaphic parameters), largely limit vegetation growth. This is translated into a pronounced variability in seasonal and annual vegetation dynamics.

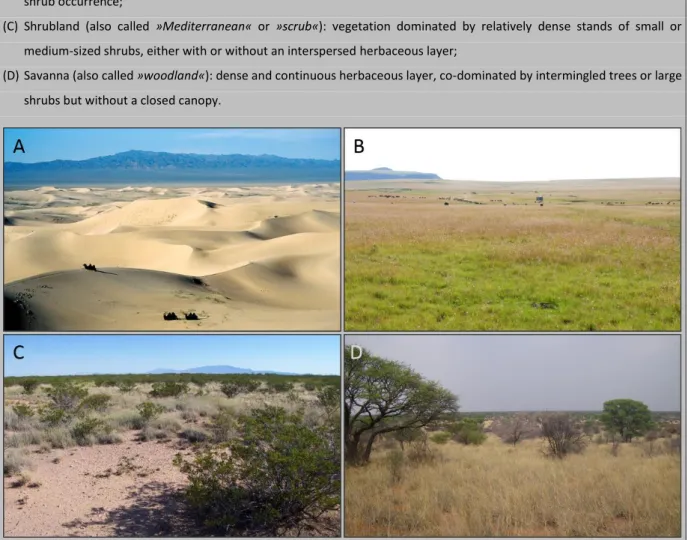
Drylands ecosystems comprise four broad biome-types – desert, grassland, shrubland and savanna – which, in this order, represent a gradual increase in architectural complexity of the vegetation, and also in average primary production (see Box 1.1; Hassan et al., 2005).

Figure 1.1: Overview on worlds’ broad climate regimes as defined by the United Nations Environment Programme (UNEP)

aridity index. Aridity Index (AI) = MAP / MAE where MAP = mean annual precipitation and MEA = mean annual potential

evapotranspiration. Drylands, given in grey and yellowish colors, comprise hyper arid (AI < 0.03), arid (0.03 - 0.2), semi-arid

(0.2 - 0.5) and dry sub-humid (0.5 - 0.65) climates. Map is based on data provided in Trabucco and Zomer (2009).

(5)

5

Box 1.1 – Biome Classification

Throughout this dissertation, and publications presented herein, an adapted version of the WWF biome classification (Olson et al., 2001) was used, following Hassan et al. (2005). This adaption was applied to account for the differing spatial scales (field vs. landscape). In total, four broad »dryland biomes« are distinguished as compared to the original eight (for drylands).

In detail, these biomes are

(A) Desert: extremely sparse vegetation, mostly woody shrubs or well-adapted herbs, grasses and succulents;

(B) Grassland: herbaceous layer with relatively dense cover, dominated by annual or perennial grasses; little to no tree and shrub occurrence;

(C) Shrubland (also called »Mediterranean« or »scrub«): vegetation dominated by relatively dense stands of small or medium-sized shrubs, either with or without an interspersed herbaceous layer;

(D) Savanna (also called »woodland«): dense and continuous herbaceous layer, co-dominated by intermingled trees or large shrubs but without a closed canopy.

Figure 1.2: Examples of the four dryland biomes. (A) Gobi Desert in Mongolia, (B) Themeda triandra grassland in South Africa, (C) Creosote shrubland in New Mexico, USA, and (D) Acacia savanna in the Kalahari, South Africa.

Sources: (A) www.worldtopjourneys.com, (C) www.lternet.edu/sites/jrn/. Sources are only given for photographs or graphics that were not produced by me.

Even though these dryland biomes tend to follow a gradient of decreasing aridity (deserts > grassland

> shrubland > savanna), their actual distribution can be largely independent from climate and might be more affected by other abiotic and biotic factors (e.g. edaphic factors, topography, current and past land use; Hassan et al., 2005). For example, the hyper-arid dryland subtype nearly exclusively inhabits deserts while the semi-arid subtype shows a mixture of all dryland biomes-types.

The dynamic and unreliable intra- and inter-annual fluctuations in dryland vegetation characteristics

described above (e.g. cover, composition and primary production), mostly leave no option for

(6)

General Introduction

6 resource-based human activities other than livestock production and (self-sufficient) crop-farming. In fact, circa one third of drylands’ human population directly depends on agriculture for their livelihood.

Only 25% of drylands are used as croplands (rain-fed or, in the wealthy dryland regions of North America and Europe, irrigated), while roughly 65% are predominantly used as rain-fed rangelands (MEA, 2005). Thus, livelihood security in these regions mainly relies on provision of basic ecosystem services such as forage and crop yield for animal production and/or self-sufficiency (Gillson and Hoffman, 2007).

1.1.2 Drylands under Threat – Global Change Impacts

Unsurprisingly drylands have been recognized as highly vulnerable and degradation-prone regions, especially in the light of global change (IPCC, 2007, MEA, 2005, Zhao and Running, 2010).

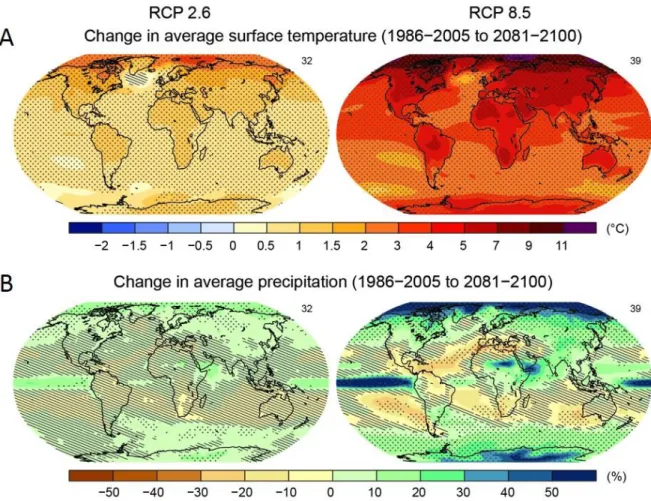
Even though projections in the climate regime of dryland environments exhibit considerable variability and uncertainty across scenarios and regions (Figure 1.3), there is a general trend that most dryland regions are facing unbeneficial changes.

Figure 1.3: Maps of projected late 21st century annual mean surface temperature change (A) and annual mean

precipitation change (B). This image is an excerpt from the SPM.8 figure and a courtesy of the IPCC (2013).

(7)

7 Global models for the period of 2081-2100 project a temperature increase in drylands between 1 °C and 5 °C as compared to 1986-2005 across scenarios and regions (Figure 1.3A). For the same period, changes in precipitation are more diverse across scenarios (Figure 1.3B) as projections vary between roughly constant conditions (±10% in annual precipitation) and large-scale decreases across drylands of up to -20% (but also local increases, e.g. in Tropical and East Africa; IPCC, 2013).

In sum, drylands are facing increased temperatures, while precipitation amounts stagnate or decrease, thus leading to increased evapotranspiration and less plant-available water. Simultaneously, precipitation is becoming more variable and extreme events such as heavy rains and dry spells will occur more frequently (IPCC, 2013), making the overall climate system less reliable.

At the same time large proportions of dryland areas are subject to significant population growth and urbanization (MEA, 2005), both inevitably leading to expansion of agricultural land and intensification of livestock production (i.e. higher stocking rates and densities; Foley et al., 2005).

Please note, that potential effects of elevated CO 2 -concentrations are not regarded throughout this thesis. Most importantly, this is due to a paucity of related monitoring and experimental data.

Furthermore, the effects of elevated atmospheric CO 2 on drylands, as well as the role of dryland ecosystems in the global carbon cycle are far from being fully understood (Maestre et al., 2013).

However, recent findings suggest that bush encroachment – a common and highly undesirable phenomenon in drylands (Andela et al., 2013) – is partially triggered by elevated CO 2 -concentrations (i.e. »CO 2 -fertilization«; Buitenwerf et al., 2012, Higgins and Scheiter, 2012).

Altogether, projected changes of the climatic system will – for all we know about drylands – hamper ecosystem functioning and decrease provision with ecosystems services, while land use change will increase the pressure on the systems and act as additional stressor (Zhao and Running, 2010, Zhao et al., 2007). Threats of co-occurrence of these unbeneficial conditions could already be observed during the last decades: severe droughts in densely populated drylands worldwide were responsible for massive reductions in livestock and crop productivity (Zhao and Running, 2010), leading to poverty and famine (UN, 2008). Furthermore, predicted changes in vegetation state and functioning may have the potential to cause rapid ecosystem transitions and/or lead to switches to stable states with undesirable low vegetation cover and biomass: degradation up to desertification (Golodets et al., 2013). In this context, the concept of ecological stability is of major interest and relevance.

1.1.3 Aspects of Ecosystem Stability

In today’s ecological research, discerning the mechanisms behind, and the quantification of ecosystem

responses to global environmental change is a central theme (Reed et al., 2012) and often related to

the concept of ecosystem stability (or resilience; Pimm, 1984, Holling, 1973).

(8)

General Introduction

8

Box 1.2 – Stability and Resilience

Stability and resilience – even though commonly used in ecological literature – both lack a definition that is widely shared among scientists. While some scientists understand resilience as a sub-aspect of stability (Donohue et al., 2013), others understand them as largely unrelated capacities of ecosystems (Holling, 1973). Furthermore, resilience itself has been defined in various ways, emphasizing different aspects of ecosystem behavior, and even leading to competing paradigms of ecosystems understanding (e.g. engineering vs. ecological resilience; Holling, 1996). To avoid confusion or misinterpretation, I follow the approach of Donohue et al. (2013) and use the term »ecosystem stability« in the sense of a »multifaceted and complex concept«, including distinct aspects such as »resilience (recovery), resistance, robustness, persistence and variability«

that can be generically defined and estimated.

Throughout this dissertation, I use the term stability in favor over resilience (see Box 1.2).

Unfortunately, little efforts have been made to contribute to a functional understanding of dryland stability. So far results on dryland stability are merely anecdotic as they arrived from single sites or regions and focused on differing estimates of stability (e.g. variability, resistance or recovery; Knapp and Smith, 2001, Bai et al., 2004) that are often based on largely differing ecosystem properties (e.g.

species composition, biodiversity or primary production; Peterson et al., 1998, Tilman and Downing, 1994). Due to their vastly varying methodology and their spatiotemporal constraints, these findings lack the potential to be representative across larger scales, nor can they be easily up-scaled. Hence, there is a general demand for an increased functional understanding of dryland ecosystem responses to global change (Reynolds et al., 2007), but no obvious or easy to achieve strategy to satisfy this demand (see Chapter 1.3).

1.2 Primary Production in Drylands

1.2.1 Aboveground Net Primary Production

As stated above, the predominant land use types in drylands are pasture-based livestock production and to a lesser extent crop production. Thus, livelihood and income security in drylands strongly rely on revenues from forage production and crop yield (Gillson and Hoffman, 2007).

Both of these ecosystem services are commonly estimated by aboveground net primary production (ANPP), the sum of produced aboveground plant tissue within one year, usually expressed in g m -2 or kg ha -1 (Scurlock et al., 2002). ANPP is very versatile as it can be estimated relatively fast and cheap in all terrestrial ecosystems. More importantly, it is directly connected to essentially all aspects of matter and energy fluxes in terrestrial ecosystems, not only in drylands (Lauenroth et al., 2006).

Unsurprisingly, it is one of the best-documented quantitative estimates for several ecosystem services

(such as the above mentioned) and a core ecological currency. Hence, ANPP (and derivates thereof,

e.g. rain-use efficiency; Le Houérou, 1984, Yan et al., 2013) are used to assess and represent annual

dryland productivity and other key ecosystem characteristics throughout this dissertation.

(9)

9

1.2.2 Drivers of Primary Production in Drylands

As per definition, dryland ecosystems are water-deficient throughout prolonged periods within a year (Figure 1.1). Hence, it is not surprising that water, usually provided by precipitation only, acts as the main limiting factor for primary production in these systems (Lauenroth and Sala, 1992, Linstädter and Baumann, 2013); and is also highly important in other terrestrial ecosystems (Huxman et al., 2004).

Therefore, ANPP is often interpreted as function of precipitation (Sala et al., 1988) and plotted along precipitation gradients. Even though the generality of water limitation in drylands is widely accepted, there is lack of consensus about the response-pattern of ANPP along these precipitation gradients on different temporal and spatial scales. Most studies report a linear relationship with precipitation (O'Connor et al., 2001, McCulley, 2005, Muldavin et al., 2008, Bai et al., 2008) but differ in intercept and slope. Other studies report a saturation curve, where ANPP increases with precipitation, but levels- off under more humid conditions (Hein, 2006, Yang et al., 2008, and partially Miehe et al., 2010, and Huxman et al., 2004).

Given these concurring results in literature, neither of the regression models seems appropriate per se. Hence, continued theoretical and empirical considerations are needed to assess this issue, as the elucidation of general mechanisms in ANPP-precipitation relationships are a useful desideratum not only for functional ecologists but also for ecosystem modelers (see Chapter 2.1).

Not only current but also previous precipitation conditions influence ANPP (i.e. those of the last season or year). This aspect of the ANPP-precipitation relationship has been described as the

»memory«- or legacy effect of grasslands (Wiegand et al., 2004). The relevance of previous precipitation for ANPP can be explained by a carry-over effect of vegetation density (Yahdjian and Sala, 2006, Linstädter and Baumann, 2013), the amount of reserve biomass in perennial species at the beginning of the growth period (Müller et al., 2007, Zimmermann et al., 2010) and by increased seed production and quality in annual plant communities (Harel et al., 2011). This carry-over effect may explain the majority of unexplained variance in grassland production, especially in perennial systems (Wiegand et al., 2004).

Edaphic factors also play a crucial role for biomass production in the context of water limitation. Soil

characteristics such as texture, bulk density and depth influence how water infiltrates and penetrates

the soil, as well soil’s water-holding capacity, thus, these characteristics determine how much

intercepted precipitation is available for plants (Archer and Smith, 1972). Furthermore, soil moisture

affects nutrient availability and cycles, another prerequisite for plant growth, hence also for primary

production (Hooper and Johnson, 1999, Delgado-Baquerizo et al., 2013).

(10)

General Introduction

10 Unlike to humid regions (e.g. central or northern Europe), coarse-texture soils have been recognized as beneficial for plant growth and primary production in drylands as compared to fine-textured soils (Sala et al., 1988). This observation is described as the »inverse-texture hypothesis« (Noy-Meir, 1973):

in dryland regions, less water evaporates from coarse-textured soils (with a high sand content), as water infiltrates more quickly and deeper in the ground than on fine-textured soils. Furthermore, the top-layer of fine-textured soils dries out more quickly under dryland conditions, hardens and builds a barrier against rise and evaporation from deeper soil levels as well as against infiltration of later precipitation events (Alizai and Hulbert, 1970). This phenomenon leads to the paradox situation that those soils which are described as poor in Middle European contexts (European Soil Bureau, 2005), i.e.

deep sands, carry the densest vegetation cover and are often most productive in drylands (Schulte, 2002, Sala et al., 1988, Le Houérou, 1984).

As for all vegetation, also deficient provision of nutrients (mainly carbon, nitrogen and phosphorus) acts limiting on ANPP in drylands (Hooper and Johnson, 1999, Delgado-Baquerizo et al., 2013). In the context of drylands, this is particularly interesting for two reasons. First, drylands’ intense livestock production may deplete soil nutrient pools (Hassan et al., 2005) and second, increased aridity – as projected for most drylands (Figure 1.3) – may decouple soil nutrient cycles (Delgado-Baquerizo et al., 2013). Intense livestock production in drylands leads to a partial decoupling of nutrient in- and output as compared to more natural conditions what may successively deplete soil nutrients pools (Hassan et al., 2005). For once, herbivore density is much higher under livestock production schemes and, given the high metabolic needs of herbivores, leads to a higher proportion of respirational loss of carbon.

Furthermore, grazing-/browsing- and roaming-behavior of livestock largely centralizes their excreta and thus nutrients near attraction-loci (boreholes, licks or shade trees) while depleting other parts of the range (Andrew, 1988, Moreno García et al., 2014). Finally, livestock products (e.g. meat, milk, fur) are extracted from the systems as well, thus preventing in-situ nutrient return.

A recent global assessment of C, N and P cycling in drylands reports that increasing aridity reduces C and N, but increases (inorganic) P concentrations (Delgado-Baquerizo et al., 2013). The study argues that under increased aridity these responses might lead to a progressive decoupling of the mentioned nutrient cycles, with detrimental effects on key ecosystems services such as primary production. The authors assume that lowered plant cover due to increased aridity, which favors physical over biological nutrient cycling processes, is the main mechanism behind this decoupling.

Parallel to the above-mentioned biotic and abiotic factors, also management-related aspects affect

primary production. In the context of this dissertation, I will mainly highlight the effects of grazing and,

however briefly, fire. Even though both aspects are also natural processes in drylands, the

(11)

11 preponderant use of drylands as rangelands and the related anthropogenic management modifies their dynamics in specific ways, which are also highly important in the context of ecosystem functioning and dynamics (Belsky, 1992, Holdo et al., 2007). Hence, both aspects need to be assessed under the premises of (varying) management.

The effect of grazing on (herbaceous) primary production has been described as a first-order effect of reduced vegetation cover due to defoliation (Wiegand et al., 2004): mechanic defoliation reduces plants’ cover and photosynthetic active tissue, thus the overall carbon-fixation and rate of tissue production. Furthermore, the relative and absolute cover of bare soil might trigger other detrimental effects such as water or wind erosion, run-off and nutrient loss by volatilization which feedback on primary production as well (Figure 1.4; O'Connor et al., 2001, Milchunas and Lauenroth, 1993, Yan et al., 2013). Obviously these effects are directly connected to the intensity, timing and frequency of grazing (Linstädter, 2008), with more extreme regimes (i.e. high stocking densities, cf. Figure 1.4) being more harmful (Milchunas and Lauenroth, 1993, Palmer and Ainslie, 2005). Nevertheless, the actual effect of grazing across different (dryland) environments might fluctuate, which has frequently been related to the evolutionary history of grazing at the given sites (Milchunas et al., 1988, Linstädter, 2008). This explanation stresses the idea that regions, which have been subject to grazing for prolonged evolutionary time scales, will exhibit vegetation that is well adapted to grazing disturbances (e.g. African savanna systems). In fact, prolonged grazing exclusion may lead to completely altered species assemblages in such systems, with the consequence of reduced primary production – however, in other cases the exact opposite might apply (Angassa et al., 2012, Schulte, 2002), underlining variability of dryland ecosystems (Milchunas et al., 1988). Furthermore, the actual impact of grazing is also moderated by the general condition of the rangeland (health or degradation status), with degraded rangelands suffering more strongly (O'Connor et al., 2001).

Figure 1.4: Effects of (over-) grazing in drylands. (A) »Piosphere« (i.e. the degraded area around an attraction loci for animals; Andrew, 1988) in a communal grazing land. Clear signs of overutilization are visible: reduced plant cover and a high density of excreta. (B) Marked fence line between two camps of differing land use: the left camp was stocked with game for recreational purposes in low stocking densities. The right camp was used for cattle with a recommended stocking density of ca. 12 ha cow -1 . Both photographs derive from the Kalahari, near Hotazel, South Africa, in 2010.

B

A

(12)

General Introduction

12 Another aspect related to grazing is compensatory growth – regrowth after tissue loss – that might even lead to »overcompensation« (McNaughton, 1983). Compensatory growth is a common and rather fast response of most plants, especially in non-woody tissues. Grasses are particularly well adapted to losses in vegetative organs, as their relatively low-laying and abundant meristems can compensate tissue losses rather rapidly. In grazing-adapted ecosystems, such as most drylands, (perennial) plant mortality after defoliation is virtually non-existent if it is not coincident with unfavorable climate conditions such as severe drought (Zimmermann et al., 2010). Furthermore, under low levels of grazing – or other sources of injuries – regrowth might even exceed the preceding tissue loss, that is

»overcompensation« (McNaughton, 1983, Belsky et al., 1993; Note: Belsky et al. do not support the term »overcompensation« as it is historically connect to grazing, but acknowledge the general phenomenon). Furthermore, severe grazing has also shown to increase seed production and survival in herbs, thus plant fitness, which can be seen as another pathway of overcompensation (Paige and Whitham, 1987).

Altogether, grazing is a complex driver of ecosystem dynamics in drylands and on primary production, as it triggers not only effects on plant individuals but also on communities and their habitats, which again might feedback on primary production (Linstädter and Baumann, 2013). Overall, the most general statement for the influence of grazing on dryland ANPP in this context might be »Dosis sola facit venenum« (Paracelsus, 1538 in 1922).

Besides precipitation, edaphic factors, nutrients and grazing, fire is one of the most influential effectors of aboveground net primary production in dryland ecosystems and even more on structural aspects of dryland biomes. However, as fire is of less interest for the studies within this dissertation, I will only throw a short spotlight on the most important aspects.

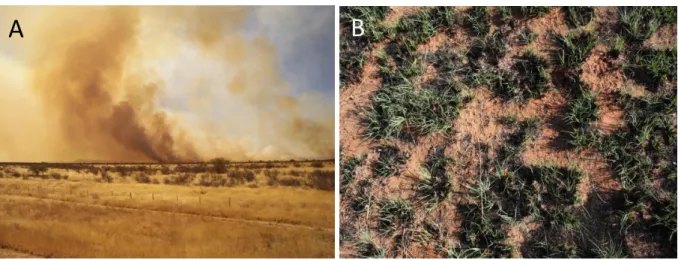
Figure 1.5: Wildfires in drylands. (A) Wildfire at Kamanjab, Namibia, in 2006. (B) Resprouting of a burned bunchgrass community in Bloemfontein, South Africa, in 2010. Photograph (A) is a courtesy of A. Linstädter.

A B

(13)

13 (Wild-) fires are often triggered by lightning, or accidentally by campfires or other anthropogenic sources (Figure 1.5), but might as well be part of land management (»prescribed burning«, H.A. Snyman pers. comm.). As fires need a minimum fuel-load to persist and spread (Linstädter and Zielhofer, 2010), they are more frequent and widespread in the semi-arid and dry sub-humid than in the arid or hyper arid dryland-subtypes, as these systems have the tendency to be more productive and thus have the potential to accumulate more flammable dead biomass (Oesterheld et al., 1999, Linstädter and Zielhofer, 2010). Effects of fire on current year’s primary production are rather obvious, but highly dependent on the timing of the fire event during the vegetative state of the plant community. For instance fire events at the end of the vegetative cycle might consume all biomass and leave only little opportunity for regrowth in the same season, thus they hardly have an effect on (current year’s) ANPP.

On the other hand, fire before or in the beginning of a growing season might increase ANPP in various ways. For once, burning of standing (dead) biomass releases nutrients in form of highly fertile ash to the soil, thus boosting nutrient-pools (Buis et al., 2009). Furthermore, fire opens a window of opportunity for increased recruitment and primary production (Zimmermann et al., 2008), as detrimental effects of competition for light and spaces are eased by the re-opening of the woody- and/or grass-canopy (Blair, 1997, Oesterheld et al., 1999, Zimmermann et al., 2010). On the other hand, fires during sensitive vegetative phases (such as shoot growth) might also reduce ANPP, as relative fitness of plant individuals is reduced after the fire, and the soil-fertility boost might not compensate for these losses. Hence, it is not surprising that effects of fire on ANPP have been reported to vary remarkably, reaching from ANPP decreases of -80% up to increases of 300%, depending on frequency and timing of the fire event (Oesterheld et al., 1999).

Despite these first-order effects of fire on ANPP, there are also second-order effects, as fire is also believed to largely affect ecosystems structure. For example, large scale fire-exclusion in grassland and savanna biomes is believed to be one of the driving forces of bush encroachment (cf. Chapter 1.1;

Scholes and Archer, 1997, Angassa et al., 2012) what may change ecosystem structure and functioning due to higher bush intensity (Eldridge et al., 2011).

Concisely, aboveground net primary production is one of the most important ecological currencies in

dryland ecosystems, reflecting the provision of forage production in these regions. Even though there

is a general consensus that ANPP is mainly shaped by precipitation, soil characteristics, nutrient supply

as well as grazing and fire (management; Scholes and Archer, 1997), it is unclear if response to these

drivers is rectified or even identical across large scales and if there are interactive effects between

these factors. Information and data we have thus far are mainly sites-based case studies. This

anecdotal data cannot easily be up-scaled. Furthermore, ANPP estimation methods and algorithms

vary vastly across studies and sites, what further hampers comparability.

(14)

General Introduction

14

1.2.3 Estimating Aboveground Net Primary Production

Today, ANPP is one of the best-documented estimates for dryland ecosystem services (Scurlock and Olson, 2002). However, representing a concept rather than a precise physical size, ANPP cannot be measured directly, but only be estimated based on surrogate measurements (Lauenroth et al., 2006).

Generally, ANPP estimation is a two-step process: first, biomass is estimated or measured (e.g. by volumetric equations or clipping, Figure 1.6); second, the gathered biomass values are translated or recalculated to ANPP estimates depending on the respective method (see Box 1.3). As biomass can be measured and estimated with relatively little error (e.g. clipping or calibrated volumetric equations;

Schulte, 2002), I will focus on the second step here.

Given the generality and importance of ANPP as ecosystem variable in terrestrial ecosystems, it is not surprising that many different estimation procedures and methods have been developed, which is particularly true for grass- or herb-dominated ecosystems (Scurlock et al., 2002, Singh et al., 1975, see Box 1.3). However, despite partial consensus about »best practice methods« (Scurlock et al., 2002), discussion on various methodological issues is still ongoing, and leads to coexistence of numerous ANPP estimation methods until today (see Box 1.3). Unfortunately, these different ANPP methods differ not only in their general accuracy, or in their tendency to over- or underestimate ANPP, but also with respect to magnitude, variability and uncertainty of ANPP estimates (Scurlock et al., 2002, Lauenroth et al., 2006). For instance, Scurlock et al. (2002) have shown that ANPP estimates at one site and date may vary up to more than 6-fold depending on the used method.

Hence, comparability of ANPP data across studies can be rather poor. Paradoxically, despite the large number of studies presenting ANPP data on field scale, this incomparability of methods de facto leads to a scarcity of ANPP data for data-integration studies. It is an urgent need to overcome these problems of incomparability and to harness the full potential of the globally available ANPP data in future studies.

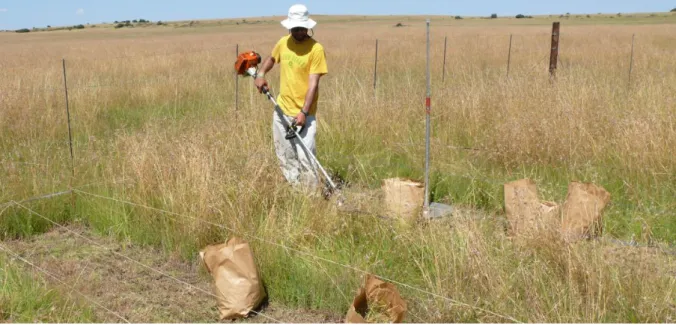
Figure 1.6: Biomass sampling via cutting for ANPP estimation in a grassland near Bloemfontein, South Africa, in 2010.

(15)

15

Box 1.3 – Common ANPP Estimation Methods

According to Scurlock et al. (2002) as well my as own literature review (Ruppert and Linstädter, 2014), the vast majority of studies presenting ANPP uses a pool of seven common methods. Roughly, these can be classified in (less-elaborated) peak- and (elaborated) incremental methods. As indicated by name, peak-methods use single biomass estimates during peak- season of biomass to estimate ANPP, while incremental-methods use several biomass estimates and (summed) increments thereof. Generally, there is a consensus that incremental-methods are best practice (i.e. Method 5), however, this is in sharp contrast to the actual utilization in literature: only 21% of studies used these elaborated methods (Ruppert and Linstädter, 2014). For illustration, Figure 1.7 visualizes what four selected ANPP methods quantify with respect to in-field biomass.

Table 1.1: The seven most common ANPP estimation methods in terrestrial (mostly herbaceous) ecosystems.

Figure 1.7: Illustrative scheme on four selected ANPP estimation methods, two peak- as well as two incremental methods.

The uppermost row represents in-field biomass situation and allocation of biomass age. Green: living plant material;

yellow: senescent, recently dead, material; dark-grey: moribund, last year’s dead material; and light-grey: plant biomass that is invisible for the respective method.

Method for ANPP estimation a

Description

Method 1 Peak live biomass

Method 2a b Peak standing crop (live plus recent dead) Method 2b b Peak standing crop (live plus recent and old dead)

Method 3 Maximum minus minimum live biomass

Method 4 Sum of positive increments in live biomass

Method 5 Sum of positive increments in live and recent dead (Smalley’s Method) Method 6 Sum of positive increments in live and total dead (recent plus old dead) Method 7 Sum of positive increments in live and dead biomass with an adjustment for

decomposition

a Nomenclature follows Scurlock et al. (2002).

b Differing from Scurlock et al. (2002) the »peak standing crop« method was split into two subgroups,

to account for actual observed (mis-) use in literature (cf. Chapter 2.2).

(16)

General Introduction

16

1.3 General Methodological Approach and Database

As described above, data on primary production (and related topics, e.g. dryland stability; see Chapter 1.1) in drylands, as well as insights in ecosystems functioning derived thereof, suffer from two general issues: (1) given the high spatiotemporal variability of dryland ecosystems, results from dryland studies are mostly anecdotal and cannot be easily up-scaled, what is hampering synthesis and functional insights. Furthermore, (2) the application of largely varying ANPP estimation methods leads to incomparability of results across studies.

Hence, even though there is an urgent need for an increased functional understanding of dryland ecosystems, especially in the light of global change (Reynolds et al., 2007), there is yet no obvious or easy to achieve strategy to satisfy it.

On a theoretical basis, there are at least two options to tackle the first issue: first, repeated mid- to large-scale long-term experiments, and second, synthesis of available knowledge and data. The first option is increasingly adapted in ecology via coordinated distributed experiments (CDE; Fraser et al., 2013). CDEs usually provide an experimental core protocol that is meant to be applied and repeated by as many scientist and sites as possible. The shared experimental layout assures comparability of results and eases joint analysis as well as spatial and temporal up-scaling of the results. NutNet (http://www.nutnet.umn.edu/) and FLUXNET (http://fluxnet.ornl.gov/) are among the best-known and most proliferate CDEs of the last decades. However, even though there are currently considerable efforts made in setting up dryland-related CDEs (e.g. Drought-Net; Smith et al., 2014, Smith pers.

comm.), it will take at least 5 to 10 years to obtain first reliable results. The second option – to synthesize available knowledge and data – can be performed in various ways. The most prominent and common approach are literature reviews (Baker, 2000). These have repeatedly given proof to be versatile tools for summarization of knowledge or as opportunities to achieve functional insights as well as impetus for new research directions or even research fields. However, at the same time they have the disadvantage of rendering merely qualitative and not quantitative results. During the last decades, a new type of data-synthesis has emerged across natural sciences: meta-analyses (Glass, 1976) or, more broadly speaking, data-fusion or -integration studies (Lenzerini, 2002).

Throughout this dissertation, I will follow the latter option and present results from a meta-analysis (Chapter 2.1: Ruppert et al., 2012), as well as from data-integration studies (Chapter 2.2: Ruppert and Linstädter, 2014, and Chapter 2.3: Ruppert et al., submitted) based on assembled large to global scale data sets of dryland ANPP.

The second issue – the incomparability of ANPP data across estimation methods – is particularly

assessed in the second paper underlying this dissertation (see Chapter 2.2). Here, the convertibility

(17)

17 between ANPP estimates derived from differing estimation methods was studied with the ultimate goal to establish reliable conversion models between the most common estimation methods.

The remaining sections of this introduction are meant to give a brief overview on the master database underlying the studies of this dissertation, as well as on data acquisition, handling and processing.

1.3.1 Data Acquisition, Handling and Processing

All studies underlying this dissertation (see Chapter 2) are based on different versions of a global ANPP database assembled between 2008 and late 2013, mostly in 2012. Most data sets derived from dryland ecosystems and only few from humid climate, the latter were added in the context of the second study (see Chapter 2.2) and were only used therein.

Data acquisition followed an exhaustive literature search using a comprehensive set of keywords (see Box 1.4) in Google Scholar, as this source gives more complete results compared to other systems (e.g.

Web of Science; Beckmann and von Wehrden, 2012). Furthermore, especially at a later stage, studies that were received via personnel communication were added. During all stages of data assemblage, the goal was to obtain an as large and unbiased database as possible. For this reason, also data from unpublished studies was added to avoid »publication bias« (Rothstein et al., 2006). However, other – ecologically motivated – criteria were used to select upon all potentially available studies. Most importantly, only studies with combined ANPP and precipitation data (or where precipitation data was available from other sources) and which at least presented five years of consecutive observations were further surveyed. The latter aspect was chosen to increase the probability to observe temporal variability in ANPP and precipitation data, which is typical for drylands. This criterion was only set aside for the second study (see Box 1.4).

Studies that were regarded as potential candidates were further screened to assess whether data presented in published sources was sufficient to be incorporated in the database, or if further information was needed. Most often, additional data on soil or management characteristics of the study site, or the biomass sampling technique, and/or used ANPP estimation method were required.

Roughly 10% of studies presented sufficient information. Hence, for the vast majority of studies, the

original authors were contacted at least once, and were presented with a detailed and mostly study-

specific questionnaire. Furthermore, whenever original authors were contacted, original biomass data

was requested rather than processed ANPP estimates as well as precipitation data for the longest

period available at the respective site. As this effort was surprisingly successful, meta-data for most

studies incorporated in the database are more detailed and comprehensive than related published

sources.

(18)

General Introduction

18

Box 1.4 – Data Search and Workflow

All data search was performed in Google Scholar. Specifically it was searched for the keywords biomass, standing crop, primary production, ANPP, dryland, hyper-arid, arid, semi-arid, dry sub-humid, monitoring and long-term in various combinations and spelling alterations. Furthermore, studies where biomass or ANPP derived from modeling or remote sensing were excluded to minimize measurement error, which is intrinsically associated with these techniques.

In those cases, where unpublished data was obtained via personnel communication, the original authors where granted co- authorship in the first publication using their data, if they were willing to contribute to the manuscript as well (see Chapter 2.1 and 2.3). This is common practice in meta-analytical studies (Helmut Hillebrand, pers. comm.).

Figure 1.8: Workflow for general data search, filtering and processing. Please note, that the literature search was repeated

occasionally between 2008 and late 2013, but mostly in 2012. This is also evident in the varying database sizes throughout

the three studies.

(19)

19 Once a data set was incorporated into the database, a series of data processing and handling steps followed. If original biomass data was available, ANPP was calculated using as many of the seven common ANPP estimation methods as possible (see Table 1.1; this was a prerequisite for Chapter 2.2).

Furthermore, wherever at least daily, weekly or monthly precipitation data was available three common precipitation sums were calculated: annual precipitation, precipitation of the hydrological year, and precipitation of the growing season for the respective site. Based on this data, the standardized precipitation index (SPI, McKee et al., 1993) was calculated. The SPI is an ecological sound and commonly used precipitation index for dryland environments (Vicente-Serrano et al., 2012). All mentioned calculations as well as the data storage was realized in a relational database (MySQL 5.0.95). Besides the mentioned calculations, data processing incorporated classification of all studies, or more precisely: the sites therein, with respect to climate- and vegetation-related systems (see Chapter 1.1). For example, the climate regime of the respective sites was classified using the aridity index based on the CGIAR/UNEP global-aridity map (Trabucco and Zomer, 2009). Furthermore, biome and ecoregions for all sites were classified using the WWF biome classification (Olson et al., 2001). Both classification-steps were realized in GIS (ArcMap 10).

Furthermore, various other meta-variables were obtained from related sources or original authors, such as dominant species in all strata (herb-, bush-, and tree-layer), dominant carbon-metabolism of the community (C3, C4), soil texture (together with sand-, silt-, clay-content), nutrient-status of the soil (C-, P-, N-content, C/N ratio), experimental and management treatment (ungrazed, grazed, prescribed burning, fertilized; if present) and intensity thereof (duration and frequency of treatment; e.g. stocking density or fire-return frequency). The following overview on the database, as well as the excerpts from it, given in Chapter 7, might convey a better impression of the actual database than all description that could have been added.

1.3.2 Database

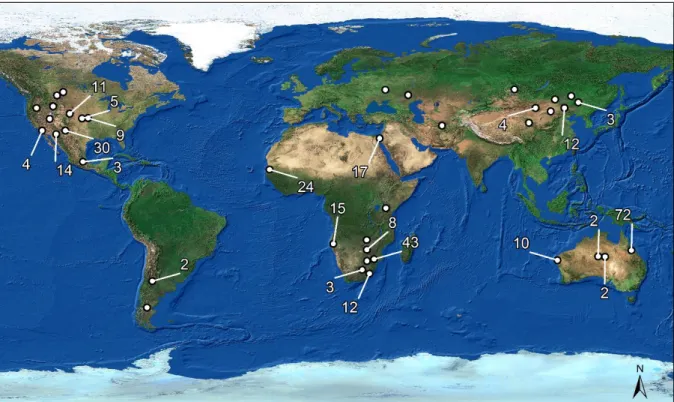
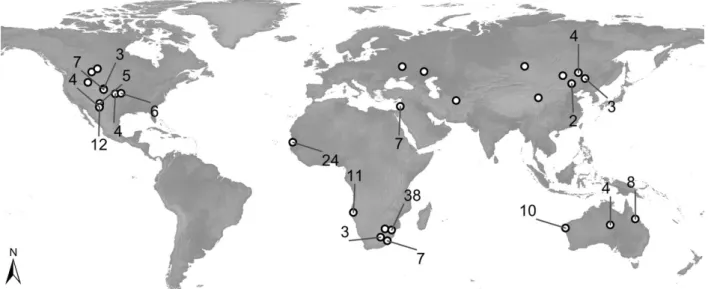
In March 2014 the assembled database comprised 322 distinct data sets (Figure 1.9) originating from 60 studies or institutions (e.g. experimental farms, see Table 1.2). In total, >4450 years of combined ANPP/precipitation observations were assembled, data on annual precipitation exceed 8550 years.

The average data set length was 14.3 years (max. 77 years). Studies came from arid (n = 54), semi-arid

(n = 239), dry sub-humid (n = 27) and humid (n = 2) regions and represented all broad dryland biomes

as defined in this thesis (see Box 1.1). Data for grasslands (n = 120) and savannas (n = 109) was more

abundant than that for shrublands (n = 53), roughly reflecting area-proportions of the respective

biomes (MEA, 2005).

(20)

General Introduction

20

Figure 1.9: Global map of assembled dryland database used in this dissertation. In total, 322 data sets derived from roughly 50 studies were assembled. Points indicate locations, numbers refer to data sets at certain locations if >1.

Some sites (n = 40) could not be classified to either of the broad biome classes, as they were subject to massive experimental impact (i.e. clear-cutting, plowing and/or sowing). If only architectural aspects of vegetation are considered, these sites appeared grassland-like, as they only comprised herbaceous vegetation.

1.4 Aims of this Dissertation

Generally, the aims of this thesis were twofold. One main aim was to improve our understanding of ecological functioning of drylands; the second was to overcome intrinsic difficulties in data-integration approaches.

Assembling a global dryland ANPP database was originally motivated by the necessity to have a basis for a functional and quantitative assessment of the relationships between primary production and its drivers – particularly above the level of case studies. This strategy promised to render more general insights than case studies, as temporal and spatial constrains are eased. Furthermore, sufficient amounts of data, specifically long-term data sets, should allow studying impacts of rare extreme events, such as drought, on ecosystems functioning. In this respect, the functional responses of dryland primary production to climatic shocks (i.e. drought) or changes in land use (i.e. grazing) are of particular interest given the above described global change projections for drylands.

The second aim emerged during an early stage of data assemblage, when it became evident that

different studies used largely varying ANPP estimation methods and were thus incomparable: How

should one cope with partial incomparability between estimates of primary production?

(21)

21 In Chapter 2.1 an early version of the global ANPP dataset is used to assess global validity of the above- mentioned biotic and abiotic divers of ANPP and rain-use efficiency. Furthermore, it is tested whether the concurring results on the shape of ANPP-precipitation relationship in literature can be reconciled.

Chapter 2.2 studies the recent use of the most common ANPP estimation methods and tries to make

a way out of the »comparability dilemma« between ANPP estimates derived by different estimation

methods. Finally, Chapter 2.3 tests drylands’ response to the most common realizations of global

change in these regions: i.e. altered drought and grazing regimes. Responses in two aspects connected

to ecosystem stability (i.e. ANPP-based resistance and recovery) should allow deduction of general

recommendations for land managers as well as insights for ecosystem modelers.

(22)

General Introduction

22

(23)

23

(24)

General Introduction

24

(25)

25

2. Publications of the Dissertation

2.1 Meta-Analysis of ANPP and Rain-Use Efficiency confirms indicative value for Degradation and Supports non-linear Response along Precipitation Gradients in Drylands

2.2 Convergence between ANPP Estimation Methods in Grasslands – A practical Solution to the Comparability Dilemma

2.3 Quantifying Dryland Resistance and Resilience to Drought: The Importance of

Drought Intensity, Grazing Regime and Vegetation Structure

(26)

Publication: Meta-Analysis on ANPP and RUE in Drylands

26

2.1 Meta-Analysis of ANPP and Rain-Use Efficiency confirms indicative value for Degradation and Supports non-linear Response along Precipitation Gradients in Drylands

Jan C. Ruppert, Alexander Holm, Sabine Miehe, Esteban Muldavin, Hennie A.

Snyman, Karsten Wesche & Anja Linstädter (2012), Journal of Vegetation Science

23: 1035-1050, DOI: 10.1111/j.1654-1103.2012.01420.x

(27)

27

(28)

Publication: Meta-Analysis on ANPP and RUE in Drylands

28

(29)

29

(30)

Publication: Meta-Analysis on ANPP and RUE in Drylands

30

(31)

31

(32)

Publication: Meta-Analysis on ANPP and RUE in Drylands

32

(33)

33

(34)

Publication: Meta-Analysis on ANPP and RUE in Drylands

34

(35)

35

(36)

Publication: Meta-Analysis on ANPP and RUE in Drylands

36

(37)

37

(38)

Publication: Meta-Analysis on ANPP and RUE in Drylands

38

(39)

39

(40)

Publication: Meta-Analysis on ANPP and RUE in Drylands

40

(41)

41

(42)

Publication: Meta-Analysis on ANPP and RUE in Drylands

42

(43)

43

Appendix S1: Established conversions for different livestock indices to tropical livestock unit (TLU)

Bodyweight based assignment of tropical livestock units. Reference for 1 TLU is a ruminant with a bodyweight of 250 kg (e.g. cattle).

Bodyweight [kg] TLU

30 0.20

35 0.23

40 0.25

45 0.28

50 0.30

60 0.34

75 0.41

100 0.50

125 0.59

150 0.68

200 0.85

250 1.00

300 1.15

350 1.29

400 1.42

450 1.55

500 1.68

Conversion of large stock units (LSU) into tropical livestock units (TLU)

LSU is the equivalent of the TLU for moderately tempered climatic zones. Since larger animals can be found in these climatic zones, the units differ only in the weight of the reference animal. While 1 LSU equals one adult cattle with a weight of 500 kg, 1 TLU equals one adult cattle with the weight of 250 kg. Therefore the conversion followed the formula: 1 LSU = 2 TLU.

Applied for O’Connor et al. 2001.

Conversion of dry sheep equivalent (DSE) into tropical livestock units (TLU)

1 DSE accords to the feed consumed by a two year old 45 to 50 kg sheep or the (consumed) energy of

7600 kilojoule per day. Following the allocation of TLU values by body weight (see Table above) one

adult sheep with a weight 45 to 50 kg equals a TLU value of 0,28 to 0,30. For the conversion the mean

of both values was chosen. Therefore the conversion followed the formula: 1 DSE = 0,29 TLU. Applied

for Holm et al. 2003.

(44)

Publication: Meta-Analysis on ANPP and RUE in Drylands

44 Conversion of Mongolian sheep unit (MSU) into tropical livestock units (TLU)

1 MSU accords to the feed consumed by one sheep per day and should therefore be about 1 kg dry matter per day and year [1 kg DM * d-1 * y-1]. Ruminants consume about 3% of their own body-weight per day (Ulgiit & Stewart 2006), therefore 7.5 MSU equal 1 TLU, since 7.5 kg are 3% of 250 kg.

Applied for Wesche & Retzer 2005. The calculated TLU values were checked and accepted by the authors.

References

Holm,A.M., Watson,I.W., Loneragan,W.A. & Adams,M.A. 2003. Influence of loss of patch-scale heterogeneity on primary productivity and rainfall-use efficiency in the arid shrubland of Western Australia. Basic and Applied Ecology 4: 569-578.

O’Connor,T.G., Haines,L.M. & Snyman,H.A. 2001. Influence of precipitation and species composition on phytomass of a semi-arid African grassland. Journal of Ecology 89: 850-860.

Ulgiit,E. & Stewart,T. 2006. The Mongolian Farm Management Notebook. 1st ed.

Wesche,K. & Retzer,V. 2005. Is degradation a major problem in semi-desert environments of the Gobi

region in southern Mongolia? In: Retzer, V., Wesche, K., Samiya, R., Stubbe, A., Miehe, G.,

Stubbe, M. (eds.) Erforschung Biologischer Ressourcen der Mongolei, pp. 133-146. Martin-

Luther-University, Halle-Wittenberg.

(45)

45

Appendix S2: Why efficiencies should not be analyzed by linear regressions

Verón et al. (2005) point out that utilization efficiencies (UE, e.g. the rain-use efficiency) express the amount of output (y, for RUE: the RUE values) for a given input (x, for RUE: the annual precipitation) and in mathematical terms are of the type y/x or UE = a/x + b. Therefore theory predicts non-linear response of RUE along short precipitation gradients. With increasing gradient length, this relationship approaches linearity, as has been found in many studies (e.g. Lauenroth & Sala 1992, Huxman et al.

2005).

References

Huxman,T., Smith,M.D., Fay,P.A., Knapp,A.K., Shaw,R.M., Loik,M.E., Smith,S.D., Tissue,D.T., Zak,J.C., Weltzin,J.F., Pockmann,W.T., Sala,O.E., Haddad,B.M., Harte,J., Koch,G.W., Schwinning,S., Small,E.E. & Williams,D.G. 2004. Convergence across biomes to a common rain-use efficiency.

Nature 429: 651-654.

Lauenroth,W.K. & Sala,O.E. 1992. Long-term forage production of North American shortgrass steppe.

Ecological Applications 2: 397-403.

Verón,S.R., Oesterheld,M., Paruelo,J.M. 2005. Production as a function of resource availability: Slopes

and efficiencies are different. Journal of Vegetation Science 16: 351-354.

(46)

Publication: Meta-Analysis on ANPP and RUE in Drylands – Supporting Information – Table S1

46

(47)

47

(48)

Publication: Meta-Analysis on ANPP and RUE in Drylands – Supporting Information – Table S3

48

(49)

49

(50)

Publication: Meta-Analysis on ANPP and RUE in Drylands – Supporting Information – Table S5

50

(51)

51

2.2 Convergence between ANPP Estimation Methods in Grasslands – A practical Solution to the Comparability Dilemma

Jan C. Ruppert & Anja Linstädter (2014), Ecological Indicators 36: 524-

531, DOI: 10.1016/j.ecolind.2013.09.008

(52)

Publication: Convergence between ANPP Estimation Methods

52

Convergence between ANPP estimation methods in grasslands – A practical solution to the comparability dilemma

Jan C. Ruppert a,b , Anja Linstädter a

a Range Ecology and Range Management Group, Botanical Institute, University of Cologne, Zülpicher Straße 47b, D-50674 Cologne, Germany

b Crop Science Group, INRES, University Bonn, Katzenburgweg 5, D-53115 Bonn, Germany Corresponding author:

Jan Christian Ruppert

Range Ecology and Management

Botanical Institute, University of Cologne Cologne Biocenter

Zülpicher Straße 47b D-50674 Cologne, Germany Email: jan.ruppert@uni-koeln.de Tel.: +49 (0) 221 - 470 7906

Keywords: Aboveground net primary production, Grasslands, Global ANPP dataset, ANPP estimation, Ecosystem services

Abbreviations: (A)NPP – (Aboveground) Net Primary Production, ORNL DAAC – Oak Ridge National Laboratory Distributed Active Archive Center

NOTICE: This is the author’s version of a work that was accepted for publication in Ecological Indicators.

Changes resulting from the publishing process, such as peer review, editing, corrections, structural formatting, and other quality control mechanisms may not be reflected in this document. Changes may have been made to this work since it was submitted for publication. A definitive version was subsequently published in:

Ecological Indicators 36: 524-531, http://dx.doi.org/10.1016/j.ecolind.2013.09.008

(53)

53

Abstract

Aboveground net primary production (ANPP) is a key ecosystem characteristic and of fundamental importance for essentially all aspects of matter and energy fluxes in terrestrial ecosystems. Various methods for estimating ANPP are available and despite partial consensus on ‘best practice methods’

important methodological issues remain unresolved: ANPP data obtained with different methods differ in their magnitude, variability and their tendency to over- or underestimate primary production.

Paradoxically, despite the large number of published ANPP data, the limited comparability of ANPP estimates across studies leads de facto to a scarcity of ANPP data for assembled large-scale studies.

We aimed to overcome these problems by establishing conversion rates between the most commonly used ANPP methods, thus making the large body of published ANPP data more comparable and thus useful for assembled large-scale studies.

Using seasonal biomass dynamics from 89 sites representing various biomes and climata, we established linear conversions for all 21 combinations between the seven most common ANPP estimation algorithms in grass-dominated vegetation. We also checked for confounding effects of environmental factors such as biome, management and climatic aridity. Aridity was the only factor with a clear influence on ANPP conversions, and in six cases we thus calculated separate relationships for dry and humid conditions. In these cases, dryland ANPP was systematically underestimated by the respective methods. As these methods are insensitive to turn-over processes from live to senescent biomass, we assume this underestimation is related to climate-induced differences in biomass turn- over rates, with more arid sites having higher rates.

The majority of the resulting 27 conversions had high (pseudo) R 2 values (≥ 0.65; full range: 0.31 - 0.92), indicating clear linear relationships between most ANPP estimation methods. Given the large size of the dataset and the accuracy of statistical models, we assume that most conversion formulae are generally valid. We classified conversions with respect to their R 2 values and their methodological comparability, and concluded that 16 conversions can be fully recommended. For those cases where a recalculation of ANPP on basis of original biomass data is not possible, our conversion formulae offer an easy and practical approach to synchronize ANPP estimates from divergent algorithms and sources.

1. Introduction

Aboveground net primary production (ANPP) is a key ecosystem characteristic and of fundamental

importance for essentially all aspects of matter and energy fluxes in terrestrial ecosystems. It is a

prominent core ecological currency and one of the best documented quantitative estimate for several

ecosystem services such as forage or lumber (Scurlock et al., 2002). However, as it represents a concept

(54)

Publication: Convergence between ANPP Estimation Methods

54 rather than a precise physical quantity or attribute, ANPP can only be estimated by surrogate measurements and not measured directly (Lauenroth et al., 2006).

Many different procedures and methods for estimating ANPP have been developed. Particularly in grass-dominated ecosystems, a wide variety of different estimation protocols have been developed within recent decades. The most common methods to estimate ANPP (hereafter simply ‘ANPP methods’) have been thoroughly evaluated and compared in literature (Lauenroth et al., 2006;

McNaughton et al., 1996; Milner and Hughes, 1968; Sala and Austin, 2000; Scurlock et al., 2002; Singh et al., 1975). However, despite a partial consensus on ‘best practice methods’, discussion regarding various methodological issues is still ongoing, and as a result, numerous ANPP estimation methods are in use and compete up until today. Generally, ANPP methods can be sub-divided into complex elaborated methods and simple, less elaborated ones. Elaborated methods, which account for dynamics in live, senescent, and moribund tissue simultaneously throughout the growing season, have often been recommended (Singh et al., 1975; Scurlock et al., 2002). However, these methods are far more labor-intense and costly than other ‘simple’ estimations (e.g. Peak standing crop, or Peak live biomass) which have a tendency to underestimate production. Unsurprisingly, less elaborate methods are far more often applied, as they are faster and cheaper. Unfortunately, different ANPP methods differ not only in their general accuracy (i.e. their tendency to over- or underestimate ANPP), but also with respect to magnitude, variability and uncertainty (Scurlock et al., 2002; Lauenroth et al., 2006).

These differences render estimates based on different methods more or less incomparable. Scurlock et al. (2002) have shown that ANPP estimates at one site and date may vary up to more than 6-fold depending on the computational method used. Examples from our own dataset show even more extreme differences of up to 10- to 15-fold in certain cases (data not shown).

In the past, simple methods like Peak standing crop were sufficient for common questions in vegetation and rangeland ecology. They give robust estimates which are sufficient for determining carrying capacity, assessing the influence of climatic characteristics, or comparing the effects of contrasting management strategies at local scale (e.g. Blaisdell, 1958; Dye and Spear, 1982; Smoliak, 1986). However, in recent years there is a growing demand for both more accurate and better comparable ANPP data across larger scales. In fact the lack of large-scale ANPP data has been stated as one of the most crucial data gaps in ecology in recent times (Ni, 2004; Scurlock et al., 2002; Scurlock and Olson, 2002). Paradoxically, despite the large number of studies presenting ANPP data on field and site scale, the limited comparability of ANPP data across sites, regions and studies de facto leads to a scarcity of ANPP data for supra-regional or large-scale studies.

In the light of the climate and land-use change debate, the need for reliable and adequately scaled

large-scale and global ANPP datasets is urgent, as each of cross-system analyses, meta-analyses, as

well as land-use, climate and vegetation models imminently require them. Since adequate biomass

(55)

55 and ANPP monitoring is not only time consuming but also costly, numerous scientists rely on assembling ANPP datasets from published data (Hsu et al., 2012; Lauenroth and Sala, 1992; Ni, 2004;

Ruppert et al., 2012). However, due to differences between ANPP estimation methods, this pragmatic solution is not without its pitfalls. Surprisingly, only a small proportion of studies discuss the issue of comparability of ANPP data assembled from various sources, and based on different estimation and/or computation methods (see 3.1 Results). To date, authors of large-scale studies and meta-analyses either had to neglect major proportions of published data for the sake of comparability or accept the limited and unknown comparability, a true ‘comparability dilemma’.

Still, little is known about the incidence and frequency of ANPP comparability issues in assembled datasets.

Being confronted with this comparability dilemma ourselves (Ruppert et al., 2012; Ruppert et al. in prep.), we aimed to overcome these problems by searching for conversions rates between common ANPP methods. We found that Singh et al. (1975) presented conversions for a set of different ANPP method combinations, developed on the basis of ten short-term datasets form North American grasslands. Surprisingly, practically no use was made of these conversions thereafter. A review (see 2.1 Materials and methods) of all 165 studies citing Singh et al. (source: Google Scholar) revealed that only two studies used the conversions, both by authors of the original paper (Lauenroth and Whitman, 1977; Singh et al., 1983). This poor adoption may be explained by various reasons including: (1) the paper was largely a detailed review, and the conversions were not mentioned in the abstract limiting their visibility; (2) the strong interest in large and global scale ANPP datasets was not as virulent in the 1970s as it is today; and (3) perhaps most critically, the study was based on a restricted dataset and did not test whether conversions were applicable to data from other regions or ecosystems.

We believe that the attempt by Singh et al. (1975) was simply ahead of its time and that it offers a starting point to assess the comparability for future assembled studies. However, the problems and shortcomings of Singh’s study, as mentioned under point (3) above, can be overcome by using a large global dataset allowing a more systematic assessment of the comparability of the most common ANPP methods. This is the scope of the present study.

We aim to establish simple conversion formulae between the most common ANPP estimation methods

for grass-dominated vegetation. Our study is based on data from 89 sites with more than 850 years of

biomass data.

Abbildung

Figure 1.1: Overview on worlds’ broad climate regimes as defined by the United Nations Environment Programme (UNEP)  aridity index
Figure 1.2: Examples of the four dryland biomes. (A) Gobi Desert in Mongolia, (B) Themeda triandra grassland in South  Africa, (C) Creosote shrubland in New Mexico, USA, and (D) Acacia savanna in the Kalahari, South Africa
Figure  1.3:  Maps  of  projected  late  21st  century  annual  mean  surface  temperature  change  (A)  and  annual  mean  precipitation change (B)
Figure  1.4:  Effects  of  (over-)  grazing  in  drylands.  (A)  »Piosphere«  (i.e.  the  degraded  area  around  an  attraction  loci  for  animals; Andrew, 1988) in a communal grazing land
+7

Referenzen

ÄHNLICHE DOKUMENTE

The goal of this study is to quantitatively estimate the seasonal course of daily gross primary production (GPP) of crops with the model PIXGRO, achieving critical parameterization

It’s easy to understand New Delhi’s reluctance to support security‑focused institution building in the IOR that it can’t control. The strategic architecture in the IOR is very

For catch-bonds, bond lifetimes are initially increased to a certain threshold (orange). Catch-bonds are accompanied by a change in binding site conformations. Two

At the same time, as mobile internet becomes available and affordable, the mobile device can play as personal access point to private and shared data, as well as applications, which

A production method, that ensures good pollen quality is described, as well as the main quality criteria, that can be included in a future standard.. There are

Luminance uniformity, uniformity of reflectance, uniformity of luminous flux, contrast uniformity or colour uniformity depends on the technology (use of the equipment) as well as

We outline a methodology of a full and verified carbon account of terrestrial ecosystems (FCA) that supposes unbiased assessment of relevant proxy values (here: Net Ecosystem

For each species the following informations are provided in German and English: taxonomy (species name, author, quotation of the original description, in some cases