Vol. 5, No. 2, December 2009 ISSN: 1861-3675
Studies Studies
www.sti-studies.de
Technology Adoption in Small-Scale Agriculture: The Case of Cameroon and Ghana
Genesis T. Yengoh (Lund University, Sweden)
Armah Frederick Ato (University of Cape Coast, Ghana) Mats G. E. Svensson (Lund University, Sweden)
received 5 Sept. 2009, received in revised form 21 Dec. 2009, accepted 20 Jan. 2010
Abstract
This study explores one of the most important questions for alleviating poverty in sub-Saharan Africa, why are advancements in agricultural technology not taking root in this region? Using data from deep interviews of 42 small-scale farmers in Ghana and Cameroon, a conceptual analysis of drivers and factors of agricultural technology adoption in this region is made and represented as causal loop diagrams.
Interviews also provide a basis for weighting factors that farmers consider before
adopting a new technology. These weights are then used to run a system dynamics
model with a hypothetical population of 10.000 farmers to see the effects of different
drivers of technology adoption on the adoption rate and number of adopters over a
25 year period. Results show that most farmers have a bet-hedging strategy as they
try to minimize risks of production failures. While certain factors like scale of pro-
duction, long-term considerations, the history of success of past technologies, and
the endorsement of technologies by opinion leaders may be important, many other
factors do influence decisions to adopt new technologies. This limits any silver bullet
strategy towards solving the problem of limited diffusion of agricultural technologies
in this region. Addressing such a problem therefore calls for a much more holistic
approach.
1 Introduction
Small-scale farming forms the back- bone of agricultural production in sub- Saharan Africa. Historically, productiv- ity of small-scale farming systems has been plagued by a number of structural and policy issues that have led to slow increases in yields and even stagnation in some parts and for some crops. The absence of technology, limited access to or the use of inappropriate technology are among some of the factors blamed for food deficiency in many parts of the developing world (von Braun et al.
2007; McCalla 1999). It seems to be taken for granted that with the right technology in place (better seeds, fer- tilizers, tools, techniques, and others), agricultural production will routinely be increased and challenges of food secu- rity overcome in areas with some phys- ical and social limitations to food pro- duction. Such assumptions are based on the expectation that if there is a so- lution to a problem, then it is rational that people who know of the existence of such a solution, have access to it, and are facing problems for which the so- lution is appropriate will use it to find a way out of their problem (Beckford 2002).
International agencies, national gov- ernments, regional authorities and lo- cal concerned groups do attempt at dif- ferent scales to make agriculture more productive and profitable by introducing technologies to meet or reduce some of the constraints of farm production.
These constraints include soil erosion, depleted soil nutrients, low quality of seeds, over-grazing, the use of rudi- mentary farming tools and techniques, among others. The outcome of these ef- forts has largely been modest (Ahmed 2004). Some of the basic technolo- gies have not yet reached many of the farmers of this region, especially those of small-scale production (Gallup et al.
2000). Where outside extension agents have introduced new technologies, ini- tial adoption rates have been low and the low adoption rates have largely failed to spread spontaneously beyond the communities into which such intro-
duction is made (Moser et al. 2006). In areas where some of these technologies exist, the adoption rate has been very low and hence their spread has been limited and their intended benefits un- achieved (Lado 1998).
Improving agricultural productivity in the developing world in general and sub-Saharan Africa in particular has be- come an urgent need, dictated by pop- ulation growth, uncertainty in global food markets, changing consumption patterns of food commodities, as well as the desire to meet important milestones in food and nutrition in the region such as those of the millennium development goals. There is the desire of achieving this improvement in productivity while facing up to the contemporary chal- lenges of global environmental change:
global warming, land degradation, wa- ter pollution and scarcity, and biodi- versity loss (World Bank 2007; McCalla 2001; Blackman 1999). Properly tailored incentives and policies will be needed to ensure that future efforts to increase agricultural productivity do not com- promise environmental integrity, public health, and the ability for future gen- erations not to be over-burned by our present day actions (Tilman et al. 2002).
Access to and the use of appropriate technologies may be one of the tools needed to meet these production chal- lenges in sub-Saharan Africa (McCalla 2001).
2 Study Objectives
While technology is constantly being developed at almost all levels of the food production, distribution and retail chains, the need to provide small-scale agriculturalists (especially in develop- ing countries confronted with problems of food deficiency) with basic appro- priate technology needed to improve their production capacity seems to be overwhelmingly supported (World Bank 2007; Pinstrup-Andersen et al. 1998;
McCalla 1999). Understanding the fac-
tors that influence the adoption or non-
adoption of technologies at the produc-
tion end of small-scale agriculture can
therefore have important implications in the planning of technology-related projects for meeting the challenges of food production for this category of pro- ducers.
This study aims to explore some of the insights of the process of decision- making by some of the most impor- tant but vulnerable group of agricul- tural producers in the world - small- scale farmers in Sub-Saharan Africa (World Bank 2007). Using tools of sys- tems dynamics (causal loop diagrams (CLD)
1and quantitative modeling) the study seeks to understand the process of decision-making from a more holis- tic perspective. Insights into the pro- cess of decision-making may provide clues to the long-standing question of why technology-related assistance has in many cases failed to take root in this part of the developing world (Ahmed 2004).
3 The baseline model and its shortcomings
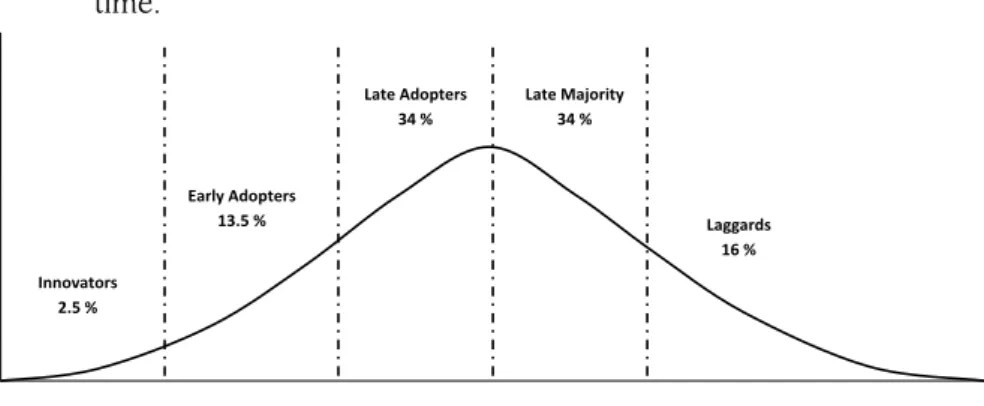
Technology adoption has been investi- gated by a number of diffusion of inno- vation theories. The most influential has been by Rogers (1995) who framed the adoption of innovation as a life-cycle made of five categories of adopters: in- novators (brave people ready to take risks and try out new things), early adopters (opinion leaders who are ready to try out new things but exercise a bit more caution than the innovators), early majority (people who are care- ful but ready to accept change more quickly than the average), late major- ity (skeptical people who will use new
1 A characteristic causal-loop (influence or cause-effect) diagram is used to define posi- tive and negative causal links (or influences).
Positive (+) and negative (-) polarities are used to define the nature of influence from one factor to another. Ahas a positive in- fluence or effect onBifAadds toB, or if a change inAresults in a change inBin the same direction. In the same light, Ahas a negative influence or effect on B ifA sub- tracts fromB, or if a change inAresults in a change inBin the opposite direction.
ideas or products only when the ma- jority is using it), and laggards (tradi- tional and conservative people, slow to change and critical towards new ideas, will only accept or use them if the new ideas have become mainstream or even tradition) (see Figure 2).
This theory (like the Bass diffusion model (Bass, 1969)) sees technology spread as the outcome of two main fac- tors: innovation which refers to the de- sire of people to try out new technolo- gies, and imitation which refers to the influence of those that have tried out a technology in drawing in others who have not yet tried this technology to try- ing and using it. The innovation adop- tion curve developed by Rogers (1995) therefore seems to suggest that trying to quickly and massively convince the bulk of people of a new idea or product is useless. It takes time for innovation to diffuse through a society and it makes better sense to start with convincing in- novators and early adopters first before expecting other groups of adopters to follow suit.
3.1 Interaction between Actual and Potential Adopters: the Bass Diffusion Model
A well tested theory of the diffusion of technology is the Bass diffusion model (Bass 1969). This model sees the adop- tion of new products as an interac- tion between a population of would-be users (potential adopters) and the pop- ulation currently using the product (ac- tual adopters). Mathematically, the Bass diffusion model is represented as:
Equation 1:
) ( )
( 1 1 1
1 − −
−
+ + − + −
= t t t t
t m N
m qN N m p N N
Where
Ntis the number of adopters at
time t;
mis the market potential (po-
tential adopters) or the total number
of people who may eventually use the
product;
pis the coefficient of innova-
tion (external influence) or the proba-
bility that someone who is not yet us-
ing the product will begin using it be-
cause of advertisement;
qis the coeffi-
cient of imitation (internal influence) or
the probability that someone who is not yet using the product will start using it because of "word-of-mouth" or person- to-person communication.
It is generally assumed that the timing of the first time purchases is somewhat distributed over the general population (meaning the role of the innovators and early adopters is very important in de- termining the speed of the adoption pro- cess and hence the time the innova- tion adoption cycle will run). Hence the diffusion rate at time
tis generally ex- pressed as (Sultan et al. 1990):
Equation 2:
[
* ()]
) ) (
( gt N N t
dt t
dN = −
Where dN(t)/dt is the rate of diffusion at time t,
N(t)is the cumulative number of adopters at time t, N* is the total number of potential adopters in the population, and g(t) the probability of adoption for individuals who have not yet adopted.
3.2 Test-runs with the baseline model
The baseline model of technology adop- tion assumes no constraints of purchas- ing power, willingness to pay, access to information, and access to the new technology. The main factors driving adoption are the roles of advertisement and the word-of-mouth. These factors are illustrated in the causal loop dia- gram of the baseline conceptual model of technology diffusion (Figure 2). It is basically the translation of the Bass
model into stocks, flows and feedback loops carried out by Sterman (2000).
The role of advertisement and word- of-mouth in influencing adoption rate is determined by the effectiveness of advertisement and contact rate respec- tively (loop R1). The degree to which these two factors will determine adop- tion rate is however limited by the popu- lation of potential adopters (loop B1 and B2)
Figure 2: A causal loop diagram of the baseline model of technology adoption that takes into account the roles of advertisement and spread by word-of-mouth
Adoption From Word of Mouth
Adoption from Advertisement Adoption
Rate
Actual Adopters
Potential Adopters
Effectiveness of Advertisement Total
Population Adoption
Fraction Contact
Rate
+
+
+ +
- +
+ +
+
+ + R1
B2 B1
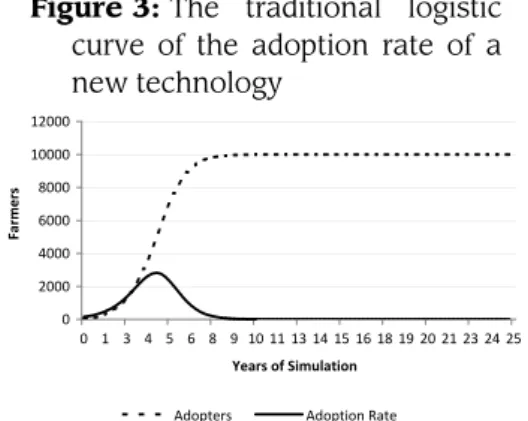
Using a hypothetical farming popula- tion of 10.000 (constituting the popu- lation of potential adopters), the initial model is run for 25 years with Euler’s integration method. The model repli- cates the role of the influence of inter- nal (word-of-mouth), and external (ad-
Figure 1: Rogers’ adoption/innovation cycle showing the distribu- tion of different categories of adopters of a new technology over time.
Innovators
2.5 %
Early Adopters 13.5 %
Late Adopters 34 %
Late Majority 34 %
Laggards 16 %
Time
vertisement) factors on the diffusion of new technologies are based on Equa- tion 1 (Figure 3).
Figure 3: The traditional logistic curve of the adoption rate of a new technology
0 2000 4000 6000 8000 10000 12000
0 1 3 4 5 6 8 9 10 11 13 14 15 16 18 19 20 21 23 24 25 Years of Simulation
Farmers
Adopters Adoption Rate
The conceptual models represented as causal loop diagrams (CLDs, see Fig- ure 6-13 in Chapter 4) and the weights attributed to these factors in influenc- ing technology adoption (Table 1) are used to further develop the baseline model that characterizes the system of decision-making in the case studies.
3.3 The Importance of Internal and External Influences
Different studies have established dif- ferent levels of importance on the role of internal and external factors (q = the coefficient of imitation, and
p= the coef- ficient of innovation respectively in the Bass diffusion formula above) in influ- encing the process of innovation adop- tion. Mansfield (1961) sees the role of internal influence (personal commu- nication through word-of-mouth, per- sonal recommendations, and experi- ences of others using and being suc- cessful with an innovation) more im- portant in determining the rate of dif- fusion of innovation. Hence g(t)=qF(t), where
qF(t)is the coefficient of person- to-person (internal or word-of-mouth) influence - a function of the number of previous adopters which increase with time.
Fourt and Woodlock (1960) on the other hand, believe that the roles of external influences (advertisement, mass media, and other forms of outreach that enable
potential users to be influenced by imi- tation to adopt an innovation) are more important in driving the diffusion pro- cess. The model g(t)=p is suggested to explain the singular role of external fac- tors in influencing the technology diffu- sion process. Here, p signifies the coef- ficient of external influence (i.e. the role of mass media and other forms of ad- vertisement).
Diffusion of technological change over a population of potential adopters is of- ten characterized by two well-known facts (Cabe 1991): the length of time required by the diffusion is often sig- nificant and the time often varies con- siderably among innovations. More- over, threshold effects are also impor- tant, where drastic changes can happen when a threshold is passed. One exam- ple of such a technology spread within the agricultural sector is drip irrigation (Fichelson et al. 1989).
4 Methods to improve the baseline model
4.1 Additional factors
Several factors have been advanced as
determinants of the adoption and diffu-
sion of technology among small-scale
farmers in developing countries. Earlier
research established the importance of
access to financial resources for invest-
ment and size of farm holdings (Feder
1980; Feder et al. 1985; Sunding et
al. 2001; Lee 2005). More recently, re-
search has also identified the role of
learning in the diffusion of pineapple
production technology in Ghana (Con-
ley et al. 2003), and the role of social
networks on hybrid seed adoption in
India (Matuschke et al. 2009). In de-
veloping conceptual models for individ-
ual determinants of technology adop-
tion and diffusion in the case studies,
farmers are asked to identify factors that
would make them adopt a new technol-
ogy introduced through normal chan-
nels of technology introduction in the
communities (using field agents of tech-
nology production companies, agricul-
tural extension workers, farmers’ so-
cial networks). Through further discus-
sions, drivers of these factors are identi- fied and presented as cause-effect rela- tionships in causal loop diagrams of in- dividual sub-systems.
4.2 Interviews with farmers
The study develops a theoretical un- derstanding of the system of decision- making with regards to agricultural technology adoption through a review of literature and field observations. A total of 42 small-scale farmers were questioned in open interviews: 12 in the Western High Plateau Region of Cameroon and 30 in the Asebu Kwa- mankese District of the Central Region of Ghana. The farmers were asked questions with reference to technol- ogy adoption between 1990 and 2009.
These questions were related to the adoption of improved seeds, inorganic fertilizers, pesticides, and farm tractors (technologies that have been introduced in these communities over the last 19 years).
Farmers were selected based on a num- ber of factors. Leaders of local com- munity groups helped identify respon- dents who must have resided in their re- spective communities for over 15 years during which time they must have been practicing farming. They must be prac- ticing farming at a small-scale. The term “small-scale” used in this study is in line with the definition given by Beck- ford (2002) which describes such farm- ing as being labor-intensive and char- acterized by a high degree of fragmen- tation, low resource base, and mixed cropping. For the purpose of this study, the definition further restricted inter- viewees to individuals with farm hold- ings of less than two hectares dedicated mainly to the production of food crops.
Even though the study intended to up- hold a balanced gender representation, women proved to be more co-operative and available for interviews than men and hence we had more women re- spondents (24) than men (18). Respon- dents were aged between 35 - 65 years and included people who owned their own farms as well as those who were
renting farm plots. Results of the inter- views were used to develop a general conceptual framework of the system of decision-making concerning agricul- tural technology adoption in these re- gions.
Using an example of the new maize seeds that were introduced in both study regions in the early 1990s, farm- ers are brought in to discuss the impor- tance of different factors to their mo- tivations for adopting or not adopting these seeds. These were seeds de- veloped by PANNAR, a South African seed producing company based in the KwaZulu-Natal Midlands. They were high yielding maize seeds that began entering markets in Central and West Africa in the early 1990s. An initial enthusiasm for high yielding cultivars prompted a great deal of trials by many small-scale farmers. This enthusiasm quickly died less than five years later due to a number of reasons. Small- scale farmers who produce primarily to feed their households complained that the maize produce from these seeds did not have the taste of maize they have been familiar with. Farmers also com- plained that the produce was difficult to manage – the cobs grew longer than the ears, exposing the maize grains to ele- ments of weather. As a result, the maize grains became soaked by rain soon after maturation and rotted or molded on the farms before they could be harvested.
Lastly, farmers observed that replant- ing PANNAR maize from previous har- vests as they had been doing with tra- ditional varieties did not produce good harvests. They had to continuously buy new seeds from the seed distributors every planting season. For households who cultivated mainly for consumption, they needed to be able to raise money for these purchases which was not with- out problem for many.
4.3 Factors identified by interviewees
Farmers identify eight main factors as
being important when they make the
decision on either to adopt or not to
adopt a technology (Figure 4). These factors are:
1. Ability to pay which refers to farmers’
capability of paying for and owning or using the newly introduced tech- nology. This depends on farmers’
level of income, access to credit, and other sources of financing for agri- cultural activities.
2. Vulnerability refers to the susceptibil- ity of farmers to adverse conditions that may result from using a new technology or from deviating from their usual agricultural practice. This susceptibility may reduce the farm- ers’ ability to turn out the produce they have been relying on for their sustenance. There is therefore some threat of production failure (risk) in- volved in adopting a new technol- ogy.
3. Scale of production refers here to farmers’ range of production possi- bility. One can distinguish between the physical range of this possibil- ity which will be how much land the farmer actually has and can bring to production and the range in terms of diversity, meaning the number of different production associations the farmer practices at any given time.
Each of these possibilities is taken to refer to farmers’ scale of production in this study wherever applicable.
4. Adaptability to local conditions refers
to the ability of new technology to be used with minimal disruptions in the formalized system of functioning of local agriculture. It includes the ability for new technology to be flex- ible and adjustable enough to facili- tate its integration into the local agri- cultural system.
5. Long-term considerations refer to the assessment made by farmers of how sustainable this technology can be.
It is a consideration of the depend- ability of a new technology.
6. Suspicion towards new technologies is born from a history of failed attempts at introducing viable innovations in small-scale agriculture in the study areas. It refers to a misgiving about the true intentions of the new tech- nology.
7. Endorsement by opinion leaders refers to the backing or approval or the new technology given by people who matter in the communities and lives of small-scale farmers.
8. Access to information refers to the ease of having information on the new technology under considera- tion. Information here refers to knowledge about the existence of a technology, knowledge of what the technology can or cannot do, its lim- itations, and so on. Information in can be tainted or biased when small- scale farmers receive it (even from
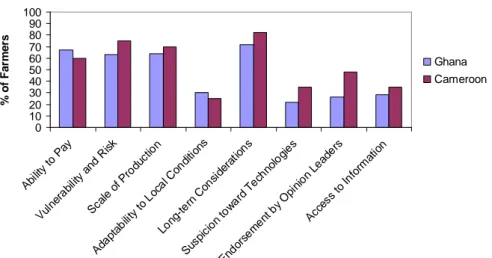
Figure 4: Percentage of farmers advancing different consider- ations for adopting improved maize seeds in Ghana and Cameroon (N=12 in Cameroon and N=30 in Ghana)
Figure 1 Percentage of Farmers Advancing Different Considerations for Adopting Improved Maize Seeds in Ghana and Cameroon (N=12 in Cameroon and N=30 in Ghana).
Considerations for Adopting Improved Maize Seeds In Cameroon and Ghana
0 10 20 30 40 50 60 70 80 90 100
Ability to Pay Vulnerability and R
isk
Scale of Produc tion
Adap tability to L
ocal C onditions
Long-tern Considerations Suspicion toward Technolo
gies
Endo
rsement by Opinion Le ade
rs
Access to Information
% of Farmers
Ghana Cameroon
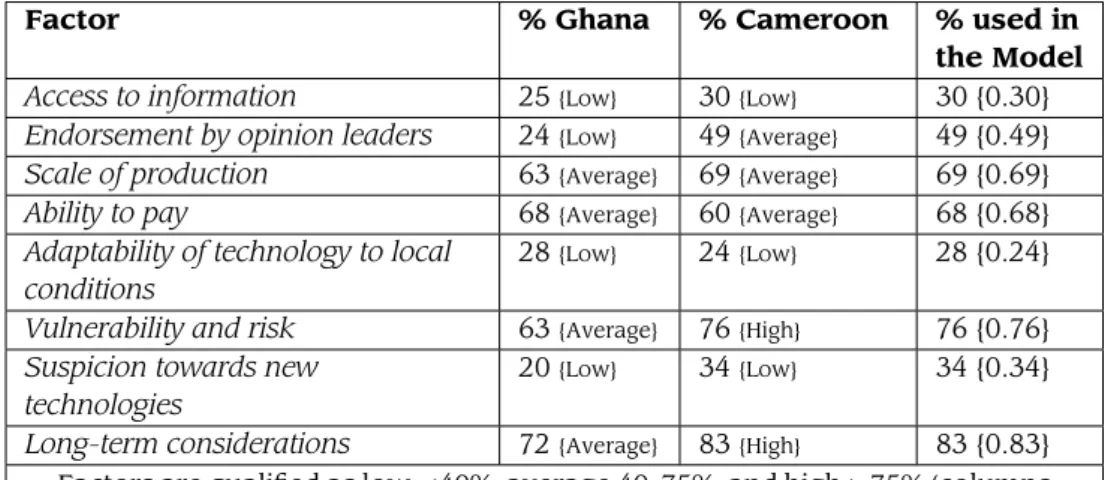
Table 1: Summary of the Qualification of Different Factors of Agri- cultural Technology Adoption Derived from Interviews
Factor % Ghana % Cameroon % used in
the Model
Access to information 25
{Low}30
{Low}30 {0.30}
Endorsement by opinion leaders 24
{Low}49
{Average}49 {0.49}
Scale of production 63
{Average}69
{Average}69 {0.69}
Ability to pay 68
{Average}60
{Average}68 {0.68}
Adaptability of technology to local conditions
28
{Low}24
{Low}28 {0.24}
Vulnerability and risk 63
{Average}76
{High}76 {0.76}
Suspicion towards new technologies
20
{Low}34
{Low}34 {0.34}
Long-term considerations 72
{Average}83
{High}83 {0.83}
Factors are qualified as low
<40%, average 40-75%, and high>75% (columns2 and 3). They are used in converting the conceptual model into the quan- titative model. The higher percentage for each factor from either Cameroon or Ghana is used as a weight for the influence of the factor in determin- ing rates of adoption in the model (last column with weights represented in curly brackets where the maximum is 1 and the minimum 0).
their trusted sources – agricultural extension workers and other opinion leaders) for a variety of reasons.
Four of these factors stood out as im- portant factors considered by farmers when they make decisions to adopt a new technology. These are: farm- ers’ ability to pay for the new technol- ogy, their assessment of the degree of vulnerability and risk associated with adopting the new technology, farmers’
scale of production, and long-term con- siderations. Less prominent factors were the adaptability of the new tech- nology to local conditions, suspicion of the technology, endorsement by opin- ion leaders, and access to information.
The percentages of farmers who iden- tified different factors as important are represented in Table 1.
4.4 The refined model of systems dynamics
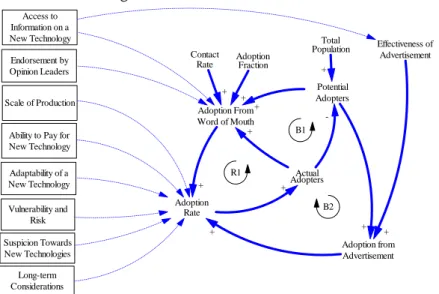
Other factors that affect the adoption of new technologies (besides advertise- ment and word-or-mouth) are incor- porated into the conceptual baseline model to give a more integrated system that illustrates the system of decision- making among small-scale farmers (Figure 5). In the baseline model of the diffusion of new technologies (shown in
bold in Figure 5), individual sub-systems (which comprise other factors identified by farmers as being important in con- sidering the adoption of new technolo- gies) are in boxes and are connected to the baseline model (in bold) with dotted lines. These boxed variables are differ- ent from the non-boxed variables in that they are the outcome of cause-effect re- lationships of smaller sub-systems. The absence of polarity (+ or – signs) in the arrows that link them to the baseline model (in bold) indicates that they can have both a positive and negative influ- ence on the Adoption Rate and Adop- tion from Word-of-mouth in the base- line model.
R1 represents the reinforcing effect of the adoption of the technology from word-of-mouth and from advertise- ment. This reinforcing loop give rise to the rising limb of the traditional logis- tic growth curve of technology diffusion (see the adopters curve in Figure 3; and also Morecroft 2007; Sterman 2000; and Bass 1969). R1 therefore represents the potential of an unlimited growth in an infinite number of potential adopters.
However, the population is always a
limiting factor to the number of po-
tential adopters, hence the flattening
top of the curve of adopters (Figure 3).
In the small-scale farming system of sub-Saharan Africa, the effectiveness of advertisement, adoption from word-of- mouth, and the adoption rate also have limitations (shown in the boxes accom- panied by dotted arrows) which deter- mine the eventual speed of technologi- cal adoption and shape of the adoption rate curve.
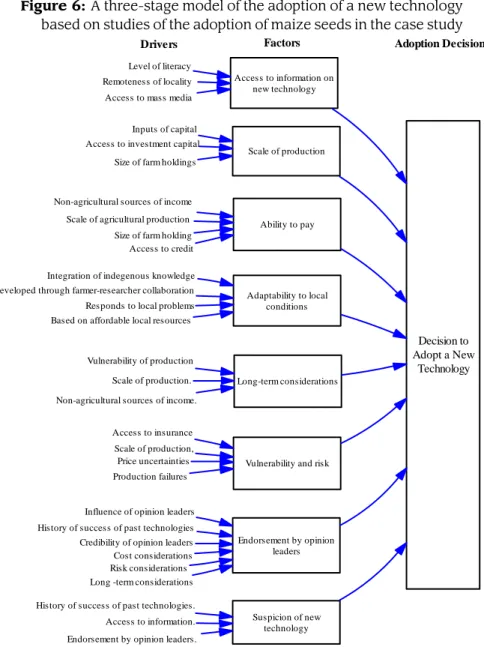
5 The Role of Other Factors from Conceptual Analysis We discuss here the results of both in- terviews and quantitative modeling of the decision-making process of agricul- tural technology adoption among small- scale farmers in the case studies. The results of interviews are represented as causal loop diagrams which represent feedback processes of individual factors of decision-making in agricultural tech- nology adoption. These can be illus- trated in a three-stage model of drivers of factors that determine adoption, the factors that determine adoption, and the decision to adopt the new technology (Figure 6). The decision to adopt a new technology is determined by a number of factors which are themselves the out- come of several drivers. The main fac- tors of adoption in the baseline model (advertisement and spread by word-of- mouth) are omitted. It must be noted
that some factors of technological adop- tion in one system become drivers of factors in other sub-systems.
Given that the baseline model takes the role of advertisement and word-of- mouth in the spread adoption of tech- nology for granted, the role of other factors in determining the process and speed of technology spread are dis- cussed. Results of the quantitative mod- eling are an application of the under- standing of the decision-making pro- cess to a hypothetical population of farmers to see the effects of individual factors on the rate of adoption of a new technology.
5.1 Access to Information
Farmers need knowledge about the benefits of a pice of technology to be able to make decisions on whether or not to adopt it (Beckford 2002). In many parts of sub-Saharan Africa, the avail- ability of this knowledge to farmers may be constrained by a number of chal- lenges: the remoteness of an area may limit the availability of information on a piece of technology; and limited eco- nomic resources may mean that farm- ers or farming communities may not have access to information through cer- tain forms of mass media like televi- sion, print media, internet, and oth- ers. In many cases, the literacy rates
Figure 5: A more integrated CLD illustration of the system of decision-making
Adoption From Word of Mouth
Adoption from Advertisement Adoption
Rate
Actual Adopters
Potential Adopters
Effectiveness of Advertisement Total
Population Adoption
Fraction Contact
Rate
+
+
+ +
- +
+ +
+
+ + Access to
Information on a New Technology
Scale of Production
Ability to Pay for New Technology Adaptability of a New Technology Vulnerability and
Risk Endorsement by Opinion Leaders
Suspicion Towards New Technologies
Long-term Considerations
R1
B2 B1
are low and potential users may not be able to access needed information even if it is available (Figure 7). This form of knowledge about a piece of tech- nology which allows potential users to be able to make decisions on whether to adopt it is termed by Abdulai et al.
(2005) as “schooling”. Some of the com- mon means through which informa- tion is brought to small-scale farmers in developing countries is through farm- ers’ cooperatives and common initiative groups, rural development field staff, churches, farmers’ representatives, and extension staff of the Ministry of Agri- culture.
Figure 7: CLD of drivers of access to information on a new technol- ogy on its adoption
Level of Literacy
Remoteness of Locality
Access to Mass Media
Decision-making Power Access to
Information about a New Technology +
-
- +
+
+ +
R
5.2 Scale of Production
In sub-Saharan Africa where agricul- ture employs more than 60 percent of workforce, and contributes to more than 35 percent of the gross domes- tic product, small scale farming con-
Figure 6: A three-stage model of the adoption of a new technology based on studies of the adoption of maize seeds in the case study
Access to information on new technology
Scale of production
Ability to pay
Adaptability to local conditions
Long-term considerations
Vulnerability and risk
Endorsement by opinion leaders
Suspicion of new technology Level of literacy
Remoteness of locality Access to mass media Inputs of capital Access to investment capital Size of farm holdings
Non-agricultural sources of income Scale of agricultural production
Size of farm holding Access to credit Integration of indegenous knowledge Developed through farmer-researcher collaboration Responds to local problems Based on affordable local resources
Vulnerability of production Scale of production.
Non-agricultural sources of income.
Access to insurance Scale of production, Price uncertainties Production failures
Influence of opinion leaders History of success of past technologies Credibility of opinion leaders Cost considerations Risk considerations Long -term considerations
Access to information.
Endorsement by opinion leaders.
History of success of past technologies.
Decision to Adopt a New
Technology
Drivers Factors Adoption Decision
tributes more than 80 percent of to- tal agricultural outputs (FAOSTAT 2009;
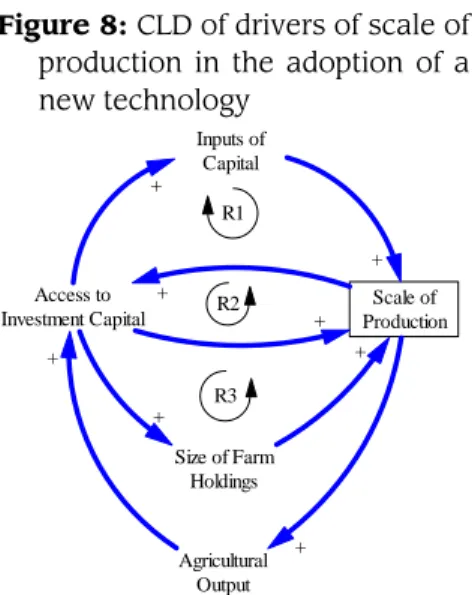
Gallup et al. 2000). Small-scale agri- culture here is characterized by small farm holdings, low capital inputs, low outputs, and vulnerability to production failures, price shocks, and loss of in- come. The low outputs implies a lim- ited ability to raise investment capital through savings, while the vulnerabil- ity of farmers prevents them from tak- ing production risks that may otherwise be profitable. The small and fragmented nature of their farm-holdings also pre- vents them from investing in and us- ing technologies (especially machinery) that may save labor and increase output and productivity (Figure 8). By increas- ing access to capital, a number of rein- forcing processes (R1, R2, and R3 in Fig- ure 4) are set in motion, that can lead to a sustained increase in the scale of pro- duction in different ways.
Figure 8: CLD of drivers of scale of production in the adoption of a new technology
Scale of Production Access to
Investment Capital
Inputs of Capital
Size of Farm Holdings
Agricultural Output
+ +
+ +
+
+
+ +
R1
R2
R3
5.3 Ability to Pay
Most of the small-scale farmers in sub- Saharan Africa are subsistent producers with small farm holdings ranging from 0.5 hectare to about 4 hectares, and producing food mainly for their house- hold with little surplus for sales in lo- cal community markets (UNDP 2007).
Although all farmers interviewed may like to invest in new technologies that may save labor and increase produc- tivity, they can neither raise the nec- essary capital to do so through meager
savings, or be approved for bank loans which they have no adequate collateral.
Their limited farm-sizes and limited ac- cess to credit imposes a small-scale of production which sustains a state of in- ability to pay for new technology (Fig- ure 9; also see Abdulai et al. 2005).
In many parts of the continent, farm- ing has therefore remained underdevel- oped, labor intensive, and producing comparatively low yields per capita for almost all of the major cereals and oil crops (FAOSTAT 2009; UNDP 2007). It is reported that in cases where farm- ers may have land but lack the finan- cial means to develop it for agriculture, they tend to lease it out and even sell some of the little inputs they have to the few non-financially constrained farmers who can buy (Ahmed 2004).
Figure 9: CLD of drivers of ability to pay for a new technology in the adoption of that technology
Ability to Pay for New Technology Scale of
Production
Size of Farm-holdings
Access to Credit Non-agricultural Sources of Income
+ +
+ + + + +
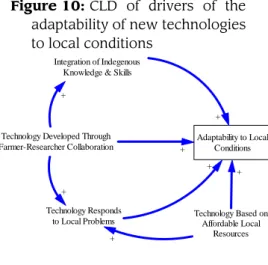
5.4 Adaptability of New Technologies to Local Conditions
The adaptation of new technologies to reflect farming practices and traditions of a community requires recognition of existing indigenous know-how, skills and technologies (Norton et al. 2003;
Lado 1998). When new technology is
adapted to local conditions, it builds
on such existing skills and technolog-
ical capacities as well as maximising
use of local resources (Figure 10). This
gives farmers the opportunity of expe-
riencing a less steep learning curve as
they attempt to familiarize themselves
with the new technology. It also re- duces the level of dependence of farm- ers on external sources of inputs, spare parts, and other resources that are as- sociated with the use of this technol- ogy. Lastly, locally adapted technology should strive towards solving vitel prob- lems (Figure 10). This calls for a revision of the paradigm of science being devel- oped by experts at international or na- tional levels, and then disseminated for use by farmers at local scale (Tilman et al. 2002).
Figure 10: CLD of drivers of the adaptability of new technologies to local conditions
Adaptability to Local Conditions Integration of Indegenous
Knowledge & Skills
Technology Based on Affordable Local
Resources Technology Responds
to Local Problems Technology Developed Through
Farmer-Researcher Collaboration +
+ +
+ +
+
+
5.5 Long-term Consideration Farmers interviewed were unanimous in the belief, that they take into ac- count the long-term effects of their ac- tions when they make decisions regard- ing the adoption or non-adoption of new technology. Farmers’ vulnerability to risk (discussed abovebelow) is an im- portant factor when assessing the long- term implications of adopting new tech- nology. Farmers who are more vulner- able to risks prefer taking less risk and so will tend to be the late adopters of laggards in Roger’s innovation adoption cycle (Figure 11). The scale of produc- tion is also an important consideration.
The smaller the scale of production, the more risk averse the farmer is (Figure 11). This is because a decision that leads to bad harvests will have a larger negative impact on small scale farmers than on large scale farmers. The last important factor taken into long-term consideration is the amount of income
made by the farmer from other sources (non-agricultural income). When non- agricultural activities provide more in- come to farming households, they can afford to try out new technologies, safe in the knowledge that if such technolo- gies should fail, they may not be entirely out of income or livelihood.
Figure 11: CLD of drivers of long- term considerations on the adoption of new technologies
Long-term Considerations Vulnerability and
Risk
Scale of Production
Non-agricultural Sources of Income
+
- - -
- -
R
5.6 Vulnerability and Risk
Most farming in sub-Saharan Africa (es- pecially small and middle-scale farm- ing) is not covered by any form of insur- ance against production failures. Farm- ers are therefore fully responsible for every one of their decisions, which may mean a total loss of food, income, and livelihood in times of poor harvest. They therefore tend to be more risk-averse and will question the level of their expo- sure to risk more, before deciding on the adoption or rejection of new technology (Feder et al. 1985). To estimate the ex- tent to which new technology may ex- pose them to production risks, farmers would generally ask the following ques- tions:
1. Would the adoption a new piece of technology make them dependent on another subsidiary of this tech- nology which they may not be able to afford?
2. Is the new technology going to sub- stantially change their production system in such a way that they may have to undergo a major adaptation process to cope with the change?
3. Will they be able to continue with
production as before if this technol-
ogy ceases to be available?
4. How easy is the process of procure- ment, and how reliable is the source of the new technology?
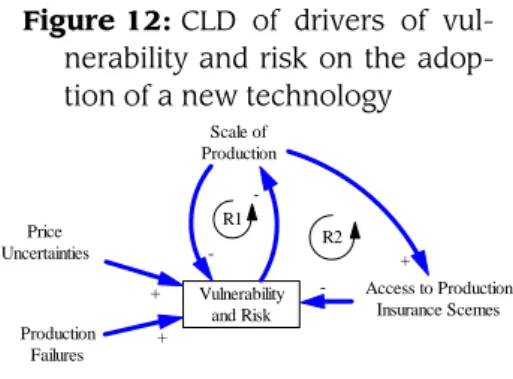
These questions and others make small-scale farmers in the developing world, and sub-Saharan Africa in partic- ular, generally more conservative and less enthusiastic in adopting new tech- nologies (Beckford 2002). When asked if farmers may be willing to receive a new piece of technology, of which payments can be made after they sell their pro- duce, they seem to be less enthusiastic, arguing that the prices of farm produce are not stable. If such prices fall (given that they are usually quite volatile) they may be left with a burden of debt that may strain their livelihoods in the fu- ture (Figure 12). It seems by increas- ing the scale of production, and giving farmers access to some form of insur- ance against production failures, their vulnerability to risks would be reduced.
This means increasing the reinforcing effect of the loop R 1 and R2 in Figure 12.
Figure 12: CLD of drivers of vul- nerability and risk on the adop- tion of a new technology
Vulnerability and Risk Price
Uncertainties
Production Failures
Scale of Production
Access to Production Insurance Scemes
+ - - - +
+ R1
R2
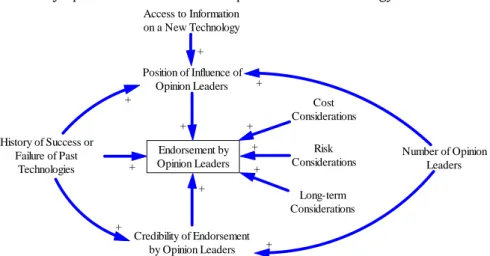
5.7 Role of Opinion Leaders
In the rural communities, which are homes to the small-scale farmers stud- ied, the traditional rulers, educated elites, church leaders, and others still play the role of opinion leaders in their communities. These are generally peo- ple with access to the media, and have a better understanding of media con- tent. They are therefore regarded as the group that can understand the ben- efits and dangers of innovations though their greater awareness and experience.
The role that they play in the process of
technology diffusion is therefore greater than just being risk-takers and inno- vators in the Rogers’ cycle of technol- ogy/innovation growth. Their decisions on the adoption of new technology are usually determined by cost, risk and long-term considerations, and the effec- tiveness of their position is determined especially by the history of the suc- cesses or failures of previous technolo- gies which they supported (Figure 13).
The communities view them as lead- ers who can assess, understand, explain and diffuse the content and understand- ing of new technologies to others. Their endorsement or non-endorsement of an innovation is taken seriously by the farmers, and can influence the effective- ness of the diffusion of the information through word-of-mouth and even of ad- vertisements (see Figure 5).
5.8 Suspicion Towards New Technologies
In certain parts of the region, past in- novations in agriculture brought dis- tress to farmers and have sown seeds of suspicion towards new technologies.
Some of these innovations include the structural adjustment programs in sub- Saharan Africa, and the introduction of genetically modified strains of cot- ton from Monsanto in India (McGregor 2005; Shiva et al. 2000). In such cases, new technologies or other forms of in- novations in agriculture are viewed with distrust and farmers would prefer to adopt a wait-and-see attitude towards them. This could be especially pro- nounced when information about these new technologies is insufficient to en- able farmers and opinion leaders to make a judgment with regards to the different considerations that would suit the farming community (Figure 14).
5.9 Interim conclusion
The covariates discussed above do not
function in isolation. Instead, they
form part of a more complex decision-
making process in the lives and com-
munities of small-scale farmers (Beck-
ford 2002; Wigley 1988). The decision
to adopt any specific new technology at
Figure 13: CLD of drivers of the endorsement of a new technology by opinion leaders in the adoption of that technology
Endorsement by Opinion Leaders Position of Influence of
Opinion Leaders Access to Information on a New Technology
Number of Opinion Leaders Cost
Considerations History of Success or
Failure of Past Technologies
Long-term Considerations Credibility of Endorsement
by Opinion Leaders +
+
+ +
+
+
+
+ + +
Risk Considerations +
Figure 14: CLD of drivers of suspi- cion of a new technology in its adoption
Suspicion Towards New Technologies Endorsement by Opinion Leaders History of Success or
Failures of Past Technologies Access to
Information
- - + +
-
any given time is unique, dependent on the outcome of the analysis of these fac- tors at that particular time and place.
Hence farmers may take the decision to adopt new technology today based on the circumstances of the time, but the same technology at a different time or place with a different state of covari- ates may be rejected. The adoption of each new technology therefore has to find a perfect balance of the combina- tion of individual covariates that suit the circumstances.
The socio-economic realities of sub- Saharan Africa and other parts of the tropical developing world gives small- scale farming a unique character which unlike large-scale farming (especially in the developed world), is influenced by factors more important than the mar- ket (Wigley 1988). However, their prob- lems can be summarized into two main categories over which they have little or no control: natural constraints to pro-
duction, and a limited socio-economic power to change their production sta- tus or their level in the agricultural pro- duction value chain. This explains why flexibility and adaptability in decision- making is often a necessary approach to permit farmers to cope with the habit- ually changing economic and physical conditions (Davis-Morrison et al. 1997).
The production decisions (including de- cisions of adopting or not adopting new technologies) of small-scale farmers are therefore much more complex and can- not be evaluated on the same scale of rationality as those of farmers in the de- veloped world.
6 Results of Simulations
When different weights are attributed to factors identified by farmers as being important in driving their adoption or non-adoption of a new technology and included in the baseline model of tech- nology adoption, three groups of fac- tors emerge (Table 2). These groups are derived on the basis of how heavily they decrease the adoption rates of new technologies among small-scale farm- ers in the case studies.
6.1 Factors that heavily decrease adoption rates
Long-term considerations stand out as
the most important factors that may de-
crease the desire to adopt new technol-
ogy (Figure 15). With a generally small
Table 2: The effect of different factors in decreasing the rate of adoption of a new technology
Factor Adopters
in Year 15
Adopters in Year 25
Effect on Adop- tion Rates
Long-term considerations 1071 3814
Heavily decrease adoption rates
Vulnerability and risk 1620 5645
Scale of production 2541 7668
Adaptability of technology to local conditions
3444 8291
Decrease adoption rates
Ability to pay 4332 8940
Endorsement by opinion lead- ers
8482 9976
Have minor effects on adoption rates
Suspicion towards new tech-
nologies
8487 9979
Access to information 9917 9999
scale of production, limited financial means, and low credit opportunities, farmers would tend to consider long- term implications in their decisions to adopt new technology. Including long- term considerations in the model gives rise to a delayed start of adoption which eventually is sustained at a rate lower than that resulting from the effect of vul- nerability. It seems most of the potential adopters may adopt a wait-and-see at- titude to the new technology, but once they are sure that its long-term creden- tials are good, the adoption process may then accelerate.
Figure 15: The effect of long-term considerations on the adoption rates of new technology. Long- term considerations heavily de- crease the rate of adoption.
0 2000 4000 6000 8000 10000 12000
0 1 3 4 5 6 8 9 10 11 13 14 15 16 18 19 20 21 23 24 25 Years of Simulation
Farmers
Adopters Adoption Rate
The level of vulnerability and risk is de- termined by farmers’ scale of produc- tion, price uncertainties, the frequency and number of production failures and
especially farmers’ access to insurance against production failures (Figure 6 and 12). When farmers are exposed to a high vulnerability and risk (76%), the result is an adoption rate that starts late and grows steadily (Figure 16). The number of adopters correspondingly re- mains very low for a long time before increasing.
Figure 16: The effect of vulnerabil- ity and risk on the adoption rates of new technology. Concern over greater vulnerability and risk from adopting new technol- ogy heavily decreases its rate of adoption.
0 2000 4000 6000 8000 10000 12000
0 1 3 4 5 6 8 9 10 11 13 14 15 16 18 19 20 21 23 24 25 Years of Simulation
Farmers
Adopters Adoption Rate
While long-term considerations, vulner-
ability and risk may be important fac-
tors that may decrease the adoption
of any new technology, their impor-
tance in this case must be seen in the
light of the example of technology be-
ing studied. The maize seeds being in-
troduced were affordable – farmers with
small production scales and limited in- comes could buy as little as half a kilo- gram and try it out in a small por- tion of their farms. Therefore financial burden and production scale were no longer an issue. Information on the ex- istence and benefits of the new seeds was spread by agricultural extension workers (present in most local commu- nities), hence knowledge of the prod- uct in question increased. It had to take time (several seasons of cultivation) for the farmers to assess whether the maize seeds were adapted to the local condi- tions. Given that the seeds were actively being promoted by agricultural exten- sion workers (who are opinion leaders in the small-scale farming world of both case studies and whom the farmers ex- pect to know what is good for agricul- ture) the importance of suspicion to- wards the new technology and effect of endorsement by opinion leaders in decreasing the adoption rate declined.
The adoption of other technologies that influence the lives of small-scale farm- ers through different channels, which are promoted in different ways, may have different acquisition costs (much higher or much lower) and may there- fore be heavily influenced by different factors.
6.2 Factors that decrease adoption rate
Farmers’ scale of production is a fac- tor which decreases the adoption rate of new technology. It leads to a late start of adoption with a rate which peaks about 20 years into the simulation pe- riod (Figure 17). Given that about 80%
of farming in the case studies are small- scale farmers and the backbone of na- tional food security in developing coun- tries is the small scale farmer (Khor 2006), the influence of scale on technol- ogy adoption is very important. Scale of production is not as important in de- creasing adoption rates as long-term considerations and vulnerability partly because of the production under study (maize seeds) can be bought in quanti- ties small enough to be tested on small patches of farmland.
Figure 17: The effect of scale of production in decreasing the adoption rates of new technol- ogy. When the scale of pro- duction is small, farmers tend to be less inclined to adopting new technology.
0 2000 4000 6000 8000 10000 12000
0 1 3 4 5 6 8 9 10 11 13 14 15 16 18 19 20 21 23 24 25 Years of Simulation
Farmers
Adopters Adoption Rate
The ability to pay decreases the adop- tion rates of new technology among small-scale farmers in the case studies (Figure 18). This means that the greater the affordability of a pice of technol- ogy, the greater the tendency for famers to adopt the technology. As discussed earlier, some farmers may not like to take loans to purchase new technology.
They prefer investing for such technolo- gies with their own income. The rate of adoption, when the ability to pay is average, peaks in about 16 years into the simulation period (Figure 18). Most technology has to be bought and there- fore entail the availability and accessi- bility of money to small-scale farmers.
Most small-scale farmers in developing
countries however have low purchasing
power and limited access to credit fa-
cilities which make them unable to af-
ford many of the types of technology
that are introduced. In the case of the
maize seeds farmers could not rely on
continually paying for new seeds every
planting season. It however seems that
the ability to pay is not as important a
factor as long-term considerations and
farmers’ vulnerability and risk of pro-
duction failures. This may partly be ex-
plained by the fact that the maize seeds
that are used as a case study is compar-
atively affordable (at least in the short-
term). Hence farmers can at least afford
them on retail basis for trial. The out-
come may be different if the new tech-
nology were a more expensive piece of machinery or other technology.
The adaptability of the new technology to local conditions leads to a decrease in rates of adoption of almost the same magnitude as scale of production and ability to pay (Figure 19). Adaptability here could be in terms of the system of farming, method of storage, manner of storage, preparation, etc. In the case of the maize seeds, they were ill-adapted to their environment in terms of not be- ing harvestable and storable in ways farmers were familiar with. They were also ill-adapted in terms of their taste (see Section 4.2).
Figure 18: The effect of the ability to pay for new technology in de- creasing the adoption rate of that technology. The ability for farm- ers to pay for new technology decreases their adoption rate of the technology.
0 2000 4000 6000 8000 10000 12000
0 1 3 4 5 6 8 9 10 11 13 14 15 16 18 19 20 21 23 24 25 Years of Simulation
Farmers
Adopters Adoption Rate
Figure 19: The effect of adaptabil- ity of new technology to lo- cal conditions in decreasing its adoption rate. When a technol- ogy is not adapted to local con- ditions, it decreases the adoption rate of the technology.
0 2000 4000 6000 8000 10000 12000
0 1 3 4 5 6 8 9 10 11 13 14 15 16 18 19 20 21 23 24 25 Years of Simulation
Farmers
Adopters Adoption Rate
6.3 Factors with only minor impact on adoption rates
While present, other factors seem to play a less important role. They include access to information, suspicion of new technologies, and the effect of endorse- ment by opinion leaders.
Access to information is seen to play a minimal role in decreasing the adop- tion rate. The peak of the adoption rates is easily attained in about 5 years and about 9.000 adopters in a total pop- ulation of 10.000 potential adopters is reached by the 7
thyear (Figure 20). In terms of the maize seeds under study, information on the seeds was spread by agricultural extension workers whose operations reach some of the most re- mote areas of the case study. Knowl- edge about what the new technology intended to accomplish had been dis- seminated through people whom the farmers apparently trust to deliver cor- rect news and information on innova- tions. Farmers therefore had the nec- essary knowledge to guide their deci- sions on whether to adopt or not to adopt the technology. Access to infor- mation therefore had a minimal impact on the adoption rates of the technology in questions. The absence of informa- tion may seed doubts in farmers minds as to what exactly the new technol- ogy may stand to benefit them, thereby reducing adoption rates. In the same light, access to sufficient information may also reveal weak points about a new technology and reduce its adoption rates. The information disseminated to farmers in the case of the maize seeds for example was more focused on the higher yields per hectare. Farmers were to discover problems with taste, storage and seed preservation later. Figure 20 should therefore be understood within the context of the case study in ques- tion.
Suspicion towards the new technology
is seen to be a minor factor in decreas-
ing adoption rates. As discussed ear-
lier, the maize seeds under considera-
tion benefited from positive “public re-
lations” through agricultural extension
workers who are seen as trusted and
Figure 20: The effect of access to information in decreasing the adoption rate of new technology.
Access to information is seen to have a minor impact in decreas- ing adoption rates.
0 2000 4000 6000 8000 10000 12000
0 1 3 4 5 6 8 9 10 11 13 14 15 16 18 19 20 21 23 24 25 Years of Simulation
Farmers
Adopters Adoption Rate
knowledgeable agents of agricultural change in rural areas of the case stud- ies. Being agricultural opinion leaders in their own right, the endorsement of the technology by agricultural extension workers co-opted other opinion leaders (village elders, leaders of agricultural common initiative groups and cooper- atives, and others) into their ranks. This decreased the role that endorsement by opinion leaders would have played in decreasing adoption rates of the maize seeds. Like the effect of suspicion to- wards new technologies, of the en- dorsement by opinion leaders generates a peak adoption rate by the 12
thyear and a total of about 9.000 adopters in a potential population of 10.000 by the 15
thyear (Figure 21 and 22). The close resemblance of the adoption rates re- sulting from the effects of endorsement by opinion leaders and the suspicion of new technology results from the rela- tionship between the two factors. When opinion leaders endorse a technology, suspicion farmers may have over this technology is allayed. The two factors are therefore closely coupled.
7 Policy Implications
The transfer of technology to encour- age development of Africa’s agriculture is seen as an essential ingredient in at- taining sustainable rural development in the continent, raising many of the agriculture-dependent population out of
Figure 21: Effect of suspicion of new technology in decreasing its adoption rate. Suspicion of a new piece of technology has only limited impact in decreas- ing its adoption rate.
0 2000 4000 6000 8000 10000 12000
0 1 3 4 5 6 8 9 10 11 13 14 15 16 18 19 20 21 23 24 25 Years of Simulation
Farmers
Adopters Adoption Rate
Figure 22: The effect of endorse- ment of new technology by opin- ion leaders in decreasing its adoption rate. The endorsement of new technology by opinion leaders has only a minor impact in decreasing adoption rates of the new technology.
0 2000 4000 6000 8000 10000 12000
0 1 3 4 5 6 8 9 10 11 13 14 15 16 18 19 20 21 23 24 25 Years of Simulation
Farmers
Adopters Adoption Rate
poverty, and contributing to global food security (World Bank 2007; Pinstrup- Andersen et al. 1998; McCalla 1999).
The challenges for policy makers are many and stem from the social and eco- nomic realities of alot of sub-Saharan Africa’s rural landscape. Besides low levels of literacy, limited access to in- formation, and low purchasing power, these areas have fewer agricultural sup- port services than they had 25 years ago, and have tended to distrust some of the advice and innovations being proposed by decision makers in the sector (Blackman 1999; Ahmed 2004;
World Bank 2007). To meet these chal-
lenges agricultural development policy
may have to streamline their efforts to:
•
Improve basic education which raises the level of literacy and im- proves farmers’ ability to access needed information (Figure 7). Ac- cess to information then empow- ers farmers in that they are able to make informed choices offered by new technologies.
•
Improve agriculture-related infras- tructure (farm-to-market roads, and other communications infrastruc- ture) which can enable farmers to have affordable access to farm tech- nology, agricultural inputs and mar- kets for their products. This en- hances mobility of people and prod- ucts and can affect the adoption of technology in a number of ways: in- formation on new technology can easily reach areas remote from cities at lower costs if mobility were lim- ited; mobility of farmers to structures and services that can be useful in meeting their production needs is in- creased, e.g. financial structures for investment capital (Figure 3 and 4).
•
Provide basic protection and mini- mum standards for agriculturalists (especially small-scale farmers) with a low capacity to compete with large-scale subsidized agriculture from many parts of the developed world. This can reduce the vulner- ability of small-scale farmers to pro- duction risks and empower them to venture into increasing their scales of production (Figure 6). Small-scale farmers would be more willing to try new technology, knowing that they have some protection in the event of a production failure resulting from the new technology.
•