How Economic Laypeople Perceive Economic Growth and Inflation
Inauguraldissertation zur
Erlangung des Doktorgrades der
Wirtschafts- und Sozialwissenschaftlichen Fakultät der
Universität zu Köln
2008 vorgelegt
von
Diplom Kaufmann Fabian Christandl aus
Dachau
Referent: Prof. Dr. Detlef Fetchenhauer Korreferent: Prof. Dr. Lorenz Fischer
Tag der Promotion: 18. Juli 2008
Acknowledgements
I am greatly indebted to my supervisor, Prof. Dr. Detlef Fetchenhauer, for his guidance throughout the course of this research and in particular for his fruitful and highly constructive suggestions for improvement. This dissertation could not have been written without his inspiration as an exemplary teacher and scientist.
I would further like to express my gratitude to Prof. Dr. Lorenz Fischer for his comments on an earlier version of Chapter 3 and for his instruction in social psychology. I would also like to thank Prof.
Dr. Erich Kirchler and Prof. Dr. Erik Hölzl from the University of Vienna for their helpful comments on an earlier version of Chapter 2.
My thanks also go to my colleagues at the Department of Economic and Social Psychology for their helpful comments on Chapters 2 to 4.
I would additionally like to thank my girlfriend Nicole Kura for her
emotional and psychological support. Finally, I would like to thank
my parents, who made my studies possible – in particular my mom,
who sadly died before this dissertation was completed.
Contents
List of figures... IV List of tables ... V
1. General Overview ... 1
2. The illusion of living in a linear world – How laypeople and experts underestimate the effect of economic growth ... 5
2.1. Introduction ... 5
2.2. Study 1 ... 8
2.2.1. Method... 8
2.2.1.1 Participants ... 8
2.2.1.2 Procedure ... 9
2.2.2. Results and discussion ... 9
2.3. Study 2 ...11
2.3.1. Method...12
2.3.1.1. Participants ...12
2.3.1.2. Procedure...12
2.3.2. Results and Discussion ...13
2.4. Study 3 ...18
2.4.1. Method...20
2.4.1.1. Participants ...20
2.4.1.2. Procedure...21
2.4.1.3. Measurements ...22
2.4.2. Results and Discussion ...22
2.4.2.1. Manipulation Check...22
2.4.2.2. Effects of incentives, expertise, need for cognition, gender and interest in politics and economics...23
2.5. Study 4 ...28
2.5.1. Method...29
2.5.1.1. Participants ...29
2.5.1.2. Procedure...30
2.5.2. Results and discussion ...31
2.6. General Discussion ...36
3. “I only believe in statistics that I faked myself” – How laypeople react when their beliefs on the economy are contradicted by experts ...43
3.1. Introduction ...43
3.2. Method...51
3.2.1. Sample...51
3.2.2. Stimulus ...51
3.2.3. Procedure...51
3.3. Results ...58
3.4. Discussion ...62
4. The biggest tax increase all-time! – An examination of the confirmation bias in a real-world setting ...66
4.1. Introduction ...66
4.2. Method...71
4.2.1. Participants ...71
4.2.2. Procedure...71
4.2.3. Results...75
4.2.3.1. First survey before the value-added tax increase ....75
4.2.3.2. Second survey after the value-added tax increase ..76
4.3. Discussion ...80
5. General Discussion...84
5.1. Theoretical Implications...84
5.1.1. Lay perceptions of future economic phenomena are often
biased and inaccurate...84
5.1.2. Lay beliefs on the economy remain stable over time,
even in the light of contradictory evidence ...88
5.1.3. The interplay of biased perceptions of future economic phenomena and the persistence of resulting beliefs ...91
5.2. Practical Recommendations ...98
5.2.1. Enabling people to think in terms of consequences and dynamics...99
5.2.2. Highlighting the irrationality of rational ignorance...101
5.2.3. Decreasing the costs of information processing ...102
5.2.4. Considering the functional nature of lay beliefs and biases in the perception of the economy...106
5.2.5. Creating structures within which biases can contribute to rational and foresightful behavior ...108
5.3. Implications for future research ...112
5.3.1. Perceived Inflation ...112
5.3.2. The formation of lay beliefs ...122
5.3.3. Perception of the economy and economic policy ...127
5.3.4. Intercultural aspects...129
6. References ...132
List of figures
Figure 1: Mean Estimations and True Values for a 1%, 3%, and 5%
Growth-Rate ... 10 Figure 2: Mean Estimations for the Economic Growth and Financial
Investment Setting for Participants who believed that the Mathematical Procedures were and were not identical,
respectively ... 15 Figure 3: Valid Estimations in % by Expertise, Need for Cognition and
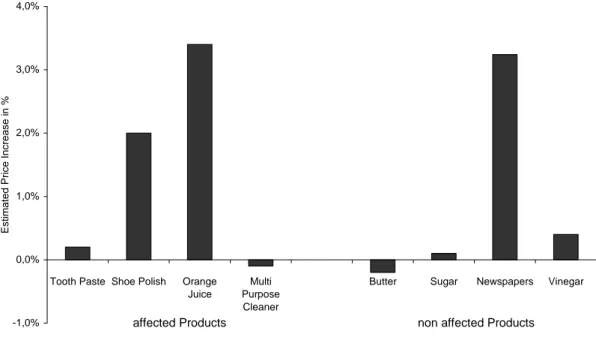
Gender ... 27 Figure 4: Percentaged Estimations by the German Federal Statistical
Office (DESTATIS) of the Price Increases from October 2006 to February 2007 ... 73 Figure 5: Factual Price Increases as measured by the German Federal
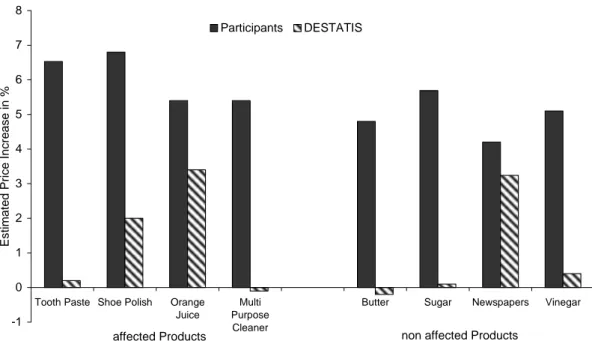
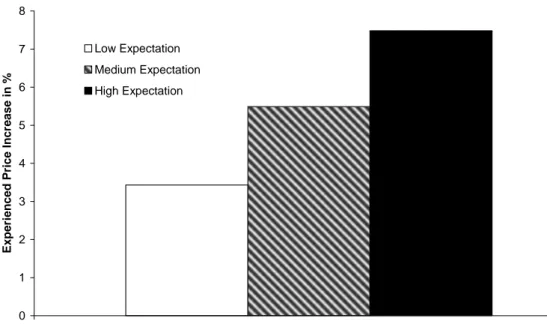
Statistical Office (DESTATIS) compared to the Perceived Price Increases by the Participants ... 77 Figure 6: Experienced Price Increases after the Value-Added Tax
Increase depending on the General Price Increase Expectations before the Value-Added Tax Increase... 79 Figure 7: Experienced Price Increases depending on the Mean
Anticipated Price Increases ... 80 Figure 8: Mean Price Increase Estimations by Participants and
DESTATIS... 95
List of tables
Table 1: Summary of Binary Logistic Regression Analysis. Regression Coefficients for Mathematical Procedure and Gender predicting Valid Estimations in Both Settings ... 17 Table 2: Summary of Binary Logistic Regression Analysis. Regression
Coefficients for Predictors of Valid Estimations... 26 Table 3: Summary of Binary Logistic Regression Analysis. Regression
Coefficients for Expertise and Gender predicting Valid
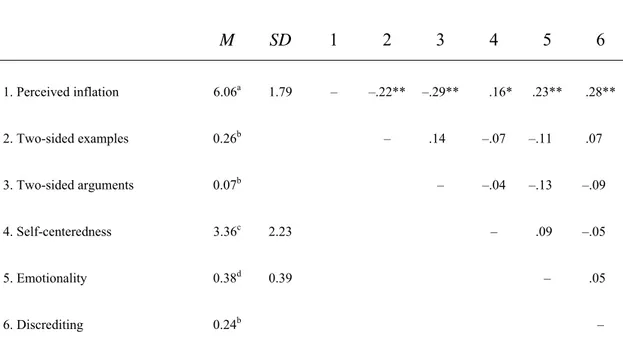
Estimations ... 34 Table 4: Means, standard deviations and correlation coefficients for
the variables Perceived Inflation, Self-centeredness and
Emotionality and percentages and correlation coefficients for the variables Two-sided Examples, Two-sided Arguments and
Discrediting ... 57 Table 5: Summary of Simultaneous Regression Analysis. Regression
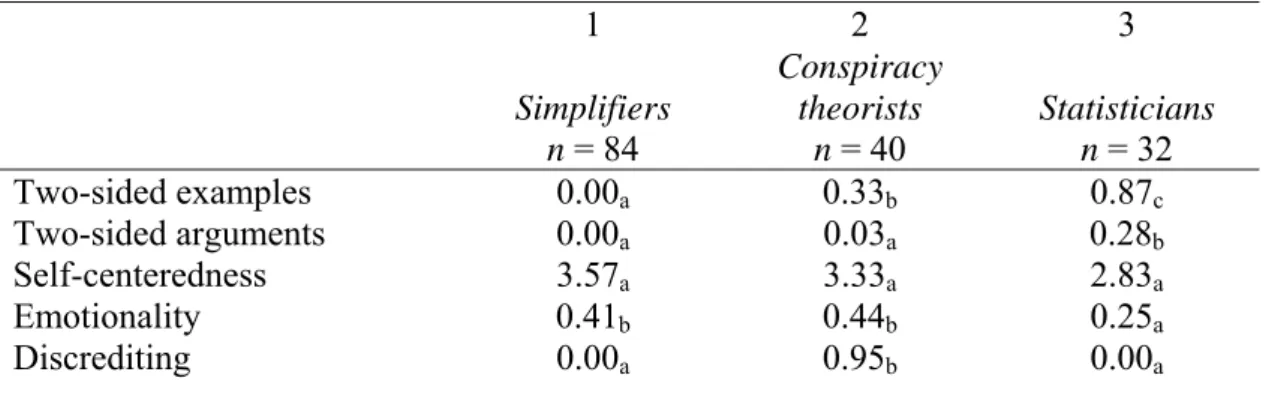
coefficients for Predictors of Perceived Inflation ... 59 Table 6: Results of two-step cluster analysis using Two-sided
Examples, Two-sided Arguments, Self-centredness, Emotionality
and Discrediting as active variables... 60
Table 7: Classification of the eight Products... 72
“The concepts of people, their mindsets, are in many cases more important for the direction of economic policy than the economic facts themselves.”
(Walter Eucken (1952), Grundsätze der Wirtschaftspolitik)
1. General Overview
Economic theory provides us with knowledge on economic facts. This knowledge is also drawn upon in making recommendations for political decision makers and thus contributes to the implementation of policies which are designed to help increase welfare. However, political decision makers face the problem of depending on voter acceptance. In turn, this acceptance depends on the voters’
understanding of the benefits associated with the economic and political measure in question. The present dissertation therefore addresses the perspective of the voter by focusing on two phenomena which play a central role in the implementation of economic and political reform measures, namely biases in the perception of the economy and the stability of peoples’ concepts on the economy. Both phenomena are important for political decision makers. Biases in the perception of the economy may contribute to the rejection of reform measures which from an economist’s point of view are reasonable. A stability of peoples’ concepts of the economy would implicate that it is extremely difficult to modify inadequate beliefs which may be based on biased perceptions of the economy.
Based on the example of economic growth, Chapter 2 discusses the
problem of biases in the perception of the economy. In a series of four
experiments, economic laypeople were required to estimate long-term
economic growth. Study 1 revealed clear underestimations of true
values for growth rates above 1%. In Study 2, the effect of presenting
the task in the context of a financial investment scenario was
investigated. Estimates were found to be slightly more accurate than in the economic growth scenario. Study 3 examined the influence of expertise on the accuracy of estimations. While experts provided more accurate estimations than laypeople, they also tended to underestimate true values. No effect of incentives, but a positive influence of the need for cognition on the accuracy of estimations was observed. Male participants were further found to provide more accurate estimates than female participants. Study 4 used the so- called thinking aloud method to gain deeper insight into the reasons for the observed underestimations. Underestimations were found to be the result of a common application of inappropriate solution procedures.
Chapter 3 addresses the stability of lay beliefs on the economy, even in the light of evidence of a clearly contradictory nature, using the example of the euro introduction. Based on the framework of the Theory of Lay Epistemics, 156 replies to a newspaper article which contradicted the belief that the introduction of the euro was inflationary were subject to content analysis. According to this theory, five different reactions were predicted which should promote high perceived inflation despite counter persuasive evidence. As expected, these five reactions appeared more frequently when subjects were convinced that the introduction of the euro was inflationary.
Finally, Chapter 4 examines the interplay of biases in the perception
of economic phenomena and belief perseverance based on the
example of a value added tax increase in Germany at the beginning of
2007. In a within-subjects design, two surveys were carried out; one
two months prior to and the other two months following the value
added tax increase. 307 participants were required to judge the
actual, prospective and past prices of eight products. In the first
survey, remarkable price increases of approximately 10% were
expected, and there were no differences in expectation between
products affected and those not affected by the value added tax increase. Although perceived price increases in the second survey were lower (around 5%) than the expected increases in the first survey, there were once again no differences in the perceived price increase of products affected and those not affected by the value added tax increase. Perceived price increases were further found to substantially deviate from real price development as measured by the German Federal Statistical Office, thus indicating that biased expectations of price increases prior to the value added tax increase significantly influenced perceived price increases following the value- added tax increase.
However, before addressing the subsequent chapters in detail, it would appear useful to mention a central methodological challenge when dealing with lay perceptions of economic phenomena, and to discuss the extent to which these difficulties were considered in the present dissertation.
A central problem when discussing biased perceptions of economic phenomena or the formation and perseverance of inaccurate beliefs is the necessity for comparison with an objective and valid reality. A discussion of these aspects only appears worthwhile given that perceptional phenomena or beliefs can be compared to the way things
“really” are. Yet whether economics as a science is principally able to
adequately describe how the economy really works appears at the
very least questionable. This becomes clear when considering that
even professional economists very often disagree about the right
economic policy (Fetchenhauer & Haferkamp, 2007). From this
perspective, it could even be argued that biases in the perception of
and belief formation on the economy do not exist. Such an extreme
position can be derived from Moscovici (1984), who concludes from
his Theory of Social Representations that biases are nothing other
than differences in perspective between heterogeneous individuals or
groups. Biases therefore do not necessarily express a social or
cognitive deficit but rather a normal difference in perspective between heterogeneous individuals or groups within a society.
In order to circumnavigate the problems connected with this issue, the studies in the present dissertation focused on phenomena which could be compared to mathematically true values, such as the estimation of long-term economic growth. A further technique adopted in dealing with this problem was relying on the work of the German Federal Statistical Office and the fact that this institution is able to provide more or less accurate measurements of price development. Although measuring inflation rates using baskets of commodities may be associated with certain difficulties, for example refined products (DESTATIS, 2003), this official price information was selected for use given that it appears, on the whole, to closely reflect
“real” price development. It must nonetheless be critically noted that correctly capturing objective reality when dealing with lay perception and lay beliefs on the economy may often prove extremely difficult, thus constraining fields of research in which some measure of objective reality or an appropriate surrogate is required.
Chapters 2, 3, and 4 are intended for submission to future
publications, or already submitted, respectively, and can therefore be
read separately.
2. The illusion of living in a linear world – How laypeople and experts underestimate the effect of economic growth
2.1. Introduction
Imagine two countries, A and B, with the same initial level of wealth.
If it is assumed that country A shows zero growth over the next years and country B grows with an annual growth rate of 5%, how long would it take country B to double its initial level of wealth compared to country A?
The answer is that it would take country B only slightly more than 14 years to double its initial level of wealth compared to country A. A closer look at current statistics on growth rates (e. g. EUROSTAT, 2007) clarifies that it is not difficult to fill the labels “A” and “B” of the different countries with content. Whereas countries such as Denmark, France, Hungary, and Portugal had modest growth (0.5%
to 1.6%) during recent years, countries such as Latvia, Slovakia, and Estonia had significantly higher growth rates (7.7% to 11.0%). The same applies for China, which, for a considerable time, grew with annual rates between 8% and 11.5% and is, therefore, assumed to overtake countries such as Germany very soon (Spiegel-Online, 2007) (at least as far as the absolute gross domestic product is concerned).
These examples clarify that economic growth is profoundly dynamic
and that different growth rates in different countries are suited to
change the meaning and wealth of different economies within
relatively short time frames. Therefore, these examples are also suited
to demonstrate the importance of economic growth and, therefore, of
political measures aimed to stimulate economic growth for a
particular country. Nonetheless, such political measures require the
acceptance of the voters. This acceptance, in turn, should depend on
the voters’ ability to understand the impact of economic growth in the long run and the meaning of higher or lower growth rates.
For this reason, in a series of four studies, the degree to which people are able to understand and estimate the dynamics behind economic growth and what influences the accuracy of their estimations were examined. The main question the participants were asked to answer in all four studies was: “What is the overall rise in national income within the next 25 years if the economy rises with an annual rate of 5%?” The true answer to this question is 238.64%, which is calculated according to the following formula:
[( 1 + 0.05 )
25- 1] * 100 (1)
Hand on heart, would you have provided a reasonably accurate estimation? If not, you are in good company since it is a ubiquitious phenomenon that people have enormous difficulties correctly predicting the future. For example, terms such as presentism (Gilbert, Gill, & Wilson, 2002) or projection bias (Loewenstein &
Angner, 2003) both describe the general phenomenon that people rely too much on current states when prediciting the future. Based on these general phenomena, it is, therefore, not a surprising finding that previous research dealing with estimations of exponential growth rates suggests enormous difficulties when it comes to predicting the outcome of exponential growth in the future.
In a classical experiment by Wagenaar and Sagaria (1975),
participants were asked to extrapolate a hypothetical development of
pollution, which was presented in table form. The remarkable finding
was that two-thirds of the participants drastically underestimated the
true value of 25.000 and provided estimations lower than 2.500,
reaching only 10% or less of the true value. Very similar results were
found in a study by Benzion, Granot, and Yagil (1992) using the
example of financial investments. In this study, participants were
asked to estimate the end value of a money investment of $100 for
various durations and interest rates. Beside the fact that the end
values and, therefore, the exponential growth rates were clearly underestimated, it was also found that the underestimations were clearly increased with the length of the duration and with the magnitude of the interest rate. Even though these findings suggest that the tendency to underestimate exponential effects becomes even stronger with longer periods, the findings from Wagenaar and Sagaria (1975) clarify that this tendency also appears when relatively short time frames of five years are considered.
One could now object that the underestimations are possibly rooted in people’s difficulties when dealing with numerical information. This should, in particular, be the case when people must deal with percentages (e. g., Paulos, 1988), for example, when estimating economic growth in the long run.
In another study, however, Wagenaar and Timmers (1979) used the so-called pond-and-duckweed problem to investigate participants’
ability to estimate exponential growth rates in a non-numerical manner. Participants were exposed to a square, which represented a pond. This pond included 256 small squares, which represented duckweed. The duckweed and, therefore, the number of small squares grew with a constant growth rate, indicating the exponential growth. Most subjects heavily overestimated the time it would take until the duckweed would overgrow the whole pond. It was, therefore, shown that participants’ tendency to underestimate exponential effects is not only a function of lacking numerical abilities, but it also appears when they are confronted with concrete and obvious processes.
To summarize, it has been shown that most people tend to
underestimate the effects of exponential growth rates in a number of
different domains. According to our knowledge, however, whether this
general finding extends to the effects of different levels of growth rates
on the economic wealth of a given country has not been tested. This
question is addressed in Study 1, which examines how far findings
from previous research (e.g., Wagenaar & Sagaria, 1975; Dörner, Kimber, & Kimber, 1997) can be transferred to the context of economic growth. Study 2 examines the influence of the setting of the estimation task and, therefore, to what degree a lack of ability to transfer the logic behind exponential effects to the context of economic growth may account for possible underestimations. Study 3 aims to discover what influences the quality of the estimations by addressing to what degree expertise is suited to improve accuracy.
Additionally, motivational effects are examined, which were either induced experimentally (using incentives) or based on individual dispositions (considering the influence of the personality trait need for cognition). Finally, Study 4 aims to gain insight into the mental processes and possible sources of errors underlying the solution of the estimation task dealing with economic growth by using the thinking-aloud method.
2.2. Study 1
Based on findings from previous research, it was expected that people, in general, would tend to underestimate economic growth in the long run. Furthermore, it was expected that this tendency would become stronger with rising growth rates. Therefore, this study used various growth rates, ranging from 1% to 5%. Participants were asked to estimate the overall growth in national income in 25 years.
2.2.1. Method
2.2.1.1. Participants
Participants were 80 students from the Faculty of Management,
Economics, and Social Sciences of the University of Cologne in an
advanced study period. Therefore, it was expected that they would be
familiar with economic phenomena in general and also with economic
growth and exponential effects because their curricula contain
(among others) various courses dealing with financial investments and even a course dealing with growth theory.
The main part of this sample consisted of students of business administration (73.8%) and economics (12.5%). The remaining participants were students of social sciences and health economics.
2.2.1.2. Procedure
The experiment was carried out in an introductory lecture on economic and social psychology. The participants were requested to fill out a questionnaire and answer all questions in any case, even in case of uncertainty. Furthermore, they were requested not to talk to their neighbors and not to use calculators. Using a between-subjects design, the questionnaire started with the question, “What is the overall rise in national income within the next 25 years if the economy rises with an annual rate of 1% (or 3%, or 5%, respectively)?”
Afterwards, they were asked to fill in their course of study. The debriefing with a short discussion of the results took place in the following lecture.
2.2.2. Results and discussion
Based on the theoretical considerations, it was expected that the participants would clearly tend to underestimate the true values, at least for the 3% and 5% growth rate. Furthermore, the inaccuracy of the estimations was expected to increase with the magnitude of the growth rates due to a stronger impact of exponential effects.
First, a remarkable range of estimations was observed, ranging from 0% to 130% for the 1% growth rate, from 0% to 300% for the 3%
growth rate, and from 0% to 400% for the 5% growth rate. A
subsequent Kolmogorov-Smirnov test for all growth rates was not
signicant at a 5% significance level, thus indicating that the
estimations were approximately normally distributed. A closer look at
Figure 1 reveals that, with the exception of the 1% growth rate,
participants clearly tended to underestimate the true values and that
the inaccuracy of the estimations increased with the magnitude of the growth rates.
0,00 50,00 100,00 150,00 200,00 250,00 300,00
1% 3% 5%
Condition
Growth
Mean Estimated Value True Value
Figure 1: Mean Estimations and True Values for a 1%, 3%, and 5% Growth- Rate
For the 1% growth rate, the mean estimated value of 34.14% did not significantly differ from the true value of 28.24%, t(26) = .82.
Accordingly, our expectation that participants would provide quite accurate estimations for a low growth rate was confirmed. It appears that, for this growth rate, the exponential effects were still within a conceivable range for the participants.
The situation however differed for the 3% and 5% growth rates. For the 3% growth rate, the mean estimated value of 72.48% was found to be a significant underestimation of the true value of 109.38%, t(26)
= 2.53, p < .05. As expected, this inaccuracy became even stronger for the 5% growth rate. Here, the mean estimated value of 78.54%
represents an extreme underestimation of the true value of 238.64%,
t(23) = 9.04, p < .01. These findings indicate that, as expected, the
underestimation became stronger with the rising impact of
exponential effects, which were strongest for the 5% growth rate. In
sum, it was found that people were quite good in estimating economic
growth for a low growth rate of 1%. However, this situation dramatically differed with rising growth rates.
A subsequent ANOVA revealed a significant main effect of the growth rates on the estimated values, F(2, 75) = 3.18, p < .05, η² = .08, but a subsequent Games-Howell post-hoc test revealed only marginally significant differences between the estimations for the 1% growth rate and the estimations for the 3% growth rate or the estimations for the 5% growth rate, respectively (ps < .10). At the same time, no significant difference was observed between the estimations for the 3% and 5% growth rates. This indicates that these estimations were quite similar, which is a remarkable finding because there is a 129.26% difference between the true values. Therefore, it appears as though people become increasingly helpless with rising growth rates.
2.3. Study 2
Study 1 revealed a strong tendency to underestimate the cumulative
effects of economic growth rates over a longer period of time. A
possible explanation for this tendency could be that some
participants simply did not recognize that economic growth underlies
the effect of exponentiality, such as in financial investments, for
example. For this reason, Study 2 aimed to replicate this main
finding from Study 1 in the context of financial investments. The
basic assumption was that, in general, participants are more familiar
with compound interest effects and the corresponding exponential
growth in a financial investment setting. Therefore, it was expected
that those participants who were not capable of transferring their
knowledge on exponential effects in a financial investment setting to
an economic growth setting would tend to provide lower estimations
in the economic growth setting due to the negligence of exponential
effects.
2.3.1. Method
2.3.1.1. Participants
Participants were 293 students (129 females, 164 males) of different courses of study who were randomly recruited on the campus. One participant was removed from the subsequent data analysis because he provided only an estimate for the financial investment setting.
Furthermore, because there was no upper limit for the range of the estimations, we had to deal with the problem of outliers. It was decided to follow a common procedure to deal with outliers and to exclude estimations beyond a range of three standard deviations (see for example Roth & Switzer, 2002). For this reason, 5 participants were excluded from analysis, though the central results were also obtained when the outliers were not removed from the sample.
2.3.1.2. Procedure
The participants were asked if they were willing to participate in a survey dealing with the psychology of economic growth, and they were told that they could participate in a lottery. If they agreed, they were given the questionnaire and told that they were not allowed to use any devices such as calculators. In the questionnaire, the participants were informed that they were about to answer two estimation tasks and that they should anwer these tasks in all cases, even in case of uncertainty. The sequence of the two estimation tasks (economic growth versus financial investment setting) was randomized to control for sequence effects; however, no such effects occurred. Then, the participants were asked to answer the question,
“What is the overall rise in national income within the next 25 years if the economy rises with an annual rate of 5%?” and the question,
“What is the overall growth of a money investment of 100 Euro within
the next 25 years if there is an annual interest rate of 5%?” Each
question was presented on a separate page to avoid possible
influences of the other question. Nonetheless, the participants were
allowed to page forward/back.
After answering these two questions, they were asked to decide whether the mathematical procedure was identical for both estimation tasks or not. It was found that 113 (38.15%), more than one-third, of the participants in fact believed that the mathematical procedure for both estimation tasks was not identical.
Finally, gender, age, and course of study were recorded. Then, the participants were told that they could participate in a lottery in which four book tokens were drawn. For this purpose, they could either disclose their email address or telephone number. By request, the participants were informed about the true values of the estimation tasks using diagrams that showed the developments of the financial investment and the economic growth.
2.3.2. Results and Discussion
First, it was found that the estimations were not normally distributed, which was confirmed in a significant Kolmogorov- Smirnov test (D = 2.98, p < .01). This was mainly due to the fact that low estimations and numbers such as 5, 10, 25, 30, 50, 100, 125, 150, 200, and 300 were slightly overrepresented. Therefore, the estimations were assigned to seven different classes so that the distribution of the resulting variable, in turn, roughly equaled a normal distribution. Finally, all analyses were carried out with this variable and the raw estimations of the participants; the results were identical. For clarity, we present the results with the raw estimations of the participants.
Compared to Study 1, an even more remarkable range of estimations was found, ranging from 1.5% to 600% in the economic growth setting and from 2.5% to 600% in the money investment setting. The true value of 238.64% was underestimated by 92.1% of the participants in the economic growth setting and by 90.8% in the money investment setting. It is, therefore, not surprising that the mean estimated value in the economic growth setting, M = 82.76, SD
= 93.56, t(292) = 28.47, p < .01, and the mean estimated value in the
financial investment setting, M = 89.55, SD = 95.79, t(292) = 26.42, p
< .01, were significantly lower than the true value of 238.64%. This replicated the effect of underestimation from Study 1 for the 5%
growth rate. Furthermore, it was found that this effect also appeared when participants were asked to judge the end value of a financial investment, thus indicating that a more familiar setting does not prevent participants’ underestimation.
It was, however, assumed that a higher familiarity with compound interest effects in the financial investment setting would lead at least to more accurate estimations compared to the economic growth setting. This notion was tested with a repeated measures ANOVA using the within-subjects factor setting (economic growth versus financial investment) and the between-subjects factor mathematical procedure, which captured if participants believed the underlying mathematical procedure in both settings were identical or not.
Furthermore, the between-subjects factor gender was considered. The following main effects proved to be significant: the estimations in the financial investment setting were higher than in the economic growth setting, and males made better estimations than females.
Furthermore, a significant interaction between setting and mathematical procedure was observed.
As expected, a closer comparison of the whole sample revealed a significant difference between the estimations in the economic growth and the financial investment setting, F(1, 288) = 13.87, p < .01, η² = .05. Accordingly, participants’ estimates in the economic growth setting reached an average of only 82.76% (SD = 93.56), whereas the estimates in the financial investment setting reached an average of 89.76% (SD = 95.89).
Nonetheless, a difference in the estimations for the two settings was
expected to occur for only those participants who believed that the
mathematical procedure was not identical. Not surprisingly, a
significant interaction between setting and mathematical procedure
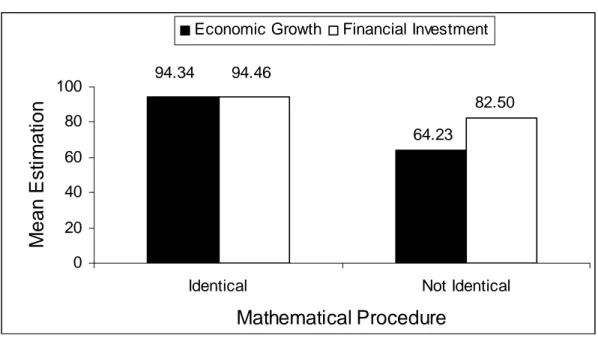
was found, F(1, 288) = 13.94, p < .01, η² = .05. Figure 2 substantiates this interaction. Hence, those participants who believed that both mathematical procedures were identical, in fact, provided very similar mean estimations of 94.34% (SD = 104.11) for the financial investment setting and 94.46% (SD = 106.18) for the economic growth setting. In contrast, the participants who believed that both mathematical procedures were not identical provided higher mean estimations of 82.50% (SD = 81.09) in the financial investment setting than in the economic growth setting, where the estimations reached only 64.23% (SD = 65.28). This finding clarifies that the magnitude of the estimations was influenced by the setting, but only for those 113 participants (38.15%) who believed that both mathematical procedures were not identical.
0 20 40 60 80 100
Identical Not Identical
Mathematical Procedure
M e a n E s ti m a ti o n
Economic Growth Financial Investment 94.46
94.34
82.50 64.23
Figure 2: Mean Estimations for the Economic Growth and Financial Investment Setting for Participants who believed that the Mathematical Procedures were and were not identical, respectively.
Furthermore, substantial gender effects were observed, F(1, 288) = 7.32, p < .01, η² = .03. Male participants provided substantially higher and therefore better estimations (economic growth: M = 99.46%, SD = 101.80; financial investment: M = 112.74%, SD = 103.19) than female participants (economic growth: M = 69.74%, SD
= 84.65; financial investment: M = 71.82%, SD = 85.90). Therefore, it
appears as though female participants are more greatly affected by the tendency to underestimate exponential effects than male participants.
The analyses thus far indicate that most participants are wrong when they estimate cumulative growth in the long run. The results also indicate that most participants tend to underestimate the true values. However, 21 (7.16%) participants overestimated the true value in the economic growth setting, and 25 (8.53%) overestimated the true value in the financial investment setting. It could be that a considerable number of male participants provided estimations of 350% or higher. This, in turn, could also have contributed to higher, but not necessarily better, estimations by male participants. To consider the effects of overestimation, a second dependent variable, valid estimations, was introduced. For the generation of this variable, the estimations in the financial investment and the economic growth setting, respectively, were assigned to two different categories in a first step. The first category included more or less accurate estimations, lying within a range of 50% less and 50% more than the true value of 238.64%. All remaining estimations were assigned to a second category, including more or less inaccurate estimations.
Consequently, 19 (6.5%) participants who provided accurate estimations for both settings were assigned to the category valid estimations, whereas 274 (93.5%) participants who provided inaccurate estimations in one or both of the two settings were assigned to the category nonvalid estimations.
In a subsequent binary logistic regression analysis with the
dependent variable valid estimations and the independent variables
mathematical procedure (identical/not identical) and gender,
significant positive logit coefficients for mathematical procedure (b =
1.20, p < .05) and gender (b =.97, p < .01) were observed. A closer
look at the odds ratio in Table 1 shows that participants who believed
that the mathematical procedure was identical had a 3.30-fold higher
chance of providing valid estimations. Male participants had a 2.64- fold higher chance of providing valid estimations.
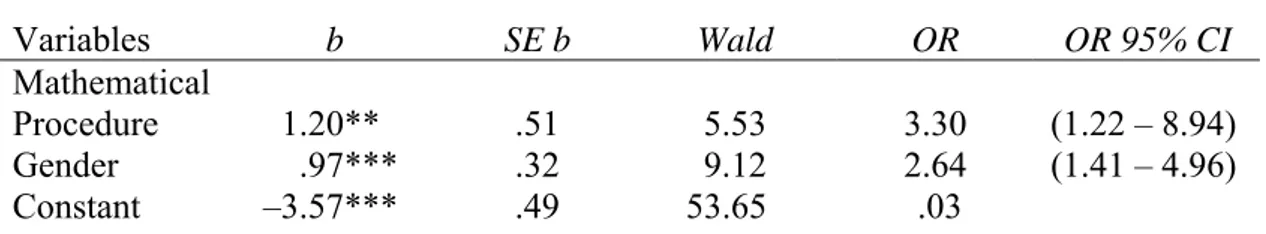
Table 1: Summary of Binary Logistic Regression Analysis. Regression Coefficients for Mathematical Procedure and Gender predicting Valid Estimations in Both Settings
Variables b SE b Wald OR OR 95% CI
Mathematical
Procedure 1.20** .51 5.53 3.30 (1.22 – 8.94) Gender .97*** .32 9.12 2.64 (1.41 – 4.96) Constant –3.57*** .49 53.65 .03
Note. OR = odds ratio; CI = confidence interval
Nagelkerkes R² = .21. -2 log likelihood = 115.77. Correctly classified = 93.5%.
The dependent variable Valid Estimations in both settings was coded with 0 = No Valid Estimations and 1 = Valid Estimations. The independent variable Mathematical Procedure was coded with 0 = not identical and 1 = identical. The independent variable Gender was coded with 0 = Female and 1 = Male.
*p < .10, **p < .05, *** p < .01
It is, therefore, not a surprising finding that 18% of the male participants who believed that the mathematical procedures were identical, in fact, provided valid estimations for both settings. On the contrary, none of the female participants who believed that the mathematical procedures were identical were able to deliver valid estimations in both settings. This replicates the findings from the ANOVA discussed in the section above.
In sum, it was found that the result from Study 1 could be replicated,
both in an economic growth setting and in a financial investment
setting. It was further found that those participants who were not
capable of transferring their knowledge on exponential effects from a
financial investment setting to an economic growth setting provided
lower estimations in the latter setting. Evidence for this result was
also found in the debriefing, as one participant told us: “These
diagrams remind me of diagrams, that a guy from an insurance
company has shown me. I cannot believe these things at all. Above
all, I wonder what these things have to do with economic growth.”
2.4. Study 3
A subsequent question of interest is what influences the accuracy of people’s estimations. An important factor could be the expertise of people with the estimation of exponential growth. It seems plausible that familiarity with phenomena underlying the logic of exponential effects should result in a higher ability to estimate economic growth in the long run. However, the findings from previous research are not clear. Benzion, Shachmurive, and Yagil (2004) examined whether or not participants owning money investments differ from participants without money investments when it comes to estimating future values of money investments, but no such differences were observed.
In one experiment, Wagenaar and Sagaria (1975), found that subjects who were assumed to have daily experience with growth processes also tended to underestimate the effects of exponential growth.
Nonetheless, in another experiment, one of two groups of students was instructed on the characteristics of expontial growth and informed that people tend to underestimate exponential effects.
Subsequently, the participants had to solve an extrapolation task.
Although this group also tended to underestimate the true values, the estimations were better than the estimations from a control group of students who were not instructed (Wagenaar & Sagaria, 1975).
Similar results were found in a study by Eisenstein and Hoch (2005), who found that people may, in fact, provide significantly better estimations if they are trained in the logic behind exponential growth.
After participants had received a specific training on how to calculate exponentional effects, the estimations became twice as good as previous ones. Finally, Keren (1983) found that daily experience with exponential growth rates improves the accuracy of estimations.
According to his findings, people who regularly have to deal with high
inflation rates are able to provide more accurate estimations on
exponential effects. Based on all of these previous findings, it was
expected that participants with expertise in dealing with exponential
growth rates should, in fact, provide more accurate estimations than participants without expertise. For this reason, Study 3 considers differences between participants more and less familiar with exponential growth.
Another explanation for the remarkable underestimation of exponential effects in Study 1 and Study 2 could be rooted in lacking motivation. In particular, many economists share the view that experimental tasks have to matter to the participants to obtain proper data (Hertwig & Ortmann, 2001; Rydval & Ortmann, 2004).
For example, Smith and Walker (1993) state that increased financial rewards contribute to more rational behavior of the participants and reduce the variance of data. Nonetheless, other authors stress the importance of cognitive abilities (e. g., Camerer & Hogarth, 1999).
Following a review of 74 experiments, these authors conclude that when looking at the modal results, no effect of incentives on performance is found. Accordingly, depending on the task, cognitive abilities may play a more central role for the outcomes of experiments than incentives. In line with this deliberation, Jenkins et al. (1998) found in a meta-analysis with 47 studies from applied psychology journals that incentives lead to quantitative effects on the output in simple tasks. However, no effects on the quality of performance were observed in this meta-analysis. These studies argue in favor of the importance of cognitive abilities when estimating economic growth in the long run. It was, therefore, expected that the effects of incentives on the accuracy of the estimations would be rather low. Nonetheless, because of a controversial discussion on the efficacy of incentives, Study 3 examined to what extent incentives cause more accurate estimations.
Yet another motivational effect could be rooted in interindividual
motivational differences. It could be that some people display a
stronger dispositional motivation than others when it comes to
solving such estimation tasks. An appropriate personality measure to
capture the engagement and pleasure associated with the solving of brainteasers is the need for cognition (Cacioppo & Petty, 1982). For this reason, Study 3 wanted to extend previous research by considering to what extent this personality trait accounts for interindividual differences in the accuracy of the estimations. It was expected that the motivation in consequence of a strong need for cognition leads to a higher familiarity with the solving of complex and abstract tasks in general. This familiarity should, in turn, contribute to the application of more appropriate solution strategies. For this reason, it was expected that participants high in need for cognition would provide more accurate estimations.
Finally, Study 3 aimed to find possible explanations for the gender effect observed in Study 2. One possible explanation for this effect is that women are, in general, less interested in politics and economics.
This, in turn, could contribute to a misunderstanding of the meaning of economic growth, which could explain why the impact of economic growth in the long run was more likely to be underestimated by female participants. In fact, a nationwide survey in 2002 found that the political interest of women is lower than the political interest of men (GESIS, 2002). Hence, it might be that the gender effect identified in Study 2 could, at least in part, be explained by differences in the general interest in political and economical questions. For this reason, Study 3 also considered the influence of a general interest in politics and economics and whether this interest explains the gender effects observed in Study 2.
2.4.1. Method
2.4.1.1. Participants
The entire sample consisted of 402 students. Thereof, 180 (79
females, 101 males) were advanced students of economics and
business administration. Their curricula contain (among others)
various courses dealing with financial investments and a course
dealing with growth theory. Therefore, it was assumed that these students were familiar with exponential effects and the logic behind economic growth rates. For this reason, this group of students served as experts.
The remaining 222 students (141 females, 81 males) attended various courses of study (e.g., education, psychology, law). The majority of this group consisted of future teachers. Since the curriculums of these participants do not contain courses dealing with financial investements and growth theory, this group of students served as laypeople. To deal with the problem of outliers, the same procedure as that done in Study 2 was applied (that is, estimations going beyond a range of three standard deviations were excluded).
2.4.1.2. Procedure
The participants were randomly asked on the campus if they were
interested in participating in an experimental study. After the
participants agreed to participate, they were asked for their course of
studies. To ensure that the students of economics and business
administration were “real” experts, only those from an advanced
study period were recruited. Then, the participants were lead into a
laboratory with four computers and each participant was placed in
front of a computer. The experimental procedure began, and the
participants were electronically guided through the questionnaire,
which started with a general introduction of how to complete the
different questions. Then, they were asked to answer the items from
the need for cognition scale. Subsequently, the estimation task was
introduced. The participants were requested to answer this question
in all cases, even in case of uncertainty. In the winning condition,
they were additionally informed that the best estimation was
rewarded with 100 euro, the second best with 50 euro, the third best
with 25 euro, and the fourth best with 10 euro. In the non-winning
condition, only the estimation task was introduced. Then, they were
asked to solve the 5% estimation task by answering the question,
“What is the overall rise in national income within the next 25 years if the economy rises with an annual rate of 5%?”
Finally, questions concerning interest in politics and economics, gender, age, and the course of study were asked. Additionally, the participants in the winning-condition were asked for their email addresses to ensure the possibility of informing them in case they won a prize for a good estimation. Finally, the participants were debriefed by the experimenters.
2.4.1.3. Measurements
To measure the need for cognition, the German version (Bless, Wänke, Bohner, Fellhauer, & Schwarz, 1994) of the need for cognition scale originally developed by Cacioppo and Petty (1982) was used. This scale aims to measure the engagement and pleasure associated with the solving of brainteasers. This scale proved to be a reliable measure, with α = .85.
Interest in politics and economics was measured with a self- developed scale, including seven items such as “I enjoy dealing with issues of economic policy” or “I am reading the business section of a newspaper regularly”. This scale also proved to be a reliable measure, with α = .89.
2.4.2. Results and Discussion
2.4.2.1. Manipulation Check
In a first step, whether the chance of winning up to 100 euro provided the desired incentive was controlled. An indirect manipulation check revealed that the manipulation was successful.
When measuring the time to complete the estimation task, it was
found that participants in the winning condition (M = 113.18, SD =
94.65) took significantly more seconds to complete the estimation
task than participants in the neutral condition, M = 96.26, SD =
70.46, F(1, 400) = 4.09, p < .05, η² = .01.
2.4.2.2. Effects of incentives, expertise, need for cognition, gender and interest in politics and economics
First, it was found that, for the entire sample, the true value of 238.64% was clearly underestimated. This was shown in a mean estimation of 108.99%. Furthermore, some participants appeared to have no clue about how to solve the task, which was demonstrated by the remarkable range of the estimations (from 0.5% to 650%). The true value of 238.64% was underestimated by 91.5% of the participants. All of these results replicated the findings from Studies 1 and 2.
For the analyses to follow, the continuous variable need for cognition was dichotomized using a median split. Since the distribution of this dichotomized variable was virtually identical for all experimental conditions and no significant gender differences were observed, it was included in an ANCOVA with the remaining factors (expertise, incentives, gender, and the covariate interest in politics and economics) to predict the dependent variable estimations. The following main effects proved to be significant: experts made better estimations than laypeople, participants scoring high on need for cognition made better estimates than participants scoring low on need for cognition, and males made better estimations than females.
Incentives and interest in economics and politics did not influence the accuracy of the estimations. No interaction effects were identified.
In fact, a significant main effect of expertise was observed, F(1, 385) =
9.03, p < .01, η² = .02. Accordingly, the students of economics and
business administration provided better estimates of 137.61% (SD =
119.98) than the remaining students who served as laypeople and
provided lower estimates of 85.79% (SD = 82.27). Furthermore, no
significant effect of the incentives was observed, F(1, 385) = .02, thus
indicating that the underestimations from Studies 1 and 2 were a
result of lacking not motivation but ability. It appears that cognitive
abilities play a significantly more important role than the motivational effects of financial incentives.
As expected, a significant influence of the need for cognition was observed, F(1, 385) = 4.23, p < .05, η² = .01. Whereas the mean estimates from participants scoring high on need for cognition reached 125.01% (SD = 105.58), the estimates by the participants scoring low on need for cognition reached only 93.75% (SD = 100.43).
To invalidate methodological objections associated with the dichotomization of continuous variables, it seems worth mentioning that all of the results presented thus far could also be replicated with a regression analysis, using the continuous variable need for cognition. Therefore, with the need for cognition, a psychological variable could be identified, which is (at least to some extent) suited to explain why some people may be less subject to an underestimation of economic growth in the long run than other people.
Furthermore, as in Study 2, a substantial gender effect was observed, which did not disappear when controlling for the slightly different gender distribution between experts and laypeople, F(1, 385) = 9.03, p < .01, η² = .02. While males’ estimates had an average of 135.54%
(SD = 107.73), females’ average estimates reached only a value of 87.03% (SD = 95.67).
But to what extent could the effects observed thus far be explained by
the interest in politics and economics? First, no significant influence
of the covariate interest in politics and economics on the accuracy of
the estimations was found, F(1, 385) = 1.99. It appears, therefore,
that estimating economic growth in the long run is an abstract
cognitive task that has nothing to do with knowledge about politics
and economics. Furthermore, when excluding the covariate interest
in politics and economics from the analysis, the effects reported
above by and large remained stable. Even though it was found that
female participants (M = 2.51, SD = .84) displayed a significantly
lower interest in politics and economics than male participants, M = 3.27, SD = .97, t(361) = 8.27, p < .01, d = .83, these differences were (on the whole) not accountable for the gender effect. The same applies for the effects of expertise and need for cognition, which cannot be reduced to interindividual differences in interest in politics and economics.
A final result of interest was differences in the time to complete the task. Female participants (M = 93.61, SD = .62.14) took significantly less time to complete the task than male participants, M = 118.79, SD
= 103.33, t(284) = 2.88, p < .01, d = .30. A possible explanation is that female participants used different solution strategies when judging economic growth in the long run than male participants, which, in turn, could account for the gender differences observed in Studies 2 and 3.
Finally, similar to Study 2, the estimations were not normally distributed, which was confirmed in a significant Kolmogorov- Smirnov test (D = 2.98, p < .01). For this reason, all analyses were replicated with a classified variable for the estimation consisting of seven classes and roughly equaling a normal distribution. Again, all central results could be replicated when using this procedure.
To examine if the effects described above apply only to the effect of
underestimation or if they can explain valid estimations in general, in
analogy to Study 2, a second dependent variable (valid estimations)
was introduced. Therefore, 42 participants (10.4%) were assigned to
the first category of valid estimations, which included more or less
accurate estimations, lying within a range of 50% less and 50% more
than the true value of 238.64%. The remaining 360 participants
(89.6%) were assigned to a second category of nonvalid estimations,
including more or less inaccurate estimations. In a subsequent
binary logistic regression analysis (including the independent
variables incentives, expertise, need for cognition, and gender to
predict the dependent variable valid estimations), nonsignificant logit
coefficients for incentives (b = –.04) and expertise (b =.25) and significant positive coefficients for need for cognition (b =.55, p < .01) and gender (b =.60, p < .01) were observed.
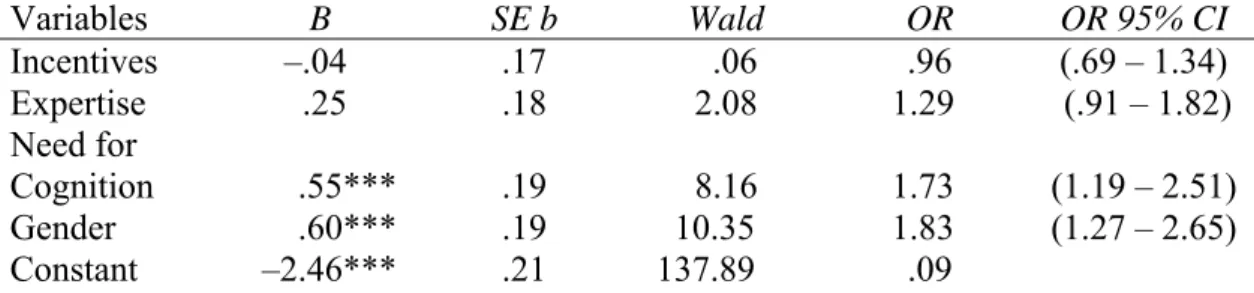
Table 2: Summary of Binary Logistic Regression Analysis. Regression Coefficients for Predictors of Valid Estimations
Variables B SE b Wald OR OR 95% CI
Incentives –.04 .17 .06 .96 (.69 – 1.34) Expertise .25 .18 2.08 1.29 (.91 – 1.82) Need for
Cognition .55*** .19
8.16
1.73 (1.19 – 2.51) Gender .60*** .19 10.35 1.83 (1.27 – 2.65) Constant –2.46*** .21 137.89 .09
Note. OR = odds ratio; CI = confidence interval
Nagelkerkes R² = .14. -2 log likelihood = 241.50. Correctly classified = 89.5%.
The dependent variable Valid Estimations was coded with 0 = No Valid Estimations and 1 = Valid Estimations. The independent variable Incentives was coded with 0 = no Incentives and 1 =
Incentives. The independent variable Expertise was coded with 0 = Laypeople and 1 = Experts. The independent variable Need for Cognition was coded with 0 = low Need for Cognition and 1 = high Need for Cognition. The independent variable Gender was coded with 0 = Female and 1 = Male.
*p < .10, **p < .05, *** p < .01
A closer look at Table 2 indicates that participants with high need for cognition displayed a 1.73-fold higher chance of providing valid estimations. Additionally, male participants displayed a 1.83-fold higher chance of providing valid estimations. However, the logit coefficient for expertise was nonsignificant. Therefore, it appears that, even though the experts provided higher estimations than the laypeople, they did not necessarily provide more valid estimations, presumably due to overestimations. A closer look at the frequency distributions reveals that this was exactly the case. Whereas only 6 laypeople (2.7%) provided estimations higher than 238.64%, 28 experts (15.56%) overestimated the true value.
In sum, Study 3 yielded four central results. First, it appears as
though the underestimations from Studies 1 and 2 were not a
consequence of lacking motivation because no effect of the incentives
on the accuracy of the estimations was found. This supports the
finding from Rydval and Ortmann (2004) that cognitive abilities are
more important than financial incentives. Second, congruent with some findings from previous research (e. g., Wagenaar & Sagaria, 1975; Eisenstein & Hoch, 2005; Keren, 1983), it was found that the underestimation of exponential growth was, in fact, stronger for those participants with less expertise in dealing with economic growth and exponential effects (the laypeople). Nonetheless, the experts also displayed a stronger tendency to overestimate exponential effects. The results of Study 2 offered the explanation that many laypeople did not recognize that the estimation of economic growth in the long run is also based on exponential growth (as is a financial investment).
Third, with the need for cognition, a personality variable was identified, which (at least to some extent) is suited to explain why some participants provide more accurate estimations than others.
Fourth, the gender effect from Study 2 did not disappear when controlling for differences in the interest in politics and economics.
This, and the fact that the other results also did not disappear when controlling for this variable, should contribute to an increased validity of the results obtained thus far.
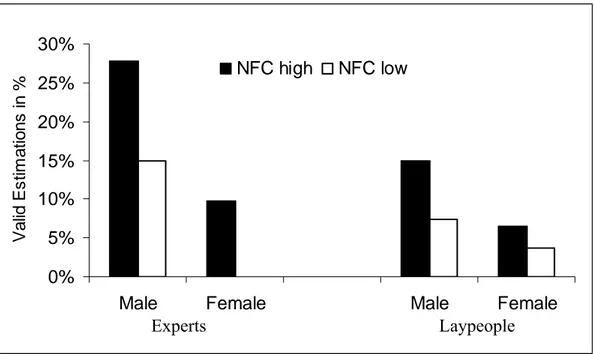
Figure 3 summarizes the central results obtained in Study 3.
0%
5%
10%
15%
20%
25%
30%
Male Female Male Female
Valid Estimations in %
NFC high NFC low
Figure 3: Valid Estimations in % by Expertise, Need for Cognition, and Gender