Educational Open Government Data in Germany
The Landscape, Status, and Quality Cornelia Veja1, Julian Hocker1, Christoph Schindler1, Marc Rittberger1,2
1 DIPF | Leibniz Institute for Research and Information in Education 2 Darmstadt University of Applied Science, Germany {veja, julian.hocker, schindler, rittberger}@dipf.de
Abstract
This paper examines the educational datasets of Open Government Portals (OGPs) in Germany. While OGPs has become an important player in making public data available, the quality and coverage are increasingly problematized.
This study analyzes the quality of 28 OGPs, 18 on the city-level, seven on the state-level (the city-states of Berlin, Hamburg, and Bremen were counted as states), and three at the national level. The focus of this study is on identifying the gap in open educational data. The results show that the total number of datasets and the educational data varies very much between the portals. While the portals contain 94% ‘open’ datasets, most of the portals do not provide com- prehensive usage metrics like the data download, evidence of usage in research or applications. Finally, the paper highlights the main shortcomings of the exist- ing open data portals regarding the quality of datasets and the lack of findability and granularity.
Keywords: open data; OGD – Open Government Data; OGP – Open Gov- ernment Portals; open education; German open data portals; local government;
municipality; usability
1 Introduction
For several years open data, as part of the open movement, calls for transpar- ency and collaboration for the benefit of the society at large.
A range of public administration followed this so-called open government movement and established Open Government Portals (OGP). While these developments resulted in various policies, concepts of use, and different un- derlying technologies with a diversity of content, functionalities, and appro- priateness, the metadata quality, content relevance, and format proved crucial in the endeavor to re-use the data.
This paper’s motivation lies in these challenges by following the question:
What is the current status and quality of open government data portals in Germany? Therefore, this paper presents an analysis of currently available portals on the national and local level in Germany and aims, in particular, to understand whether these portals provide open data in a way that, in fact, facilitates their re-use and public accountability. Thereby, we especially focus on the educational content of these Open Government Data Portals (OGDPs). While domain-specific perspectives to the quality of open data are still the main desideratum, the most unrepresented domain in this respect is education (Atenas et al., 2019). Whether the role of education in producing and consuming open data is emphasized in the literature, the focus is mostly on Open Educational Resources (OER) rather than on the educational sec- tors’ administrative, economic and social context. Especially in Germany, with its heterogeneous federated educational system, the openness of related educational government data is the main basis and need for accountability and improvement.
This study analyzed 28 OGPs, from which 21 of the largest cities (three of them are city/states), four portals at the state level and three on the national level. Following Charalabidis et al. (2018), the research uses an approach that refines the information system success model and systematizes and adjusts the indicators to the educational domain. We collected the data via the API- interface and enriched it by intellectual research and by analyzing the portals.
The novelty of this study is twofold:
1. The deep, thematic study of OGPs in Germany, with a focus on educa- tion. There are not many papers in literature, except that of Wang, Chen, and Richards (2018), which assesses the Open Government Data in edu- cation. There is no paper assessing the German local Open Government Data in deep, most of the studies address only the national portal.
2. The analysis of the OGPs put emphasis on the re-usability of datasets, and provides a model and indicators to measure it.
The paper’s organization is as follows: Section 2 introduces the literature review and background of the research context on open data, Open Govern-
ment Portals, and their quality requirements. In Section 3, the research meth- odology is formulated, and the research method is described and justified.
Section 4 presents the results of open data portals quality concerning. Section 5 discusses the results concerning other studies. Finally, concluding remarks are provided in Section 6. Supplementary materials are provided at the end of this paper.
2 Research context
2.1 Open data movement
The last two decades represent important steps in establishing the definition, principles, and policies of open data, open knowledge, and open content. In 2005, the Open Knowledge Foundation published the open definition1 to establish under which conditions data and content can be seen as open. Since then, organizations, governments, and standardization bodies have been in place to establish legal and technical frameworks concerning the open defini- tion. According to the Open Data Handbook2 and Gerunov (2016), open data are “freely accessed, used, modified and shared by anyone for any purpose – subject only, at most, to requirements to provide attribution and/or share- alike”. This definition leads to two aspects of open data: the technical aspect and the legal aspect, going hand in hand. These aspects influence how open data are published and used.
Open data initiatives aim to open all non-personal and noncommercial da- ta, especially (but not exclusively) all data collected and processed by gov- ernment organizations. In 2007, the Open Government Working Group3 es- tablished the eight fundamental pillars that support the concept of open data.
The data should be: complete, primary, timely, accessible, machine-pro- cessable, non-discriminatory, non-proprietary, and under a free license.
These are superseded in 2013 when the International Open Data Charter launched the foundation for access to data and the release and use of admin-
1 https://opendatacharter.net/the-open-definition/
2 https://opendatahandbook.org
3 https://public.resource.org/open_government_meeting.html
istrative data in six principles: open by default, timely and comprehensive, accessible and usable, comparable and interoperable, for improved govern- ance and citizen engagement, for inclusive development and innovation (Open Data Charter).
The six principles aim at a globally-agreed set of aspirational norms for publishing open data as a pre-requisite of all activities related to open data.
To implement these, it is recommended to take into account the respective national political and legal framework. While some aspects of open data quality align with the ones of web portals, domain-specific quality perspec- tives in the context of open data (e.g., data management system, the openness of provided data based on the license or format, metadata) need to be identi- fied and evaluated.
2.2 Open data and education
Whether the role of education in producing and consuming open data is em- phasized in the literature, the focus is mostly on Open Educational Resources (OER), rather than on the administrative, economic and social context of educational sectors. Education is seen as one of the most under-represented domains in open data (Atenas et al., 2019).
The results of several international open data surveys pose questions about open data and its challenges, especially in education: The United Na- tions E-Government Survey, an assessment containing specific questions about open data since 2014, covering 194 countries in the eight editions of the survey, remarks, as a common approach for data gathering, data are often in non-machine-readable format, for example, in PDF. While non-machine-rea- dable data has doubled in the past two years across various sectors, machine- readable datasets increase incrementally (United Nations, 2018). In Edu- cation, the number of countries providing machine-readable formats increas- es from 39 (2016) to 69 (2018), as the non-machine-readable formats decreas- es from 91 in 2016 (United Nations, 2016) to 88 in 2018 (United Nations, 2018).
Further on, the Open Data Barometer4 peer-reviewed expert survey cov- ered 155 countries in 2017, and the Global Open Data Index covered 94 coun- tries in 2016/2017. In the last edition, Open Data Barometer assesses primary and secondary education performance data.
4 https://opendatabarometer.org/
2.3 Open data in Germany
Germany’s engagement in open data started in 2013 when the G8 countries adopted an Open Data Charter. The German action plan was adopted in 2014 and contained four commitments (Wiebe, 2020):
1. a clear direction signal for open data in Germany 2. the publication of records
3. the publication of the data on a national portal
4. measures for consultation, engagement, and exchange of experience.
The third commitment became a fact in 2015, when the national portal GovData.de was created to implement the National Action Plan. GovData.de aggregates datasets from local OGPs and various public institutions.
On May 18, 2017, the German Bundestag passed the draft first law to amend the E-Government Act presented by the Federal Minister of the Inte- rior. The draft law specifies central criteria for open data. This includes, in particular, free provision, free access to the data, and machine readability (Klein, 2017). On March 27, 2019, the federal government started the consul- tation process on the second national action plan for the open government partnership in response to the increasing public interest in open data. Corre- lated with the EU Directive 2019/1024 of June 20 (European Commission, 2019), Germany established in September 2019 the second national action plan for 2019–2021.
As part of the local contribution to the second national action plan of the open government partnership, a primer initiative offers an overview of which data sets are being made available by Germany’s cities and towns for the first time. As a first step, the catalog contains the generally accessible data sets published by communities in the state of North-Rhine-Westphalia.5
The Open Data Barometer6 scores Germany at 60% openness because of a lack of machine-readable format, open license or dataset identifiers. The European Data Portal yearly report (EU28+ Open Data Maturity of 2019) describes Germany’s open data quality level as below average, at 63% (65%
EU level). The usage of open data portals and open data awareness are re- ported on an ascendant trend. Overall, Germany scores slightly above the EU average (68%, and 66% respectively) (Blank et al., 2019).
5 https://okfn.org/
6 https://opendatabarometer.org/?_year=2017&indicator=ODB
2.4 Evaluating open government data
At a broader level, an early study from 2012, driven by the Technical Univer- sity of Dresden, surveyed the top 50 open data platforms retrieved from the Open Knowledge Foundation catalog. The study benchmarked those reposi- tories regarding the re-usability of open data (Braunschweig et al., 2012). The reports of the Open Data Barometer are more up-to-date. In the same way, Open Data Monitor7 provides information about dataset consistency automat- ically obtained from open data portals across Europe. The general approach of this kind of report is rounded-off with an assessment of sectors, like edu- cation.
Other studies focus mostly on the non-technical aspect of open data, dis- cussing policies and legal coverage, social impact, and future possible devel- opment (Wiebe, 2020). In the same category, the authors investigate the rela- tionship between the objectives of open government data initiatives and the benefits delivered (Zuiderwijk et al., 2019). They pointed out the contrast between the objectives and their attainment in open government data initia- tives (OGDI). They proved that the benefits are often in areas other than those of the open government data initiative’s objectives, and it is not clear whether the intended benefits have been delivered.
In Corrêa and Corrêa da Silva (2019), Neumaier et al. (2016), and Kubler et al. (2018), the authors have also automatically explored the quality of metadata from OGPs around the world. They assessed data portals and dis- cussed general quality issues like retrievability of the data. The papers also define a set of quality metrics for the Data Catalog Vocabulary (DCAT) metadata standard. In the same category, the recent study from Chapman et al. (2020) highlights the different mechanisms used to successfully search datasets, and concludes that “dataset search itself is in its infancy” (ibid.).
The study by Wieczorkowski (2019) focuses on the quality of access methods and proper publishing of OGD and the economic benefits. The author has identified data publication’s main problems, based on Central Repositories for Public Information (CRPI) in Poland, the USA, the UK, and Germany. At the European Union level, the study by de Juana-Espinosa Luján-Mora (2019) monitors and clusters the data collected from OGD portals in the 28 countries to showcase their similar involvement in open data.
7 https://www.opendatamonitor.eu/
Some studies focused on the province level at open government data por- tals and datasets. Noteworthy is the Chinese OGPs study driven by Wang, Chen, and Richards (2018). At the time of their study, they note the lack of a national level open government data portal in China. Similar studies have been carried out in Italy (Molinari et al., 2017), Brazil (dos Santos Brito, 2015), Columbia and Spain (Benitez-Paez et al., 2018), India (Buteau et al., 2018), and Bulgaria (Gerunov, 2016). All these papers are not domain specif- ic, except the Chinese paper (Wang, Chen, & Richards, 2018), which assesses the impact in various domains, among them education.
A comprehensive study of open data usability was carried out by Alex- opoulos (2017). The study highlighted education, health, and finances as pub- lic sector areas with major open data publication incidence. Other studies like Berends et al. (2017), Benitez-Paez et al. (2017), Corrêa et al. (2017), Mácho- vá and Lnénicka (2017), Kubler et al. (2018), Wieczorkowski (2019), Wang, Button, and Shepherd (2018), Braunschweig et al. (2012), Schmidt et al.
(2016) and Zuiderwijk et al. (2019) identified the following main barriers preventing the re-usability of open datasets: public engagement, culture, eco- nomic, political and technical factors.
In recent years, several projects focused on open data in Germany and took steps forward to establish a clear roadmap of what open data of Germa- ny stands for, and intending to clarify the classification of open datasets and their providers. One of these projects is Open Data Map.8 The project aimed to provide a complete and up-to-date overview of all offers of open data from as many public bodies as possible in the public sector and make this infor- mation accessible, among other visualizations, via Germany’s map. The out- come of the project mirrors the status of open data of 2014, in an intuitive visual map, regardless of the content and theme of the datasets.
3 Methodology for OGPs study
This section presents the methodology for assessing German OGPs quality, grounded in the existing literature and adapted for the current research pur- pose. The methodological approach focuses on the objective study of OGPs, considering the potential usage in educational research. The approach refines
8 https://www.open-data-map.de
the information system success model (Charalabidis et al., 2018) with the metrics from the usability model (Osagie et al., 2017) appropriate to the edu- cational field.
The Information System (IS) success theoretical model was first devel- oped by William H. DeLone and Ephraim R. McLean in 1992. The most widely used system success model is the one by DeLone and McLean: Model of IS Success, developed in 2003. It proposes seven IS success measures, which are structured in three layers:
1. first layer: ‘information quality’, ‘system quality’ and ‘service quality’, 2. second layer: affecting ‘user satisfaction’, and
3. third layer: ‘actual use’ of the IS.
The model proposed by Charalabidis et al. in 2014, for the evaluation of the advanced second generation of OGPs, was primarily based on the IS success model. The new model adopts a layered evaluation approach and includes measures of both information and system quality.
The usability model proposed by Osagie et al. in 2017 refines the second and third layers of the IS success model, envisaging the third generation of OGD. These models emphasize capabilities like linked data, open collabora- tion (interagency, and with the public), the possibility of co-creating value- added services, learnability, accessibility, and feedback.
Starting from the aforementioned models of Open Government Data in- dexes resented in Charalabidis et al. (2018), Osagie et al. (2017), and the spec- ificity of educational subject, the analysis considers the following perspec- tives and dimensions to signal the portal quality, presented in Table 1.
Table 1: The indicators for the study
Dimensions Perspectives Description Literature reference correspondence 1. System
quality 1.1 Type of portal direct provider or aggrega-
tor collaboration spaces in
Charalabidis et al. (2018) 1.2 Data provision providing an API, web
interface for search Charalabidis et al. (2018), accuracy in Osagie et al.
(2017) 2. Information
quality 2.1 Thematic
perspective Portal provides a categori- zation of the datasets upon subjects.
availability and access di- mension in Máchová et al.
(2018) 2.2 Number of
education datasets group of education datasets Charalabidis et al. (2018) 2.3 Number of
organizations number of organizations that collaborate in the portal for education datasets
de Juana-Espinosa et al.
(2019)
Dimensions Perspectives Description Literature reference correspondence 2.4 Content
format number of machine- readable formats against non-machine-readable formats (per resources)
Charalabidis et al. (2018), availability and access di- mension in Máchová et al.
(2018) 2.5 Metadata
format the metadata openness and
metadata capabilities Charalabidis et al. (2018), Mons et al. (2017) 2.6 Metadata
semantic Metadata use a formal, accessible, shared, and broadly applicable language for knowledge representa- tion.
metadata interoperability in Mons et al. (2017)
2.7 PID, ID persistent identifier or at
least permalink Charalabidis et al. (2018), Mons et al. (2017) 2.8 Information
granularity9 raw or aggregated content Atenas and Haverman (2019) 2.9 Keywords
(tags) presence and representation
using keywords or a tag system, other than thematic categorization, helping users in searching datasets
learnability, accesibility in Osagie et al. (2017), availa- bility and access dimension in Máchová et al. (2018), Chapman (2020) 3. Service
quality 3.1 Licenses number of open licenses
against close, or no licenses Máchová et al. (2017), Cha- ralabidis et al. (2018), de Juana-Espinosa et al. (2019) 3.2 Quality rating
and feedback mechanisms
users interaction with the portal, in the form of blogs, user’s activity, users rating
co-creating and value-added services in Charalabidis et al. (2018), communication and participation dimension in Máchová et al. (2018) 3.3 Number of
applications number of reported open
data applications (re-use) de Juana-Espinosa et al.
(2019), co-creating and value-added services in Charalabidis et al. (2018)
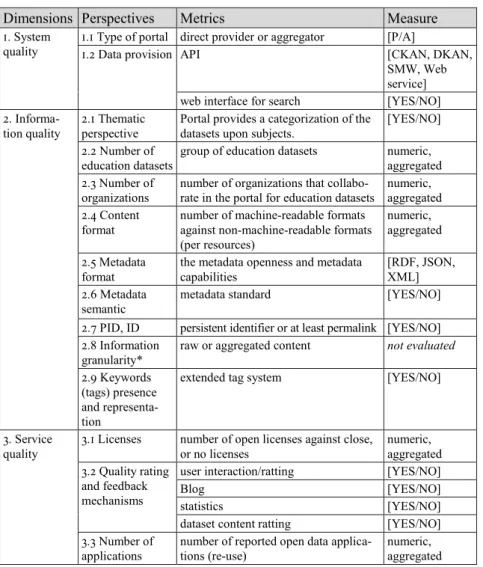
For the operationalization, several metrics are defined in the form of quantifiers or descriptive variables. The taxonomy of OGPs metrics is pre- sented in Table 2.
The analysis methodology adopted in this section comprises four main stages: raw data collection, data aggregation, data processing and data analy- sis. These stages are described in detail below.
9 The current research does not evaluate the information granularity.
3.1 Data collection
For the data we selected the portals on three different levels: on national level, state level, and the level of the largest cities (March, 2020). Further criteria for selection have been:
1. Educational datasets: The portals were considered when either the group name containing the word ‘Education’ [German: Bildung] is explicitly set up at the inception of the OGP, or if this group not exists, the search inter- face and specific keywords were used to identify the ‘Education’ datasets.
2. The underlying software offers an API needed for automatic processing.
The final sample consists of 28 OGPs, 18 on the city-level, seven on the state- level (the city-states of Berlin, Hamburg, and Bremen were counted as states), and three at the national level.
This analysis considers two categories of OGPs: One category contains OGPs direct providers, whereas the other category considers the OGPs that are aggregators.
Collecting and normalizing the features of an OGP is quite challenging because a standard that all mentioned administrations accept and apply does not exist. All data were collected semi-automatically, employing an online search of the OGP by country, state, district, and city.
System quality
The survey used the search web interface of each OGP for collecting the type of portal and the provision capabilities (Table 1: 1. System quality).
Information quality
Where the open data portal is powered by CKAN10 or DKAN11, as specialized tools for a data management system that makes open data accessible, they always provide an API. This facility was used to collect data concerning the number of organizations, keywords, metadata format, PID, content format, and licenses. For the rest of the perspectives, the manual method was used (Table 1: 2. Information quality).
Service quality
Data were collected manually by searching each of the OGPs web interfaces (Table 1: 3. Service quality). After completing the data acquisition and collec-
10 https://ckan.org/about/
11 https://getdkan.org/
tion, we performed data cleaning on the resulting dataset to identify and cor- rect possible errors such as missing values, outlier values, or different data for- mats (Neumaier, 2016). This guarantees the highest degree of data reliability.
3.2 Data aggregation and processing
Considering the literature and the model presented in Table 1, the following numeric variables were calculated in the first step:
Table 2: Metrics and Measures
Dimensions Perspectives Metrics Measure
1. System
quality 1.1 Type of portal direct provider or aggregator [P/A]
1.2 Data provision API [CKAN, DKAN,
SMW, Web service]
web interface for search [YES/NO]
2. Informa-
tion quality 2.1 Thematic
perspective Portal provides a categorization of the
datasets upon subjects. [YES/NO]
2.2 Number of
education datasets group of education datasets numeric, aggregated 2.3 Number of
organizations number of organizations that collabo-
rate in the portal for education datasets numeric, aggregated 2.4 Content
format number of machine-readable formats against non-machine-readable formats (per resources)
numeric, aggregated 2.5 Metadata
format the metadata openness and metadata
capabilities [RDF, JSON,
XML]
2.6 Metadata
semantic metadata standard [YES/NO]
2.7 PID, ID persistent identifier or at least permalink [YES/NO]
2.8 Information
granularity* raw or aggregated content not evaluated 2.9 Keywords
(tags) presence and representa- tion
extended tag system [YES/NO]
3. Service
quality 3.1 Licenses number of open licenses against close,
or no licenses numeric,
aggregated 3.2 Quality rating
and feedback mechanisms
user interaction/ratting [YES/NO]
Blog [YES/NO]
statistics [YES/NO]
dataset content ratting [YES/NO]
3.3 Number of
applications number of reported open data applica-
tions (re-use) numeric,
aggregated
Following Charalabidis et al. (2018), Open Data Platforms capabilities also include descriptive variables about datasets and sources, functionalities provided by the Open Data Portals in terms of dataset discovery, data provi- sion capabilities, and data visualization. These qualitative metrics were ag- gregated in a second step (see Table 2).
4 Survey results
Table 3 shows all 28 analyzed Open Government Data Portals (OGDPs) with some main metrics. 18 portals are from the largest cities. Seven further rele- vant portals have been identified at the level of states, whereby Berlin, Ham- burg, and Bremen are city-states. Three have been found on the national lev- el. While the 25 portals of the city and state levels create data by themselves (data providers), the three national portals aggregate data.
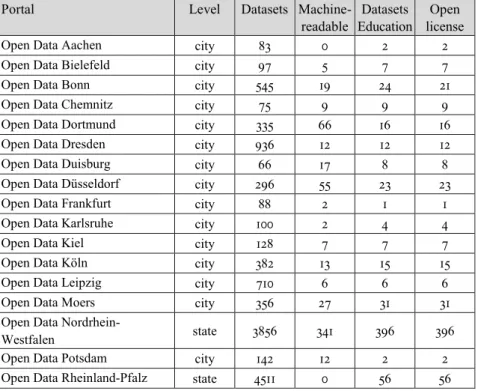
Table 3: Several metrics of 28 Open Government Data Portals
Portal Level Datasets Machine-
readable Datasets
Education Open license
Open Data Aachen city 83 0 2 2
Open Data Bielefeld city 97 5 7 7
Open Data Bonn city 545 19 24 21
Open Data Chemnitz city 75 9 9 9
Open Data Dortmund city 335 66 16 16
Open Data Dresden city 936 12 12 12
Open Data Duisburg city 66 17 8 8
Open Data Düsseldorf city 296 55 23 23
Open Data Frankfurt city 88 2 1 1
Open Data Karlsruhe city 100 2 4 4
Open Data Kiel city 128 7 7 7
Open Data Köln city 382 13 15 15
Open Data Leipzig city 710 6 6 6
Open Data Moers city 356 27 31 31
Open Data Nordrhein-
Westfalen state 3856 341 396 396
Open Data Potsdam city 142 12 2 2
Open Data Rheinland-Pfalz state 4511 0 56 56
Portal Level Datasets Machine-
readable Datasets
Education Open license
Open Data Rostock city 221 84 14 14
Open Data Wuppertal city 178 2 3 3
Open Data-Portal München city 153 2 2 2
Berlin Open Data state/city 1655 86 14 12
Open Data Bavaria state 901 110 55 55
Open Data Schleswig-Holstein state 8272 254 372 367
Transparenzportal Bremen state/city 153 1 3 3
Transparenzportal Hamburg state/city 112,588 14 2426 2426 Federal Ministry of Education
and Research nation 264 180 264 264
GovData.de nation 35,660 4061 2882 2521
Municipal Education Database nation 816 2448 816 816
4.1 System quality
The analysis discovered 25 OGPs, which, as direct providers, publish open datasets in the field of education. They are at the city/state level. This survey counts 21 portals (three of them are also states) from cities having more than 100,000 inhabitants. Other OGPs (three) are aggregators at the national level.
With eight exceptions, all of them use CKAN12 as underlying software. Also, with two exceptions, all OGPs use either CKAN-API or DKAN-API13. One of the portals has a web service with similar functionality to CKAN-API. The web interface for searching provides advanced search capabilities for all the portals analyzed. All of them provide the capability to filter the information using several degrees of flexibility and dimensions. Most of them use CKAN as underlying software and CKAN-API (19 on their own, five via the national portal CKAN-API, and four via other kinds of web service) for automatic access.
The aggregators (the Federal Ministry of Education and Research and the Municipal Education Database) use a custom web service for automatic ac- cessibility. The national portal uses CKAN-API.
12 https://docs.ckan.org/en/2.9/api/
13 https://dkan.readthedocs.io/en/latest/introduction/index.html
4.2 Information quality
We used several metrics to analyze information quality:
Thematic perspective. All of the OGPs group open datasets in themes.
The themes differ slightly, depending on the various approaches adopted at the inception of each portal and/or administrative and stewardship reasons.
The number of datasets in education. This survey counts 7473 datasets in the education group for the whole of Germany. Most of the datasets are ag- gregated by the national portal, GovData.de, and OGP Hamburg.
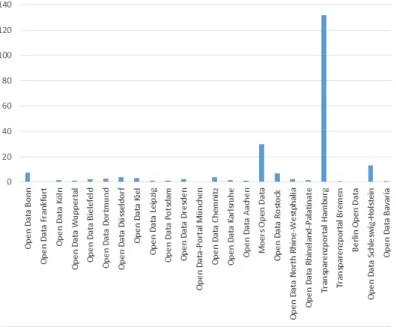
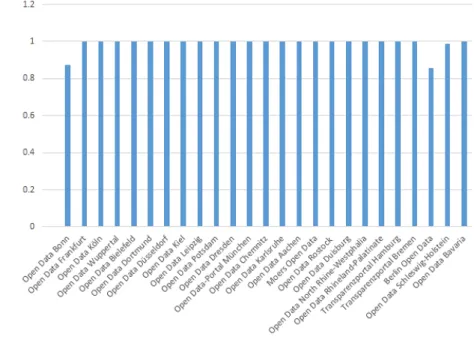
Following de Juana-Espinosa (2019) and Yang and Wu (2016), the number of datasets concerning the population could be a measure of the possible usefulness of the portal. Therefore, Figure 1 depicts the number of datasets in education per 100,000 inhabitants of direct providers:
Fig. 1 Number pf educational datasets/100.000 inhabitants of direct providers See Figure 6 (a/b) for aggregator’s numeric evaluation.
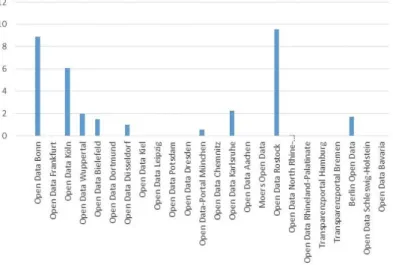
The number of organizations. The number of organizations that contribute to the OGDPs varies from one to 19. This is an indicator that demonstrates the organizations’ engagement in providing content to the portal and co- creating public knowledge as part of the ecosystem (Yang & Wu, 2016). Fig-
ure 2 gives a glimpse of this indicator for direct providers, whereas Figure 6 (a/b) represent the numeric indicators of aggregators at the national level.
Fig. 2 Number of organizations/100.000 inhabitants of direct providers
The number of machine-readable formats. This number represents how many of the resources might be re-usable by automatic applications.
Fig. 3 The number of machine-readable formats/total number of resources formats of direct providers
The number of machine-readable formats per total number of resources content formats is represented in the Figure 3. This indicator is calculated at the resource level.
In the same way, Figure 6 (a/b) represents the number of machine-rea- dable formats per total number of resources of aggregators at the national level.
Metadata format. In terms of metadata semantics, the most important ini- tiative that a data portal should accommodate to facilitate interoperability, is an RDF vocabulary named Data Catalog Vocabulary (DCAT) by the World Wide Web Consortium (W3C).14 Using DCAT to describe datasets, publish- ers increase discoverability and enable applications to easily consume metadata from multiple catalogs (Máchová, 2017). Given the heterogeneity of the implementation at the state level, it is very desirable to consider only portals that implemented the DCAT-AP catalog standard. Of 28 OGPs, 22 adhere to the metadata format DCAT-AP15, which uses RDF.
Keywords or tags. In OGPs, tagging refers to the metadata assigned to a piece of content by the data provider. Tagging digital content enables data providers to structure, group, and order content around themes or topics, complementing the general categorization priory established by the portal administrators. The tags might be part of a vocabulary or might be termed freely, at the disposal of their creators. Also, they can be single words or compound words, as in the case of the GovData.de portal. At the cities/states level, seven OGPs are not using a system of keywords, and they rely on the coarse categorization of the thematic perspective. At the national level, only the national GovData.de portal uses an extensive system of tagging, the other two aggregators use a simple categorization of the datasets.
PID. The majority of the OGPs uses the permalinks. Only three portals use local identifiers for the PID.
4.3 Service quality
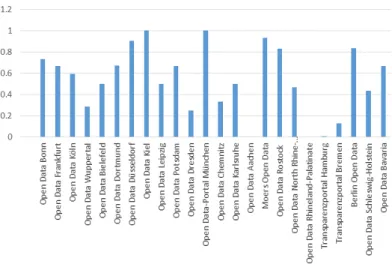
License. The number of open licenses measures the accessibility of datasets.
The ‘open license’ is 94% of the total educational datasets, as this survey assessed the open licensed as opposed to closed or non-licensed datasets. It is
14 https://www.w3.org/TR/vocab-dcat-2/
15 https://www.dcat-ap.de/
interesting to point out the type of the license is attribution (‘BY’), like ‘Data license Germany – attribution – version 2.0’, or attribution share-alike (‘BY- SA’). The zero-type license, in the German version so-called ‘Data license Germany – Zero – Version 2.0’ or equivalent, is not so popular. Figure 4 represents this numeric indicator of direct providers.
Fig. 4 Number of open licenses/total number of datasets of direct providers
At the aggregators’ level, the national portal is 95% ‘open licensed’ of the total educational datasets (Fig.6b), whereas the rest of the aggregators are 100% ‘open licensed’, as is represented in Figure 6a.
Quality rating and user feedback measure the accuracy of the OGP. The accuracy is the measure of meeting the information need by the user. For OGP Hamburg and OGP Berlin, it was possible to assess the number of users’ views (via API or web interface) for 2019, as they provided the statisti- cal data as a dataset. Unfortunately, Hamburg has stopped counting the num- ber of views in September 2019.
Several other portals present data ranking (Bonn, Potsdam, Bavaria) or blogs (Bonn, Cologne, Bielefeld). The adoption of blogs is mostly related to the DKAN software, or in the case of Bonn, with Semantic MediaWiki soft-
ware16. Both of them are content management systems based software, which allows for genuine user interaction.
It is worth to mention Open Data Schleswig-Holstein, as the portal pre- sents a resources content classification upon 5 stars scale of Berners-Lee model17 on their web interface. This aspect gives a better chance for datasets re-usability (Farrow, 2014).
The number of applications reported by each of the OGPs is unknown in most portals; only eleven from 28 present this information in their web inter- faces.
Re-use of data is considered a crucial indicator of OGP success since there is a symbiotic relationship between users and producers of Open Government Data (de Juana-Espinosa, 2019; Osagie, 2017). Figure 5 represents the number of application reported for direct providers.
Fig. 5 Number of applications/100.000 inhabitants of direct providers
For the national portal, GovData.de, we use external information to assess the number of applications built on the datasets.
For the other aggregators at the ministries level, this study cannot find any references to the applications using directly their datasets.
16 https://www.semantic-mediawiki.org/wiki/Semantic_MediaWiki 17 https://5stardata.info/en/
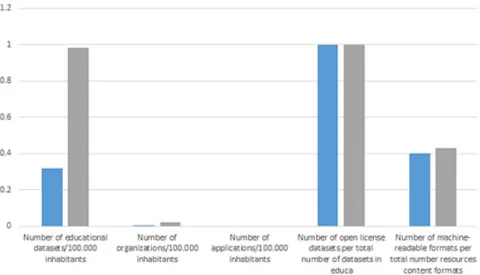
Fig. 6 National aggregators’ numeric indicators; a: on the top figure, the Federal Ministry of Education and Municipal Educational Database; b: on the bottom, GovData.de
5 Discussion
There are not many papers in literature, except that of Wang, Chen, and Richards (2018a) for China, which assesses the Open Government Data in education, at the local level. Other studies identified the main barriers pre- venting the re-usability of open datasets. A comprehensive study of open data usability was carried out by Alexopoulos (2017). The study highlighted education, health, and finances as public sector areas with major open data publication incidence, without a deep assessment of the quality of the da- tasets. Studies like Open Maturity Report, Open Data Barometer consider for evaluation only the datasets of GovData.de. The deep, thematic study of OGPs in Germany, with a focus on education, is still missing.
In the category of direct providers (cities/states), the OGP of the city of Rostock performs the best. This high score is given by the number of report- ed applications and a high number of machine-readable formats of datasets. It also adheres to CKAN-API and DCAT catalog format and presents statistics about the usage of the datasets. The city/state of Hamburg portal, even as they collect the highest number of educational datasets, needs improvements on the machine-readable format perspective, publishing most datasets in PDF format.
Open Data Bonn is one of the most interesting OGPs, performing well on the descriptive metrics but not very high on the quantitative metrics. Also, using a non-standard metadata format is a serious minus for this portal.
Open Data Bavaria portal was highly neglected in the last years; the last update of datasets dates back to 2015 at the time of this writing.
At the national level, the Federal Ministry of Education and Research and the Municipal education database aggregate datasets from the Federal Statis- tical Office 18. There are several drawbacks, as they do not adhere to DCAT- AP standards, and access via API for third party applications is not easy.
These portals lack reported application, interoperability, and metadata stand- ardization.
On the second category of aggregators (national level), the national portal GovData.de performs best on all dimensions. They do not report the number of applications on the website, and user feedback capability was only recent- ly considered.
18 https://www.destatis.de/
Overall, the service quality analysis signals an important drawback: The service’s effectiveness cannot be measured due to the lack of important parameters: users’ feedback, blogs, statistics of usage, and data ranking.
The 2020 Open Maturity Report19 of EU27+ situates Germany in the 8th place, up from 14th place in 2019. This report considers only the national portals at the EU level, not very relevant for federative countries. The the- matic perspective is missing in the EU report; the open data in education is considered within the large mass of other open data. The report also men- tioned that “Germany is one of the few countries where the national portal does not have a designated area for open data use cases”, which is also re- ported in this study.
6 Conclusion
Our paper provides a preliminary overview of the quality of Germany’s OGPs, including the perspective of usage in educational research. The study evaluates the OGPs at the city/state and national levels.
The study refines the information system success model from the indexed literature, put the emphasis to the re-usability, and attached evaluation metrics. The objective analysis considers descriptors and quantitative metrics for OGPs, with an emphasis on educational research. The analysis of the main 28 OGPs in Germany draws the following conclusions:
1. There is a solid German open data policy at the national level, which adheres to The European Directive 2019/1024 of June 20 (European Commission, 2019; Wiebe, 2020). This was also pointed out to the Euro- pean Commission in other studies, like the EU28+ Open Data Maturity Report, in Blank (2019).
2. This study collected and analyzed around 7400 educational datasets and over 16,000 resources. The largest provider of educational data is Ham- burg, and the largest aggregator is GovData.de.
3. Very few portals provide direct metadata or indirect (via the program- matic API) access to the usage metrics (i.e., views and download) in each portal. The national OGP GovData.de published only statistics of the
19 https://www.europeandataportal.eu/en/dashboard/2020#table
search queries. This practice makes it less immediate for researchers to evaluate a dataset’s reception that might be of interest. This fact also leads to a disruption in feedback information for dataset providers, as they cannot assess their work’s final impact.
4. There is also a lack of machine-readable formats. One of the most im- pressive portals in terms of the number of educational datasets, OGP Hamburg, publishes most of the datasets in PDF format. This is a serious drawback of the re-usability of the OGPs datasets, and automatic tools cannot find and use the appropriate content they are searching for.
5. The German version of metadata standard DCAT is used by 22 of the 28 portals, indicating that standardization is being used, but all portals should use it to enable better search in all portals. This standard, intro- duced by GovData.de, is aligned with high metadata standards (RDF), enabling better metadata interoperability, and this is a good start to a much more usage-oriented approach towards Linked Open Data. How- ever, since not all OGPs use the metadata standards of GovData.de, it is not possible to find data from all cities/states in this portal. However, the usage of keywords is also not standardized, which made our data collec- tion harder.
6. One of the best perspectives of the service quality dimension is licensing.
94% of the datasets are using an open license. The national portal GovData.de performs slightly better, 95%.
We have found the open educational data also have other possibilities of usage: The people involved in schools and education could profit from this data: teachers, parents, and people working in school administration. Since Germany’s educational system is very heterogeneous, this study would also help compare the situation in the different states. Another potential of this study results might help guide parents who plan to move to another state with a different educational system.
In Germany, one large study about the educational system is the so-called
“Bildungsbericht”20 [English: Education Report]. This report gives an over- view of the educational system in Germany every two years. In recent years, the trend is to have these reports at the state-level. These studies may benefit from this paper’s results by making them more comprehendible to the public.
As part of our study, we encountered school data published in non- machine-readable formats on other local platforms with low accessibility
20 https://www.bildungsbericht.de/de
during this research. Bringing all this data together at the OGPs level would yield a great benefit and enable comparison among cities and states respec- tively. An easy presentation of this data also allows the general public to get deeper insights into the educational system and make educational research and educational policy more transparent.
7 Limitations of this work
For a comprehensive analysis of the topic, the information system success model allows for additional perspectives (Charalabidis, 2018). At the current stage of our research, the limitation of access to the relevant data prevented us from exploring them. For example, an important drawback is that no OGP shows how often a dataset has been downloaded. This information would give great feedback on the usage of the datasets. Only the OGPs of Hamburg and Berlin present a statistic of datasets views monthly. Both of the portals present search terms frequency statistics in two different formats. Only one OGP presents a statistic of datasets download and links to applications that use datasets from that portal (Open Data Rostock). Providing this infor- mation would primarily help the OGDs see what kind of data is used most, and it would also allow researchers to see what the most used data are across several OGDs, encouraging other OGDs to provide the same kind of data.
This study might be framed to a larger extent, for example, in a compara- tive study of educational Open Governmental Data of other federative coun- tries, like Switzerland or the USA.
Acknowledgements
This research was funded in the context of the eHumanities Center CEDIFOR by The German Federal Ministry of Education and Research (BMBF) no.
01UG1416C.
Supplementary materials
Supplementary material associated with this article can be found at DOI:
doi.org/10.5281/zenodo.4277847.
References
Alexopoulos, C., Diamantopoulou, V., & Charalabidis, Y. (2017). Tracking the Evo- lution of OGD Portals: A Maturity Model. In Janssen M. et al. (Eds.), Electronic Government. EGOV 2017. Cham: Springer International Publishing. DOI:
https://doi.org/10.1007/978-3-319-64677-0_24
Alves Neto, A. J., Neves, D. F., Santos, L. C., Rodrigues Jun., M. C., & do Nasci- mento, R. P. C. (2018). Open Government Data Usage Overview: A Systematic Literature Mapping. In Euro American Conference on Telematics and Infor- mation Systems (EATIS ’18), Fortaleza, Brazil. New York, NY: ACM. DOI:
https://doi.org/10.1145/3293614.3293619
Atenas, J., & Havemann, L. (2019). Open data and education. In T. Davies, S. Walk- er, M. Rubinstein, & F. Perini (Eds.), The State of Open Data: Histories and Ho- rizons (pp. 91–102). Cape Town, Ottawa: African Minds and International Devel- opment Research Centre.
Atenas, J., Havemann, L., Nascimbeni, F., Villar-Onrubia, D., & Orlic, D. (2019).
Fostering Openness in Education: Considerations for Sustainable Policy-Making.
Open Praxis, 11(2), 167–183.
Benitez-Paez, F., Degbelo, A., Trilles, S., Huerta, J. (2018). Roadblocks Hindering the Reuse of Open Geodata in Colombia and Spain: A Data User’s Perspective.
ISPRS International Journal of Geo-Information, 7(1), 6.
Berends, J., Carrara, W., Engbers, W., & Vollers, H. (2017). Re-using Open Data.
Technical Report. Luxembourg: Publications Office of the European Union.
Blank, M. (2019). The Open Data Maturity Report 2019. European Commission and Capgemini Invent. doi: 10.2830/073835
Braunschweig, K., Eberius, J., Thiele, M., & Lehner, W. (2012). The State of Open Data – Limits of Current Open Data Platforms. In Proceedings of the 21st World Wide Web Conference 2012, Web Science Track at WWW’12, Lyon, France, April 16–20, 2012. New York, NY: ACM.
Buteau, S., Rao, P., Mehta, A. K., & Kadirvell, V. (2018). Developing a Framework to Assess Socio-Economic Value of Open Data in India. In Proceedings of The 14th International Symposium on Open Collaboration – OpenSym ’18 (Article No. 8). New York, NY: ACM, DOI: https://doi.org/10.1145/3233391.3233532 Chapman, A., Simperl, E., Koesten, L., Konstantinidis, G., Ibáñez, L.-D., Kacprzak,
E., & Groth, P. (2020). Dataset search: a survey. The VLDB Journal, 29, 251–272.
DOI: https://doi.org/10.1007/s00778-019-00564-x
Charalabidis, Y., Zuiderwijk, A., Alexopoulos, C., Janssen, M., Lampoltshammer, T., & Ferro, E. (2018). Open Data Evaluation Models: Theory and Practice.
In The World of Open Data. Concepts, Methods, Tools and Experiences (pp.
137–172). Cham: Springer International Publishing.
Corrêa, A. S., & da Silva, F. S. C. (2019). Laying the foundations for benchmarking open data automatically: a method for surveying data portals from the whole web. In dg. o 2019: 20th Annual International Conference on Digital Government Research, 2019, Dubai, United Arab Emirates (pp. 287-296). New York, NY:
ACM. DOI: https://doi.org/10.1145/3325112.3325257
Corrêa, A. S., Couto de Paula, E., Corrêa, P. L.P., & da Silva, F. S. C. (2017). Trans- parency and open government data: A wide national assessment of data openness in Brazilian local governments, Transforming Government: People, Process and Policy, 11(1), 58–78. DOI: https://doi.org/10.1108/TG-12-2015-0052
de Juana-Espinosa, S., & Luján-Mora, S. (2019). Open government data portals in the European Union: Considerations, development, and expectations. Technological Forecasting and Social Change. 149(Dec.), Art. No. 119769. DOI: 10.1016/
j.techfore.2019.119769
dos Santos Brito, K., da Silva Costa, M. A., Cardoso Garcia, V., & de Lemos Meira, S. R. (2015). Is Brazilian Open Government Data Actually Open Data? An Anal- ysis of the Current Scenario. International Journal of E-Planning Research, 4(2), 57–73.
European Commission. 2019. Directive 2019/1024 of June 20, 2019 on open data and re-use of public sector information. Official Journal of the European Union, L 172/56, June 26, 2019.
Fane, B. (2019). What is the State of Open Data in 2019? In The State of Open Data 2019 – A selection of analyses and articles about open data. Figshare, Digital Science. https://knowledge.figshare.com/articles/item/state-of-open-data-2019 Farrow, R. (Ed.) (2014). Open Education Handbook. http://education.okfn.org/hand-
books/handbook/
Gerunov, A. (2016). Understanding Open Data Policy: Evidence from Bulgaria.
International Journal of Public Administration. 40(8), 1–9. DOI: 10.1080/
01900692.2016.1186178
Katte, A. (2017). Open Data Movement and its impact on the world. https://your- story.com/2017/10/open-data-movement-and-its-impact-on-the-world
Klein, M. (2017). Was ist Open Data? e-Government Computing. 27.2.2017. https://
www.egovernment-computing.de/was-ist-open-data-a-693134/
Kubler, S., Robert, J., Neumaier, S., Umbrich, J., & Le Traon, Y. (2018). Comparison of metadata quality in open data portals using the Analytic Hierarchy Process.
Government Information Quarterly, 35(1), 13–29. DOI: https://doi.org/10.1016/
j.giq.2017.11.003