The Academic Takes it All? A Comparison of Returns to Investment in Education between Graduates and Apprentices in Canada
Susanne Kopatz University of Bremen
Institute Technology and Education (ITB) Am Fallturm 1, 28203 Bremen, Germany E-mail: Kopatz@uni-bremen.de
Matthias Pilz*
University of Cologne
G.R.E.A.T. (German Research Center for Comparative Vocational Education and Training)
Herbert-Lewin-Str. 2, 50931 Cologne, Germany E-mail: Matthias.pilz@uni-koeln.de
* Corresponding author
Received 01 June 2015; Accepted: 28 September 2015; Published online: 27 December 2015
Abstract: This paper analyses the returns to education of specific occupations in Canada. The purpose is to scrutinize whether and in how far academic and vocational education do differ in monetary benefits regarding individual returns.
Therefore, two different methodologies of calculation are used to compute the concrete returns to education. As a result it is shown empirically that within the here selected occupational groups (e.g. librarians and electricians) there is no decisive earnings benefit regarding academic careers, although a positive correlation of income level and educational achievement can be verified. Our findings justify revisiting the underlying assumption that vocational education and training cannot generate benefits comparable with those generated by higher education. The earnings data suggest that monetary aspects may be less crucial than generally assumed to the reputation and perceived value of vocational education and training. Therefore, social status and prestige seem to be the most significant contributory factors to vocational training’s low status in Canada.
Keywords: Returns to Education, Educational Economics, Investment in Education, Canada, Vocational Education and Training, Graduation, Individual Returns, Occupations
Bibliographical notes:
Susanne Kopatz, M.Sc., is a research associate at the Institute Technology and Education at the University of Bremen. She studied Economics at the University of Cologne (M.Sc. Economics). Her research interests focus on educational economics and vocational education and training systems in different countries.
Prof. Dr. Matthias Pilz is full Professor of Economics and Business Education at the University of Cologne. After finishing his initial teacher training in 2002, he started his teaching career at the Wirtschaftsschule (Business-College) Herrenhausen in Hannover and was simultaneously advisor for EU education projects at the district government of Hannover. In the years 2002 to 2004 he worked as research associate for the Institute of Business Education and Educational Management at The University of St. Gallen/Switzerland before becoming a full professor for general economic studies in pre vocational education at the Freiburg University of Education. Since 2009 he is a full professor at the University of Cologne and Director of the G.R.E.A.T. (German Research Center for Comparative Vocational Education and Training) and since 2010 of the CMIS- UC (Center for Modern Indian Studies at the University of Cologne).
His research interests are: international comparative research in vocational education and training, research in transition from the education to the employment system and research into teaching and learning.
1 Introduction
The issue of “academic drift” has long been the subject of keen debate, particularly in the English-speaking world (see, for example, Raffe 1994). Improvement in the skills levels of a country’s population generally has a positive effect on the employability of its people and, consequently, on its economic growth (Roth and Thum 2010).
Social systems are underpinned by the monetary value attached to employment – that is, earnings. Earning money not only secures and enhances the individual’s social status; it also underpins a country’s entire social structure. Our income determines our status and standing. However, education and training, and what they mean for society, are also enormously significant for the individual. A substantial body of research has demonstrated that higher levels of qualification on the part of an individual correlate with higher social status (Lasonen and Gordon 2009). In this context, commentators often rate tertiary education more highly than vocational education and training (Lasonen and Manning 2001). For this investigation, VET is being located on the level of Secondary Education and academic education is associated to tertiary education, while the authors are aware that tertiary education can teach vocational contents as well. In the English- speaking world in particular, there is a deep-rooted perception that graduatesi can earn more and that obtaining a degree is a reliable route to higher social status, a perception that has detracted from the popularity of vocational training programmes and thereby contributed to what is known as “academic drift” – the trend towards increasingly high levels of formal education (see below).
“Academic drift” can mean two things. First, the term denotes a process in which non-university institutions aspire to operate like universities (Garrod and Macfarlane 2009, p. 9): this trend dates back to the 1970s, when polytechnics in the United Kingdom sought to adopt some of the key characteristics of universities (ibid.). Second, individuals are now seeking to obtain the highest possible level of formal qualification, which draws them in to tertiary education.
Nevertheless, there has for some years now been growing evidence of these trends causing problems in countries with a tendency towards what Raffe (1993) calls a
“top-heavy system”. Research has found, for example, that graduates face increasing difficulty in obtaining employment that reflects their skills and meets their earnings expectations (Li et al. 2006). There are also, however, complaints of a serious shortage of trained, skilled craft workers, which is hampering economic growth (ibid.).
Canada is an example of such an economy: over recent decades, the number of university students has risen substantially, from 850,000 in the 1992/1993 academic year to just under 1.15 million in 2011/2012 (Statistics Canada, Table 447-0019). The problems this is causing have prompted intense debate in Canada.ii For example, Vahey (2000) discusses the trend towards over-education and its impact – that is, the discrepancy between the requirements of a particular job and the post-holder’s level of qualification (see also Livingstone and Pankhurst 2009) – and argues that the trend towards higher levels of formal education is creating a mismatch between job specifications and individual workers’ qualifications. Vahey uses empirical data to show that workers with qualifications that exceed the requirements of their job gain no advantage in terms of earnings. This means, therefore, that their (higher) investment in education brings a lower return than the investment made by workers with lower-level qualifications. A further issue is the
funding of higher education. Among the OECD countries, Canada charges above- average university tuition fees (OECD 2013), and these fees have risen by an average of 4% a year over the past six years. More than 50% of all undergraduates owe an average of $22,000 by the time they complete their degree (Statistics Canada, National Graduates Survey 2005). Although there are both government and private funding programmes for degree-level study, there is a question-mark over whether fees at this level are contributing to social inequality and whether future generations will be able to afford higher education (Stark 2007). Tal and Enenajor (2013, 4) sum up education policy in Canada as follows: “A higher education may be a necessary condition for a good job in Canada, but it is no longer a sufficient condition”. They also point to the fact that increasing numbers of university graduates now earn less than Canada’s median income.
The central question here is whether the trend towards higher levels of formal education is bringing returns for the individuals concerned and, if so, to what extent these returns can be quantified. One model that embraces both the individual and the social impact of education and earnings levels is the “return to investment in education” model. This term is used here as an umbrella term for the range of benefits – yet to be defined – that an individual may derive from his or her investment in education. Setting costs against benefits means that the advantage conferred by a particular programme of education or training can be determined.
The costs of education and training derive from the use and consumption of resources. They include both direct costs, such as individual tuition fees or government funding for schools and universities, and indirect opportunity costs in the form of lost benefits and returns – the time invested in education, the earnings foregone during that time, and the loss to the state of Gross Domestic Product (Akinyemi 2013). From an economic perspective, education may be regarded as a systematic development of human capital, meaning that a monetary value can be attached to it by comparing its cost with subsequent earnings (usually calculated over an individual’s entire life). The benefit gained from the period spent in education is known as the “return to investment in education” (Psacharopoulos 1994), and this return to investment in education can be calculated actuarially. The
‘earnings’ element has huge significance for social status, so we shall be reflecting it in our work here and seeking to analyse it. By focussing on this aspect, we are in line with the discussion in the world of economics of education (see below).
Education creates enhanced expectations of future earnings, and the substantial variation in employees’ earnings across the board can, in theory, be explained using the “human capital” approach. According to Becker (1964), an individual’s education and training is regarded as boosting his or her productivity in the same way as investing in physical capital does. Part of this available capital is not immediately invested in consumer goods but is used to build capital stock, paving the way for higher spending in future. Similarly, a long period of education or training initially involves foregone earnings and opportunity costs while the individual is not earning a salary, but – according to this theory – these opportunity costs are, at the very least, offset by higher earnings later in his or her career.
Investment in their personal resources enables individuals to improve their performance, and a worker’s productivity ultimately determines his or her pay.
This, in theory, supports the view that higher levels of qualification lead to higher earnings. Any course of education or training is to be regarded as an investment, the argument goes, and as tertiary education represents a higher investment than
vocational training, it should – in theory – automatically generate a higher return in the form of enhanced earnings.
There are, however, limitations to Becker’stheory. It does not explain, for example, why companies fund initial and continuing training for their employees despite gaining no benefit from doing so when labour markets operate under conditions of perfect competition (Acemoglu and Pischke 1999). Becker argues further that subsidies and a regulatory education and training policy cannot be justified, since the market should regulate itself (ibid.). A further criticism is that Becker’s theoretical model omits the “task-specific” element of human capital (Gibbons and Waldman 2004), meaning that much of the human capital accumulated in a firm simply comes from learning by doing and therefore is hardly graspable.
A number of studies calculate and compare returns to investment in different courses of education and training, and statistics from the OECD, for example, show that vocational education and training generates a lower monetary return. Its Education at a Glance 2012 report provides evidence of the monetary added value of tertiary education, showing that, depending on their age, those completing vocational education and training in Canada earn between 10% and 14% more than those with secondary education qualifications, while those with a degree earn between 28% and 58% more (OECD 2012, 29). This major divergence applies across occupations and reflects a significant difference between the returns on secondary and tertiary education. It confirms that investing in academic education produces higher earnings later in an individual’s working life.
To what extent do these average figures really apply to specific occupational groups, though? A relatively undifferentiated view of qualifications is, perhaps, too general, so focusing on the return to investment in education may be a way to draw conclusions as to the benefits and value of courses of education and training.
The approach taken in this paper is, therefore, to calculate the return to investment in education for specific occupations and to seek empirical evidence for the general assumption that higher levels of qualification correlate with higher future earnings. We shall subsequently analyse these findings against the backdrop of a specific education and training system, using Canada as the basis for making these calculations: it faces the issues described above of a top-heavy system and has liberal labour markets, which ensure a demand- and market-oriented approach and virtually rule out any state influence. Moreover, Canada has good available official data, collected by Statistics Canada, and is able to supply all the necessary statistical information.
Of course, this study does not intend to blind out other, maybe even more important perspectives regarding occupational choices of youths. An holistic approach taking psychological, sociological and pedagogical aspects into account would be worth striving for, but it cannot be achieved in this context. This is why the authors decided to focus on one aspect of decision making, namely the economical. A new perspective which is not provided by the OECD or other statistics should be allowed without neglecting the other mentioned perspectives completely.
2 Overview of the existing research
Our starting point will be a recent (2013) study by the OECD that looks at the return to investment in education in OECD countries. Overall, and with just a few exceptions, the OECD concludes that individual returns to investment in education
for graduates exceed those of individuals with post-secondary education below tertiary level. An overview of selected data from OECD findings (2013) sheds light on the earnings differentials (Figure 1): the 100% line represents post-secondary education below tertiary level, which includes vocational training. The red bar charts show that in Canada (as well as on OECD average) tertiary education brings on average 39,24 % higher (57,17 % higher) earnings compared to post-secondary education (blue bar charts).
Figure 1: Relative earnings by level of qualification. OECD (2013).
Authors‘ own compilation.
Further studies consider the returns to investment in education from post-secondary education below tertiary level for a range of qualifications. Boothby and Drewes (2006), for example, focus their analysis on trends in returns to investment in education in Canada between 1980 and 2000, comparing different levels of education. Throughout this period, the trend was for higher personal returns to investment in education and for returns to increase more rapidly for women than for men. For example, the average return to investment in vocational training (that is, apprenticeships or academic programmes in Community Colleges) for men was 18.0% while the figure for a Bachelor’s degree was 51.2%; the corresponding figures for women were 16.3% and 62.1%. There is a wide literature on calculating the return to investment in education for graduates in Canada, and some studies also identify wide discrepancies between the returns for men and women, including Duncan and Hoffmann (1981), Groot (1996), and Kiker et al. (1997). Due to the extent of issues regarding gender differences, it is not possible to follow up this important question in this context. Further research concludes that the returns to investment in education for Canadian graduates are above-average (Cohn and Addison 1998; Rathje and Emery 2002).
Stark (2007) considers the returns to investment in education from a range of academic areas, including medical degrees, humanities, social sciences and related areas, commerce, engineering, and math and physical science. He also calculates the return for specific courses of study, such as mathematics, chemistry, geology, and mathematical statistics for the “math and physical science” area. His findings
100,00 100,00
139,24
157,17
0 20 40 60 80 100 120 140 160 180
Canada OECD average
Post-Secondary Education Tertiary Education
demonstrate that the wide range of returns identified by other research broadens even further – to between 7.6% and 25.0% – when specific courses of study are analysed (Stark 2007).
However, there is currently no research providing detailed calculations of returns to investment in education for individual occupational groups in Canada.
3 Methodology for calculating returns to investment in education
There are different approaches to calculate returns to investment in education. The following section introduces two established methods which will be used for the empirical part below.
3.1 Calculating returns to investment in education using the net present value method
The net present value method makes a direct comparison between the costs of and returns to investment in education and calculates the internal rate of return, which equates all discounted cash flows at time t. The OECD uses this method (OECD, 2013; Blöndal et al., 2003), based on the following formula:
𝑁𝑁𝑁=− � 𝐶𝑡 (1 +𝑖)𝑡
𝑑−1 𝑡=0
+ � 𝐵𝑡
(1 +𝑖)𝑡
64−𝑎−𝑑 𝑡=𝑑
(1)
where
Ct: Costs of period t Bt: Benefits of period t i: Discount rate
d: Duration of education or training
a: Age at which education or training commences 64: Retirement (end of labour market activity)
Costs of the training period (first summand) and revenues of the whole working life (second summand) are being discounted. Since this method generates a value expressed in an individual currency, it is important to determine lifetime income, a concept that is not definitively defined but is in wide use as an understandable concept. The discounting in formula 1 then generates the current value of total lifetime income.
3.2 Calculating returns to investment in education using the short cut method
This method is a shorter way of calculating the returns to investment in education using the internal rate of return and is based on a simple formula (Psacharopoulos and Ng 1994)
𝑟𝑘 = 𝑌𝑘− 𝑌𝑘−∆𝑆
𝑆(𝑌𝑘−∆𝑆) (2)
where:
rk: Private returns to education of educational program k S: Duration of education in years
𝑌: Average income at the given level of education k: Comparator for the higher level of qualification.
The average income of a group is compared with the average income of a control group. ΔS denotes the difference in years of education between k and the control group. The short cut method uses a very pragmatic procedure. It is simple to apply, not least as it makes relatively modest demands in terms of data: where individual earnings data (micro-data) are not available, average earnings for the relevant level of education can be used instead. In general, returns express the rate of interest at which the discounted costs and benefits of a course of education or training are equal. It measures average interest rates on the resources used during the course of the education and training against higher incomes on completion of the training phase.
In the following, both methods will be applied. Used in combination, reliable results as well as demonstrative numbers in percent and in the form of lifetime income can be expected, in the knowledge that the net present value method is inferior to other calculation methods due to its simplicity (e.g. missing age factor).
4 Returns to investment in education in Canada
Six occupations were chosen for the calculation and comparison of returns to investment in education. The training occupations chosen are plumbers, electricians, and oil and gas well drillers. The three academic occupations are librarians, social workers, and family, marriage and other related counsellors (for detailed information on the Canadian apprenticeship system, see, for example, Watt-Malcom and Barabasch 2010; Molgat et al. 2011). The reason to choose these occupations simply lies in the accessibility of data. Besides, it was gained to choose professions from the “middle of society”. It should be noted that we have deliberately not used classic academic professions that attract comparatively high earnings, such as the medical professions or law, opting instead for middle-ranking, middle-class occupationsiii.
4.1 Data set and calculation parameters
A dataset must represent the statistical population if it is to generate generally applicable findings. The data used here were collected by Statistics Canada, ensuring that data collection methods are reliable and that the data are representative. The most recent available data are from 2005, all numbers used in the following are from 2005. These are Census Income Data, based on a 20%
sample. To receive results without any biases, coming from unobservable personal data for example, an OLS regression would be a more precise way to calculate the returns to education. The quasi-experimental data for this was not available.
Besides, one fineness which should be kept in mind regarding the results is that available income data does not divide between “including former apprentices” and
“only former apprentices”.
The central questions underpinning any calculation of returns to investment in education are which type of earnings should be used and whether gross or net income should be considered. Gross income accounts for the enhanced earnings that result from higher levels of education, while net income reflects (progressive)
taxation. In this article, we have opted to calculate national return to investment in education and to compare gross income without detailed consideration of the national taxation regime. In the case of the Canadian statistics, the data include both earnings from employment and earnings from self-employment, so that it is not possible to separate out the two groups. It would be helpful to be able to differentiate monetary returns to investment for typical training occupations and types of employment or self-employment, enabling conclusions to be drawn as to the benefits, but the figures available do not enable data for the self-employed to be disaggregated.
The period spent in education is a further key component of the return to investment. The average duration of a Bachelor’s degree course in Canada is 3.3 years, while a subsequent Master’s course adds a further 2.2 years on average (Bayard and Greenlee 2009). These figures were also weighted for the frequency of different types of qualification (Bachelor’s or Master’s). The websites of Canadian provinces and territories indicate the duration of vocational training courses, which is, for example, an average of four years for plumbers and electricians and an average of three years for the various oil and gas industry occupations (e.g. two years for well drillers or three years for steamfitters/ pipefitters and gas fitters).
4.2 Returns to investment in education calculated using the short cut method We initially calculated returns to investment in education using the “short cut”
method. Median earningsiv for a given occupation were compared with earnings for those in the same occupation with a lower level of qualification. For example, just under 87% of all librarians have a Master’s degree and earn $58,281 a year (all figures expressed are in Canadian dollars), whereas librarians without a degree earn $39,056 a year. This differential is related to the duration of training, and the result is the return to investment in education for each level of qualification expressed as a percentage.
Table 1: Returns to investment in education in Canada using the short cut method (formula 2).
Occupation Duration of training Annual income Return to investment in education Librarians
(degree) 5.2 years $58,281 9.47%
Family, marriage and other related
counsellors (degree)
4.1 years $48,242 5.19%
Social workers
(degree) 4.1 years $54,799 7.38%
Plumbers (vocational training, VT)
4.0 years $45,984 7.05%
Electricians
(VT) 4.0 years $48,484 7.05%
Oil and gas well
drillers (VT) 3.0 years $65,994 9.40%
OECD data were used to make a comparison between skilled and unskilled workers. This shows that in 2005, workers in Canada who had not completed vocational training earned on average 78% of what workers with vocational qualifications were earning (OECD 2013). It should be noted here that the differential between earnings from employment and earnings from self- employment may be substantial. However, the OECD itself has to contend with figures that are not always comparable (“Some countries include self-employed individuals, in others they are not considered”, 2013, 82), so we are not concerned by the possibility of distortion here.
The findings are presented in Table 1. The identical figures for the return for plumbers and electricians can be attributed to the assumption that unskilled workers earn 78% of what skilled worker earn.
After rounding up, the return to investment in education for the academic courses considered here therefore ranges from 5.2% to 9.5%, while for plumbers, electricians and oil and gas well drillers, it ranges from 7.1 % to 9.4 %.
4.3 Returns to investment in education calculated using the net present value (NPV) method
Calculating the return to investment in education using the OECD‘s NPV method requires specific data for the duration and cost of courses of education and training and for earnings expectations.
Individual costs for Canada’s vocational education and training system are very difficult to determine. Each province or territory sets its own examination fees, accreditation costs and registration fees. Colleges also set their own fees, which vary according to course. To provide some guidance, however, we used information from the website of the Province of British Columbia, which formed the basis for including costs in our calculations. This indicates that students are required to pay a fee of $863 per six-week block of tuition at a vocational school.
Comparison with samples from other provinces/territories and other colleges indicates that this is a representative figure. We used data for duration of training and earnings as set out in section 4.2. This method also includes income earned during the training period on the assumption that it averages 70% of the earnings of a skilled worker. We can assume that an apprentice spends around nine months of each year working and the remaining three months or so studying at a vocational school. We are not, however, including the unemployment benefit that apprentices draw during the periods they spend at vocational school.
The cost of courses of study also varies widely from one province or territory to another and from one university to another. Statistics Canada provides an overview of average annual tuition fees, sub-divided into undergraduate (Bachelor’s) and graduate (Master’s) courses. In the area of social and behavioural science, for example, which includes the occupational group “marriage and other related counsellors”, annual undergraduate tuition fees were $4,251 while fees at Master’s level were $3,990 in the 2008/2009 academic year. These values were used to calculate averages that reflect the relative proportions of graduates and postgraduates.
A discount interest rate is also required for an NPV calculation. In business studies, discounting is based on the weighted average cost of capital (Bradford 1975). However, discounting here merely takes account of compensation for inflation, so we have assumed an interest rate of i = 2 %.v
This calculation produces the discounted lifetime annual earnings listed in Table 2.
Table 2: Net present value for Canada. Source: authors’ own compilation using formula 1.
Occupation Duration of training Annual income NPV Librarians
(degree) 5.2 years $58,281 $1,421,850
Family, marriage and other related
counsellors (degree)
4.1 years $48,242 $1,397,375
Social workers
(degree) 4.1 years $54,799 $1,228,365
Plumbers
(VT) 4.0 years $45.984 , $1,272,630
Electricians (VT) 4.0 years $48,484 $1,342,172
Oil and gas well
drillers (VT) 3.0 years $65,994 $1,887,969
The results achieved from using the net present value (NPV) method also generate some interesting findings: the lowest NPV is that for one of the academic occupations (social workers), while the highest is that for the oil and gas well drillers.
4.4 Relationship between earnings levels and return to investment in education
Our calculations show that individuals making the higher investment in a degree course can generally expect a return on this investment in the form of enhanced earnings expectations.
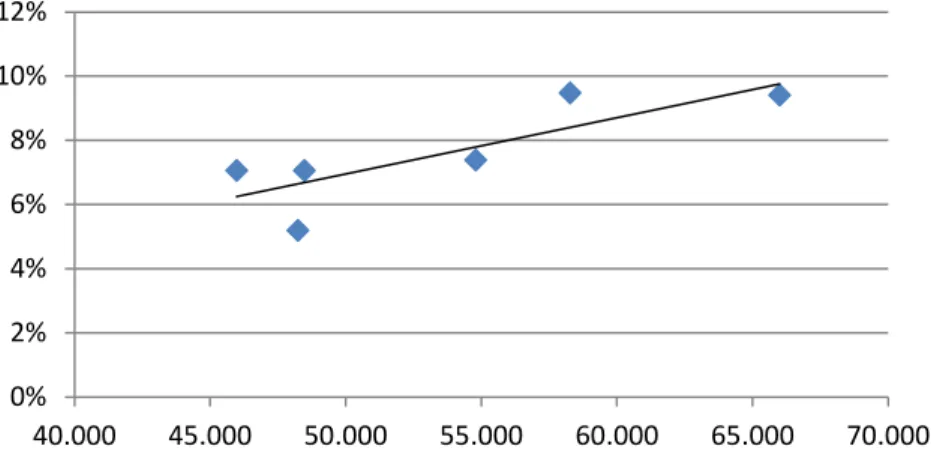
However, there is a positive correlation between earnings levels and return to investment in education. To demonstrate this, we have plotted our findings from Table 1 in Figure 2: annual earnings for the selected occupations are given on the horizontal axis, while the return to investment is given on the vertical axis.
Figure 2: Returns to investment in education in Canada expressed as a percentage of annual income. Source: authors’ own compilation.
0%
2%
4%
6%
8%
10%
12%
40.000 45.000 50.000 55.000 60.000 65.000 70.000
5 Evaluation of findings
We shall now evaluate our findings in the context of the specific characteristics of Canada’s education and training system. To do this, we shall consider the key determining factors of the Canadian education and training system.
The numbers following apprenticeships have typically been low in Canada (Molgat et al. 2011; Lehmann 2012). Over the last 20 years or so, the numbers registering for vocational training have increased significantly – from 199,000 in 2000 to just under 359,000 in 2007, an average annual growth of 8.8%. However, this increase has not been mirrored by the growth in the numbers completing their qualifications, which, at just 4.2% a year, is around half that level (Statistics Canada 2009). These data are directly related to routes into training. Lehmann (2012, 25) argues, for example, that “Apprenticeship training is seen as an alternative pathway into fulfilling and rewarding employment for young people who are considered at risk of not completing secondary education or who are generally more interested in applied, rather than academic learning.”
The fundamental issue is, however, why other – higher-performing – young people are ignoring the excellent earnings opportunities offered by a range of vocational occupations compared with those offered by academic qualifications, thereby exacerbating academic drift.
As discussed above, our focus is dominated by the economics of education.
We do not neglect much broader approaches, like the one introduced by Gambetta (1987), who also included in detail factors like structure of an education system, grading or parental influence. But such a wide-ranging approach cannot be discussed properly in a journal paper like this one.
Therefore we will discuss the major factors affected by the income aspect.
Factors involved here include a range of approaches involving the image, reputation, and perceived value and benefits of vocational education and training from the individual’s perspective (see, for example, Smith and Powell 1990). Even without detailed consideration of the range of approaches represented by sociology, education economics, research into vocational education and other disciplines (see, for example, Lasonen and Manning 2001; Lasonen and Gordon 2009; CEDEFOP 2013; Pilz 2009), it is possible to conclude that these approaches have a number of elements in common.vi Crucially, these elements include earnings, in combination with job security and career prospects, satisfaction with training and employment, and social status/prestige. These four aspects are not always entirely discrete and may also be interdependent, but they represent a structure that can be imposed on diffuse findings, so we shall be using them here as the basis for our discussion.vii
Our differentiated earnings data for Canada suggest that monetary aspects may be less crucial than generally assumed to the reputation and perceived value of vocational education and training. Other relevant studies (Boyd 2008) show, however, that this is not the case. An alternative assumption is that young people and their parents lack robust information relating to the differential returns to investment in education (Lehmann 2012). There is widespread awareness in Canada that employment in the onerous and demanding oil sector is well paid (Taylor et al. 2007; Lehmann et al. 2015), but few comparisons exist with other fields of employment. Evans et al. (2013) point out the aspect of lifelong learnings and its variation according to socio-historical conditions and stratifications and they recite “opportunities and risks” of young people’s lives. In this context, the
wrong occupational decision is a risk which is shaped by the individual actor and by institutional regulations.
In terms of job security, Canada’s high level of demand for skilled workers can no longer be met adequately by appropriately qualified immigrant labour (Livingstone and Pankhurst 2009; Ruth and Grollmann 2009; Lehmann 2012). This is true not only of major multinationals but also of domestic SMEs (Belanger and Hart 2013). Canadian apprentices therefore have good to very good prospects of finding employment on completion of their training, with only a low risk that they will subsequently become unemployed (Brennan 2014; Molgat et al. 2011), although there are regional differences (Lehmann et al. 2015). It should, however, be pointed out that Canada’s relatively liberal labour market sometimes encourages substantial job mobility on the part of individual workers (Lehmann et al. 2015) and that when they are filling vacancies, many employers attach greater weight to work experience than to formal training qualifications (Taylor 2006).
The marked shortage of skilled labour in many sectors also promotes career progression and, in the craft sector in particular, facilitates the switch to self- employment. Self-employment, particularly as a sole trader, is becoming increasingly common among Canadian craft workers: just 9% of all craft workers were self-employed in 1987, but this had risen to 15% by 2007 (Pyper 2008).
Closer scrutiny of the figures for electricians and plumbers shows that their self- employment rates for 2007 were 6.8% and 12.1% respectively.
The Canadian data relating to satisfaction with training and subsequent employment present a more nuanced picture. Lehmann (2004; 2012), for example, is ambivalent: his research into apprentices in Alberta shows that at least part of his sample was satisfied with their training and prospects for future area of work and responsibilities. Lehmann et al. (2015) found the same ambivalence in a further study, this time of Toronto. Molgat et al. (2011) also reach similar conclusions on the basis of their research.
Discussion of the aspects already considered provides no indication of why vocational training enjoys such a poor reputation and low status in Canada. We shall, therefore, focus our attention on the remaining aspect, that of social status or prestige. Molgat et al. (2011, 509) conclude that “[p]erhaps stemming from its origins, VET at the secondary level has never really been perceived in a positive light by students, parents, teachers and the general population.”
Many commentators cite as a reason for this negative perception the fact that in Canada, vocational training is associated with provision for young people with social or personal problems or, more generally, for those with learning difficulties (Lehmann 2004; Molgat et al. 2011; Taylor 2006; 2008). Academic qualifications are, moreover, perceived as underpinning social standing. As a result, young Canadians tend to respond to surveys by arguing that failure to go to university makes it look as if they are not doing anything with their lives (Lehmann 2012).
Social status therefore appears to be the most significant contributory factor to vocational training’s low status: as Molgat et al. (2011) argue, “Given all of these factors, it is perhaps not surprising that the image of VET pathways is rather poor in the eyes of students, parents and society in general. This tarnished image of vocational education and training in Canada is also tied to the high value attached to university education by society in general and by students and their parents in particular.”
6 Summary
Research findings demonstrate that obtaining a degree in Canada does not necessarily generate a higher return to investment or a higher NPV than completing vocational training. We have shown empirically that Becker’s classic “human capital” theory does not apply a priori. Vocational training has been shown to facilitate equally high monetary returns, albeit only for the occupations compared here. Our findings do not invalidate the assumption that gaining a degree means higher earnings from employment. They illustrate, however, that in certain occupational groups for which a degree is the norm, the return to investment in education is not particularly high when compared with specific training occupations. Our findings therefore justify revisiting the underlying assumption that vocational education and training cannot generate benefits comparable with those generated by a tertiary-level qualification. This finding may also reflect the fact that the training occupations we have considered enjoy low status and an often negative reputation in Canada, factors which tend to outweigh the comparatively high earnings they offer.
It should be added that factors like the framework for training (framework curriculum), the duration of individuals’ employment (the longer the employment, the higher the return to investment), and taxation and social security systems also have an important influence on calculating returns to investment. We have not fully accounted here for aspects such as potential earnings from what are known as
“mini-jobs” (part-time, low-paid employment) held at the same time as undergoing a programme of study, the age profile of apprentices, or the gender profile of the selected occupations. These aspects could be considered in further work.
If “academic drift” is to be countered by boosting the status of vocational training in Canada, those involved in education and training policy need to argue for substantially more differentiated data on the returns to investment in education from different forms of education than the current – largely undifferentiated – figures permit. This information also needs to be disseminated generally as well as in career guidance education, so that neither students nor their parents make misleading assumptions (Taylor 2008; Taylor 2005; Pilz 2011).viii This would enable the earnings factor at least partially to offset the current dominance of the social status factor, helping to boost the reputation and image of vocational training in Canada. There are already individual initiatives to do this (Brennan 2014;
Molgat et al. 2011), and these should be built upon.
References
Acemoglu, D., & Pischke, J.-S. (1998). Why do firms train? Theory and evidence.
The Quarterly Journal of Economics, 113(1), 79-119.
Akinyemi, S. (2013). The Economics of Education. Houston: Sbpra.
Bayard, J., & Greenlee, E. (2009). Graduating in Canada: Profile, Labour Market Outcomes and Student Debt of the Class of 2005. Research Paper Statistics Canada, No. 074.
Becker, G.S. (1964). Human Capital: A Theoretical and Empirical Analysis. New York: National Bureau of Economic Research.
Belanger, P., & Hart, S.-A. (2013). Training in SMEs in the Montréal and Winnipeg urban regions, Canada, In OECD (Ed.), Skills Development and Training in SMEs (pp. 147-153). Paris: OECD.
Belfield, C.R. (2000). Economic Principles for Education: theory and evidence.
Cheltenham and Northampton: Edward Elgar Publishing.
Blöndal, S., Field, S., & Girouard, N. (2003). Investment in human capital through upper secondary and tertiary education. OECD Journal: Economic Studies, 2002(1), 41-89.
Boothby, D., & Drewes, T. (2006). Postsecondary Education in Canada: Returns to University, College and Trades Education. Canadian Public Policy/Analyse de Politiques, 32(1), 1-21.
Bradford, D.F. (1975). Constraints on Government Investment Opportunities and the Choice of Discount. The American Economic Review, 65(5), 887-899.
Brennan, P. (2014). Raising the quality and image of TVET: Lower-level training or motor for inclusive and sustainable growth?. Prospects -Quarterly Review of Comparative Education, 44(1), 183-195.
Boyd, M. (2008). A Socioeconomic Scale for Canada: Measuring Occupational Status from the Census. The Canadian Review of Sociology and Anthropology, 45(1), 51-91.
CEDEFOP (2014). Attractiveness of initial vocational education and training:
identifying what matters. Luxembourg: CEDEFOP.
Council of Ministers of Education (2008). The Development of Education Reports For Canada: Canadian commission for UNESCO. Toronto: Council of Ministers of Education.
Coelli, M., & Wilkins, R. (2009). Credential Changes and Education Earnings Premia in Australia. The Economic Record, 85(270), 239-259.
Cohn, E., & Addison, J. T. (1998). The Economic Returns to Lifelong Learning in OECD Countries. Education Economics, 6(3), 253-307.
Duncan, G., & Hoffman, S.D. (1981). The incidence and wage effects of overeducation. Economics of Education Review, 1(1), 75-86.
Evans, K., Schoon, I., & Weale, M. (2013). Can Lifelong Learning Reshape Life Chances?. British Journal of Educational Studies, 61(1), 25-47.
Gambetta, D. (1987). Were They Pushed or Did They Jump? Individual Decision Mechanisms in Education. Cambridge: University Press.
Garrod, N., & Macfarlane, B. (2009). Challenging Boundaries. Managing the Integration of Post-Secondary Education. New York: Taylor & Francis.
Gibbons, R., & Waldman, M. (2004). Task-specific human capital. The American Economic Review, 94(2), 203-207.
Groot, W. (1996). The incidence of and returns to overeducation in the UK.
Applied Economics, 28(1), 1345–1350.
Kiker, B.F., Santos, M.C., & De Oliviera, M. (1997). Overeducation and undereducation: evidence for Portugal. Economics of Education Review, 16(1), 111-125.
Lasonen, J., & Gordon, J. (2009). Improving the attractiveness and image of VET.
In CEDEFOP (Ed.), Modernising Vocational Education and Training: Fourth report on Vocational Training Research in Europe – Background report (pp.
15-88). Paris: CEDEFOP.
Lasonen, J., & Manning, S. (2001). How to improve the standing of Vocational compared to General Education. In Descy, P., & Tessaring, M. (Eds.), Training in Europe, Second report on Vocational Training Research in Europe 2000 – Background report Volume I (pp. 115-167). Paris: CEDEFOP.
Lehmann, W. (2004). ‘For some reason, I get a little scared’: structure, agency and risk in school-work transitions. Journal of Youth Studies, 7(4), 379-396.
Lehmann, W. (2012). Youth Apprenticeships in Canada: Context, Structures and Apprentices’ Experiences. In M. Pilz (Ed.), The Future of Vocational Education and Training in a Changing World (pp. 25-41), Wiesbaden: VS Verlag für Sozialwissenschaften.
Lehmann, W., Taylor, A., & Hamm, Z. (2015). ‘Go west young man!’ Youth apprenticeship and opportunity structures in two Canadian provinces. Journal of Education and Work, 28(1), 1-22.
Lent, R., Brown, S., & Hackett, G (1994). Toward a Unifying Social Cognitive Theory of Career and Academic Interest, Choice, and Performance. Journal of Vocational Behavior,45(1), 79-122.
Li, C., Gervais, G., & Duval, A. (2006). The Dynamics of Overqualification:
Canada’s Underemployed University Graduates. Ottawa: Statistics Canada.
Livingstone, D.W., & Pankhurst, K.V. (2009). Education and Jobs: The way ahead.
In K.V. Pankhurst (Ed.), Education & Jobs – Exploring the gaps (pp. 309- 326). Toronto: University of Toronto Press.
Molgat, M., Deschenaux, F., & LeBlanc, P. (2011). Vocational education in Canada: do policy directions and youth trajectories always meet?. Journal of Vocational Education and Training, 63(4), 505-524.
OECD (2012). Education at a Glance 2012. OECD Indicators. OECD Publishing.
OECD (2013). Education at a Glance 2013. OECD Indicators. OECD Publishing.
OECD (2013). Education at a Glance. Annex 3: Sources, methods and technical notes. OECD Publishing.
Pilz, M. (2009). Initial vocational training from a company perspective: a comparison of British and German in-house training cultures. Vocations and Learning, 2(1), 57-74.
Pilz, M. (2011). Vocational Training as the Roundabout Route from Abitur to University. In S. Stolz, & P. Gonon (Eds.), Challenges and Reforms in Vocational Education: Aspects of inclusion and exclusion (pp. 277-295).
Pieterlen: Internationaler Verlag der Wissenschaft.
Psacharopoulos, G. (1973). Returns to Education. Amsterdam: Elsevier.
Psacharopoulos, G., & Ng, Y. C. (1994). Earnings and Education in Latin America.
Education Economics, 2(2), 187-207.
Psacharopoulos, G. (1994). Returns to investment in education: a global update.
World Development, 22(9), 1325-1343.
Pyper, W. (2008). Skilled trades employment. Statistics Canada: Perspectives on labour and income, 9(10), 5-14.
Raffe, D. (1993). The changing Scottish scene: implications for south of the border.
In W. Richardson, J. Woolhouse, & D. Finegold (Eds.), The Reform of Post- 16 Education and Training in England and Wales (pp. 54-73). Harlow:
Longman.
Raffe, D. (1994). The new flexibility in vocational education. In W.J. Nijhof, &
J.N. Streumer (Eds.), Flexibility in vocational education and training (pp. 13- 32). Utrecht: Lemma.
Rathje, K.A., & Emery, J.C.H. (2002). Returns to University Education in Canada Using New Estimates of Program Costs. Toronto: C.D.
Roth, F., & Thum, A.-E. (2010). The Key Role of Education in the Europe 2020 Strategy, CEPS Working Document No. 338.
Ruth, K., & Grollmann, P. (2009). Monitoring VET systems of major EC competitor countries: The cases of Australia, Canada; USA and Japan, Bremen: http://www.voced.edu.au/content/ngv58542. Accessed 15.10.2015.
Smith, H., & Powell, B. (1990). Great Expectations: Variations in Income Expectations Among College Senior. Sociology of Education, 63(3), 194-207.
Stark, A. (2007). Which fields pay, which fields don’t? An Examination of the Returns to University Education in Canada by detailed field of study. Canada:
Department of Finance.
Statistics Canada (2005). National Graduates Survey:
http://www23.statcan.gc.ca/imdb/p2SV.pl?Function=getSurvey&SDDS=501.
Accessed 21.07.2014.
Statistics Canada (2005). 2006 Census Topic-based tabulations:
http://www12.statcan.gc.ca/census-recensement/2006/dp-pd/tbt/Rp-
eng.cfm?LANG=E&APATH=7&DETAIL=0&DIM=0&FL=W&FREE=0&G C=0&GID=0&GK=0&GRP=1&PID=96285&PRID=0&PTYPE=88971,9715 4&S=0&SHOWALL=0&SUB=0&Temporal=2006&THEME=0&VID=0&V NAMEE=Wage%20and%20salary%20statistics%20%284%29&VNAMEF=S tatistiques%20des%20salaires%20et%20traitements%20%284. Accessed 11.12.2014.
Statistics Canada (2009). Postsecondary Enrolment and Graduation, Catalogue No.
81-599-X, Issue No 003.
Statistics Canada (2011/2012). CANSIM, table 477-0019:
http://www.statcan.gc.ca/tables-tableaux/sum-som/l01/cst01/educ71a- eng.html. Accessed 11.06.2014.
Taylor, A. (2005). ‘Re-culturing’ students and selling futures: school-to-work policy in Ontario. Journal of Education and Work, 18(3), 321-340.
Taylor, A. (2006). The Challenges of Partnership in School-to-work Transition.
Journal of Vocational Education and Training, 58(3), 319-336.
Taylor, A. (2008). ’You have to have that in your nature: understanding the trajectories of youth apprentices. Journal of Youth Studies, 1(4), 393-411.
Taylor, A., McGray, R., & Watt-Malcolm, B. (2007). Struggles over labour power:
the case of Fort McMurray. Journal of Education and Work, 20(5), 379-396.
Vahey, S.P. (2000). The great Canadian training robbery: evidence on the returns to educational mismatch. Economics of Education Review 19(1), 219-227.
Watt-Malcom, B., & Barabasch, A. (2010). Tensions in the Canadian Apprenticeship Sector: rethinking Bourdieu’s analysis of habitus, field, and capital. Research in Comparative and International Education, 5(3), 289-301.
i For simplification purposes the terminology “graduates” is used in context of tertiary educational qualification, if not differently characterized.
ii For further information about the Canadian education system and its diversity between the provinces look up, for example, Council of Ministers of Education (2008). In our case, the structure of the education system is of minor interest.
iii In 2005, median earnings in Canada were $42,811, and average earnings $52,105 (Statistics Canada), placing the selected occupational groups in the middle-ranking earnings groups.
iv All the earnings data used are medians: compared with arithmetic means, medians are less likely to be distorted by statistical outliers.
v For example, the European Central Bank’s target for inflation is 2%. However, the discount factor is largely irrelevant for the purposes of this study, which simply compares a range of occupational groups with consistent income flows.
vi The cited literature shows very clear that it is impossible to generate a proper raking of the impact of the factors (see also CEDEFOP, 2014).
vii Our aim is not the measure and compare the impact of each of the factors. We are using the factors to discuss our findings about the earnings structure in relation to the (by economist very often assumed, see for example Gambetta 1987) rational choice of jobseeker.
viii We are aware of the limitations of our findings. In line with the discussions regarding earnings, social status and reputation in the field of economics of education, we do not discuss other aspects of career choice like interest or disposition (see for example Lent et al., 1994). Future research could include and combine these other aspects to measure the impact of and interaction between the factors much better. Also, the issue of occupational heterogeneity, meaning differing detailed occupations within the Statistics Canada dataset, was recognized by the authors, but could not be excluded.