Electricity Markets in Europe
-
Analysis and Valuation of Derivative Instruments
Jan Marckho¤
February 7, 2010
Dissertation
zur Erlangung des Grades eines Doktors durch die
Fakultät der Sozial‐ und Wirtschaftswissenschaften der Otto‐Friedrich‐Universität
Bamberg
Vorgelegt von:
J AN M ARCKHOFF
Erstprüfer: Prof. Dr. Matthias Muck, Otto‐Friedrich‐Universität Bamberg Zweitprüfer: Prof. Dr. Andreas Oehler, Otto‐Friedrich‐Universität Bamberg
Tag der mündlichen Prüfung: 7. Juni 2010
Acknowledgements
I owe much gratitude to my supervisor Matthias Muck for his excellent guidance throughout the dissertation. I greatly bene…ted from his fruitful advice and insightful comments during countless discussions. Without his support and enduring patience, this work could not have been realized. I would also like to thank Andreas Oehler who kindly agreed to be part of my dissertation committee and provided valuable comments and suggestions.
My work has mostly bene…ted from productive and fruitful discussions at the University of Bamberg especially with my colleagues from the chair of
…nancial controlling. In particular I would like to thank Sebastian Paik, Thomas Volmer and Frank Mirsberger for continuous discussions and shar- ing their ideas. In addition, they created a highly pleasant work environ- ment and made the University of Bamberg a great place to work. Many thanks go to Jens Wimschulte with whom I greatly enjoyed working on our joint research project on CfD markets. Further, I am thankful for comments in- and outside the seminars at the University of Münster. In particular, I would like to thank Alexander Forstbach for his econometric support and helpful suggestions. I would also like to thank participants at the 12th Conference of the Swiss Society for Financial Markets Research (SGF) in Zurich and participants at the Conference on Energy Finance at the University of Agder, Krisitansand, Norway.
As empirical research cannot be undertaken without data, I am grateful to European Energy Exchange (EEX), Amsterdam Power Exchange (APX), TenneT and Nord Pool for data provision.
Last but not least, I am deeply indebted to Julia, my family and my friends
for their patience, their unconditional emotional support and encourage-
ment as well as their enduring belief in me.
Contents
1 Introduction 1
2 Electricity Markets and Derivatives 7
2.1 Liberalization of Electricity Markets . . . . 8
2.2 Electricity as a Commodity . . . . 10
2.2.1 Fundamentals of Electricity . . . . 10
2.2.2 Characteristics of Electricity Prices . . . . 18
2.3 Derivatives in Electricity Markets . . . . 27
2.3.1 Derivative Products . . . . 28
2.3.2 Modelling Approaches . . . . 35
2.4 Valuation of Derivatives . . . . 40
2.4.1 Valuation Models . . . . 41
2.4.2 Solution Techniques . . . . 53
2.5 Conclusion . . . . 67
vii
3 The Valuation of Contracts for Di¤erence in the Nordic Market 68
3.1 Introduction . . . . 69
3.2 The Nordic Electricity Market . . . . 72
3.2.1 The Spot Market at Nord Pool . . . . 72
3.2.2 Transmission Congestion and Locational Price Spreads 77 3.2.3 Contracts for Di¤erence . . . . 84
3.3 Pricing of CfDs: Methodology and Results . . . . 87
3.3.1 Pricing of CfDs . . . . 87
3.3.2 Risk Premia in CfD Prices . . . . 92
3.3.3 Determinants of Risk Premia . . . 103
3.4 Summary and Outlook . . . 107
4 Jump Risk Premia in Short-Term Electricity Spread Options 109 4.1 Introduction . . . 110
4.2 German-Dutch Electricity Market . . . 113
4.2.1 National Electricity Markets . . . 113
4.2.2 German-Dutch Cross-Border Market . . . 115
4.3 Model . . . 123
4.3.1 Underlying Processes . . . 123
4.3.2 Derivation of Call-Price . . . 127
4.4 MCMC Estimation . . . 128
4.4.1 Discrete Process . . . 129
4.4.2 Empirical Parameters . . . 130
4.4.3 Risk-neutral Parameters . . . 136
4.5 Parameter Estimates . . . 139
4.6 Analysis of Residuals . . . 146
4.6.1 Residuals of Hourly PTRs . . . 146
4.6.2 Residuals of Monthly PTRs . . . 153
4.7 Conclusion . . . 157
5 Conclusion 161 Appendix 164 A Itô Lemma for Jump Processes . . . 165
B Posterior Densities for the Estimated Parameters of Hourly PTRs . . . 166
References 171
List of Tables
3.1 Frequency of di¤erences between daily area prices and the system price. . . . 78 3.2 Descriptive statistics for di¤erences between daily area prices
and the system price. . . . 80 3.3 Regression of area price spreads on relative water reservoir
level deviations (2001-2006). . . . 83 3.4 Average traded prices of Contracts for Di¤erence by delivery
period. . . . 88 3.5 Ex-post risk premia of Contracts for Di¤erence. . . . 94 3.6 Regression of ex-post risk premia on time-to-maturity (2001-
2006). . . . 99 3.7 Regression of ex-post risk premia on variance and skewness
of spot prices (2001-2006). . . 106
xi
4.1 Gross electricity generation in Germany and the Nether- lands in 2007. . . 114 4.2 Descriptive statistics of German-Dutch day-ahead spreads
between 2001 and 2008. . . 119 4.3 Descriptive statistics of German-Dutch PTR prices between
2001 and 2008. . . 121 4.4 Estimated empirical and risk-neutral parameters. . . 140 4.5 Seasonality in residuals for hourly PTRs and number of
spikes per weekday. . . 150 4.6 Seasonality in residuals for monthly PTRs and number of
spikes per calendar month. . . 156
List of Figures
2.1 Disentangled value chain in the electricity market. . . . 9 2.2 TSO map of the German electricity market. . . . 12 2.3 Example of a simple three node power grid. . . . 13 2.4 Supply and demand curves for the day-ahead auction at EEX. 21 2.5 Daily spot prices at EEX between 2001 and 2008. . . . 22 2.6 Weekly and intraday seasonality of spot prices at EEX. . . 24 2.7 Autocorrelation function of daily spot prices at EEX. . . . . 25 2.8 Seasonality of monthly futures at EEX. . . . . 26 2.9 Daily spread between EEX and Powernext spot prices be-
tween 2002 and 2008. . . . 27 2.10 Daily spot prices at Nord Pool between 2001 and 2008. . . . 48 2.11 Simulated prices for the stochastic residual of a regime-
switching model with two independent regimes. . . . 52 2.12 Set up of Fourier transform. . . . 59 2.13 Relative pricing errors of Monte Carlo simulation. . . . . . 61
xiii
2.14 Set up of a recombining binomial tree model. . . . 62
2.15 Relative pricing errors of binomial tree model. . . . 64
2.16 Finite di¤erences grid. . . . 65
2.17 Relative pricing errors of …nite di¤erences scheme. . . . 67
3.1 Market areas and main interconnections in the Nordic power market. . . . 74
3.2 Water reservoir levels and their historic medians in the Nordic market. . . . 82
3.3 Ex-post risk premia of system and implied area quarter for- wards by time-to-maturity. . . . 102
4.1 Hourly price spreads between German and Dutch day-ahead prices. . . 117
4.2 Di¤erence between PTR prices and resulting payo¤s. . . 124
4.3 Estimated de-spiked process for hour 8. . . 136
4.4 Di¤erence between empirical and risk-neutral densities. . . 144
4.5 Hourly di¤erence between market and model PTR prices. . 147
4.6 Di¤erence between market and model prices for monthly PTRs. . . 154
4.7 Number of spikes and seasonal trend in the di¤erence be-
tween market and model prices. . . 157
List of Symbols
Chapter 2
P
tElectricity spot price at time t.
P
tiElectricity spot price at time t in area i.
F
tForward or Futures price at time t.
F
tiForward or Futures price at time t for delivery in area i.
C
tCall option price at time t.
g ( ) Payo¤ function of call option.
H Heat rate for spark spread option.
K Strike price of electricity option.
V
tPrice of generating fuel for spark spread option.
f (t) Deterministic seasonal function at time t.
X
t, Y
t, Z
tStochastic component of electricity price.
W
i(t) Wiener process of the stochastic component i at time t.
J
tNormally distributed jump-size.
xv
q
tPoisson process.
E [ ] Expectation operator.
V ar [ ] Variance operator.
max [x; y] Maximum of x and y.
(x)
+Equivalent to max [x; 0].
P Empirical or physical probability measure.
Q Risk-neutral probability measure.
t
Information set available at time t.
( ) Cumulative normal distribution function.
N (x
1; x
2) Normal distribution with mean x
1and variance x
2.
@ Partial di¤erential operator.
r Risk neutral rate of interest.
Mean-reversion speed.
Deterministic trend.
Volatility parameter.
Correlation coe¢ cient.
Jump intensity of Poisson process q
t.
i
Mean of normally distributed variable i.
Mean-reversion level.
Autoregression parameter.
c Constant level of autoregression process.
"
tWhite noise process.
b
ijRegime-switching probability.
Transition matrix of regime-switching model.
R
tRegime at time t.
Pr ( j ) Conditional probability.
G
tFunction determining the value of a call option.
G ^
tFourier transform of function G
t. (t) ; (t) Functions in Fourier transform.
p
ijProbability of an up-move in the binomial tree model at node i and time step j.
u Up-move factor in the binomial tree model.
d Down-move factor in the binomial tree model.
Chapter 3
Notation as in Chapter 2; additional and deviating symbols:
P
tiMean electricity spot price at time t in area i.
t
risk premium at time t.
t
Time-to-maturity left at time t.
N o
;
F i;
SeRegression coe¢ cient for water reservoir level in Norway, Finland and Sweden.
Regression coe¢ cient for time-to-maturity of risk pre- mium.
Regression coe¢ cient for spot price variance of risk pre-
mium.
Regression coe¢ cient for spot price skewness of risk pre- mium.
Chapter 4
Notation as in Chapters 2 and 3; additional and deviating symbols:
max [ ] Maximum of a set.
min [ ] Minimum of a set.
S
tStochasting di¤usion process.
J
tJump process.
N
tNormally distributed jump size.
p
JJump probability of process J
t. Mean-reversion level.
& Variance of J
t.
J
Market price of jump risk.
p ( j ) Conditional density.
Vector of parameters to be estimated.
X Vector of state variables.
( ) Posterior density operator.
q ( j ) Conditional proposal density.
' Bernoulli probability.
C
tMarket price of PTR option at time t.
P T R ( ) PTR model price.
t
Set of PTR option input factors comprising time-to- maturity and current spot price.
Parameter for prior distribution.
Parameter for prior distribution.
Parameter for seasonality regression.
Di¤erence operator.
IG (x
1; x
2) Inverse-Gamma distribution with parameters x
1and x
2.
B eta (x
1; x
2) Beta distribution with parameters x
1and x
2.
Introduction
Over the past years, the international electricity markets have undergone an enormous restructuring. Before, these markets were characterized by generally state owned and vertically integrated utilities which o¤ered all services along the value chain from generation over distribution up to sales.
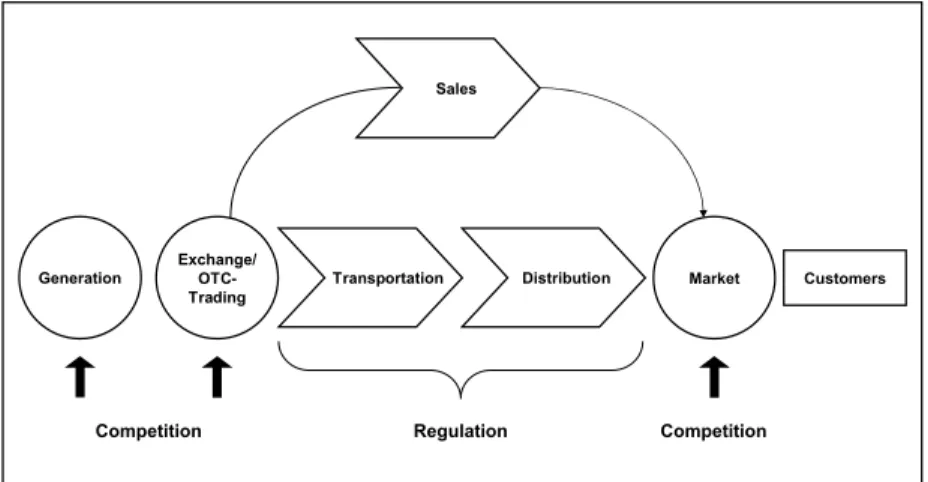
During this time, prices were determined by these monopolists and there- fore indirectly by the government, based on break-even analyses. However, starting in the 1980s, electricity markets worldwide faced deregulation that reached continental Europe in the late 1990s. The former monopolistic structure broke up resulting in a disentangled value chain. Although some elements of the value chain are still subject to governmental regulation, many areas of the electricity market are now characterized by competition and open for new market participants.
Due to the deregulation and the introduction of competition, electricity prices are now determined by market forces, i.e. demand and supply, and not subject to governmental …xing. Moreover, the terms of delivery con- tracts between generators and wholesalers changed considerably. While they used to be characterized by long maturities with …xed prices, these contracts are now in general based on short-term market prices and there-
1
fore subject to short-term price variations. As a result of this transition, market participants are faced with considerable price risk.
1Based on the observed volatility in electricity markets, this risk is by far larger than in any other …nancial or commodity market.
2In the course of the liberalization, the need for an organized market at the wholesale level arose. Although electricity and its derivative products can be traded Over the Counter (OTC), which is still the dominant market place, in many countries electricity exchanges emerged with the aim of in- troducing more competition and increasing transparency.
3Although OTC trading is still dominant in electricity markets, exchange based trading volumes have risen continuously over the past few years highlighting the growing importance of electricity exchanges. Due to the rise of the national electricity exchanges in combination with the market opening, generators and wholesalers are not bound to their own national markets anymore.
Driven by ambitions to maximize pro…ts and minimize costs, respectively, market participants enter these new markets and thus, induce an increase in cross-border electricity ‡ows. In 2007, 13.7% of the total electricity con- sumption in all UCTE countries was delivered cross-border.
41
Following Bitz (1993) p. 642, we de…ne risk as the danger, resulting from the uncertainty of future developments, of a negative deviation of an economic quantitiy from a de…ned traget value.
2
Volatility throughout this paper is de…ned as the annualized standard deviation. See Weron (2006) for an overview of volatilities in di¤erent markets.
3
Although one can distinguish between electricity pools and electricity exchanges, we re- frain from discussing their di¤erence. Throughout this thesis we only consider electricity exchanges and refer to Eydeland and Wolyniec (2003) for a detailed treatment of the topic.
4
The Union for the Co-ordination of Transmission of Electricity (UCTE) is the association
of all transmission system operators (TSO) in the continental European area. The UCTE
currently comprises 29 TSOs from 24 countries.
The increased price risk in national electricity markets, as a result of the liberalization, requires an adequate risk management.
5Moreover, cross- border markets feature distinct risk factors that deserve special consid- eration and thus, post an additional challenge for risk management in electricity markets. In order to meet these requirements, a thorough un- derstanding of the characteristics of electricity prices and the relevant risk management tools is of utmost importance.
Cross-border markets refer mainly to neighboring markets and exhibit the risk of locational price di¤erences. This risk is well known in commodity markets and has been addressed by Kamara and Siegel (1987) and Pir- rong et al. (1994) in case of agricultural commodities and by Brinkmann and Rabinovitch (1995) in case of energy commodities. Research in this
…eld generally focuses on the analysis of hedging e¤ectiveness of exchange traded futures contracts where the actual and the underlying commodity speci…cation di¤er in terms of location. Although for electricity markets some studies, such as De Vany and Walls (1999) or Hadsell and Shawky (2006) for the US and Worthington et al. (2005) for Australia, analyze the interrelations of regional electricity spot prices, there are only few that di- rectly address locational prices and especially their spreads. Skantze et al.
(2004) present a bid-based stochastic model for locational electricity spot prices in the USA, while Haldrup and Nielsen (2006a) as well as Haldrup and Nielsen (2006b) consider congestion and non-congestion periods when modeling electricity spot prices and relative prices of regional intercon- nected electricity markets in Scandinavia. Although their work sheds some light on the characteristics of locational electricity prices, there is almost no empirical research concerning derivative products in cross-border elec- tricity markets. The only studies available are by Kristiansen (2004a) and Kristiansen (2004b), which, however o¤er only limited empirical analyzes.
5
See Oehler and Unser (2002) p. 20 ¤, for a thorough discussion of the risk management
process.
This thesis, to the best of the author’s knowledge, is the …rst work to thor- oughly discuss the valuation of derivatives in the European cross-border electricity market. It covers two distinct electricity markets in Europe and discusses the two most important types of derivatives within the Euro- pean cross-border electricity market. Although the focus clearly is on cross- border markets, their unique nature cannot be fully understood without a fundamental treatment of national electricity markets. Moreover, this the- sis introduces the relevant risk factors associated with cross-border markets and estimates these risk-factors based on the major derivative instruments.
Finally, it delivers a profound analysis of the valuation of these contracts.
Overall, this thesis intends to help the reader to better comprehend cross- border electricity markets and to gain in-depth knowledge of the relevance and functioning of risk management in these markets.
The second chapter introduces the European electricity markets and dis-
cusses the economics behind electricity as a commodity. This knowledge is
important for understanding the respective derivative instruments in those
markets. Moreover, the second chapter also shortly explains the main types
of derivatives in European cross-border electricity markets and reviews the
relevant valuation models. Following the introduction, each of the subse-
quent two chapters discusses one the most relevant cross-border electricity
derivatives. These are Contracts for Di¤erence (CfDs) and Physical Trans-
mission Rights (PTRs), where the latter is distinguished into day-ahead
contracts with delivery of one hour and monthly contracts with delivery
over an entire calendar month. CfDs are exchange traded forward contracts
on the spread between two locational prices in the Scandinavian electric-
ity market and are the only cross-border derivatives currently traded in
this market. PTRs are options on the di¤erence between two neighboring
electricity prices and are, as the name suggests, physically settled. These
contracts are currently the only contracts used for cross-border hedging
in the German electricity market. The research in the following chapters
focuses around the question of how these contracts are priced and what
are the main drivers for their valuation. These questions are essential for a thorough understanding of these products and thus, for their adequate usage in cross-border risk management.
Chapter 3 empirically investigates the pricing of the aforementioned CfDs over the period between 2001 and 2006. It is shown that CfD prices contain signi…cant risk premia. Their sign and magnitude, however, di¤er substan- tially between areas and delivery periods, because areas are subject to transmission congestion to a varying extent. While the relation between risk premia and time-to-maturity is not uniform for CfDs, there is a nega- tive relation for implied area and system forwards, which can be explained by the relative hedging demand of market participants. In addition, we
…nd that risk premia of CfDs and implied area forwards vary systematically with the variance and skewness of the underlying spot prices. This con…rms both implications of the Bessembinder and Lemmon (2002) model.
Chapter 4 analyzes the valuation of day-ahead PTRs on the German-Dutch interconnector. From a …nancial perspective, PTRs are options written on the di¤erence between the German and Dutch hourly electricity prices.
Chapter 4 proposes a model for the valuation of day-ahead PTR options in-
corporating the unique characteristics of the underlying spread. The model
is empirically testes for all PTRs between 2001 and 2008, where each hour
of the day is modelled separately. Overall, especially for calm hours, the
approach constitutes an adequate model for the valuation of day-ahead
PTR options. Further, the estimated parameters show that during calm
hours PTR options are traded at a discount, while they trade at a premium
during turbulent hours. This premium can be explained by either hedging
demand or speculation of market participants. Finally, we …nd evidence for
seasonality in the residuals of hourly and monthly PTR option prices. For
monthly PTRs and hourly PTRs during turbulent hours, this seasonality
is strongly related to jumps in the underlying spread.
Electricity Markets and Derivatives
This chapter provides the fundamentals about electricity markets and the commodity electricity itself. It begins by describing how the structure of international electricity markets has evolved during the last decades. After- wards, this chapter discusses the main features electricity as a commodity exhibits and the implications of those unique characteristics for electricity prices. In the following, the most important derivative instruments in those markets are introduced including the currently prevailing approaches for modelling electricity prices. Finally, before the chapter closes with a short conclusion, the most important valuation models and the corresponding solution techniques for electricity derivatives are described.
7
2.1 Liberalization of Electricity Markets
The process of liberalization in international electricity markets and there- fore the breakup of monopolistic structures has its origin in Chile. Be- ginning in 1982, Chile began to separate electricity generation from sales ending an era of vertical integrated utilities. Only four years later, the Chilean electricity market was shaped by extensive privatizations leading to a competitive wholesale market for electricity. During the late 1980s and early 1990s the liberalization e¤orts spilled over to the European electricity market. The UK was the …rst country to adopt these e¤orts. Its electricity market, which comprised until 2005 England and Wales and since then also Scotland, was restructured based on the UK Electricity Act from 1989. The disbandment of the Central Electricity Generation Board (CEGB) was at the heart of this act. The CEGB was a vertically integrated monopoly cov- ering all steps of the value chain. The deregulation led to the England and Wales Electricity Pool, the …rst organized market place for electricity in the world. From the UK, the liberalization proceeded to Norway through the Norwegian Energy Act from 1991 resulting in the electricity exchange Nord Pool. While being a solely Norwegian exchange at the beginning, it quickly developed towards an international market place. In addition to Norway, Nord Pool currently comprises Sweden (since 1996), Finland (since 1998) and Denmark (since 2000).
In continental Europe, the liberalization started with the European Union
Directive 96/92/EG in 1997. This directive laid down rules with the aim
of a joint pan-European electricity market. Further, it postulated a clear
separation of monopolistic and competitive elements within the value chain
in the electricity market. While the …rst basically comprises all elements
related to the power grid, i.e. transportation and distribution, the latter
includes mainly generation and sales. This distinction is made in order
to introduce as much competition as possible and to prevent the exertion
of market power where competition is not feasible. Figure 2.1 shows the unregulated value chain in competitive electricity markets.
6Generation Exchange/
TradingOTC- Transportation Distribution Market Customers Sales
Regulation Competition
Competition
Figure 2.1: Disentangled value chain in the electricity market.
The European Commission has, however, not speci…ed a consistent time- line for the deregulation for individual countries. Rather, it determined minimum requirements where each country de…nes its own rate of imple- mentation. Although limited grid capacities hamper the complete consoli- dation of European electricity markets, a convergence of electricity prices is clearly visible.
7The deregulation in continental Europe has also led to the development of organized market places. The largest electricity exchanges, sorted by the year of origin in ascending order, are the Operado del Mer- cado Español de Electricidad (OMEL) in Madrid (1998), the Amsterdam Power Exchange (APX) in Amsterdam (1999), the European Energy Ex-
6
Cf. Schi¤er (2005) p. 203.
7
See Holler and Haberfeld (2006), Huisman et al. (2007) and Zachmann (2008) for an
analysis of the convergence of European electricity prices.
change (EEX) in Leipzig (emerged in 2002 from the merger of the European Energy Exchange in Frankfurt and the Leipzig Power Exchange), the Pow- ernext in Paris (2002), the Energy Exchange Austria (EXAA) in Vienna (2002) and the Italian Power Exchange (IPAX) in Rome (2004).
2.2 Electricity as a Commodity
This sections …rstly describes the fundamentals of electricity from a more technical perspective a sheds some light on the underlying features that make electricity so unique as a commodity. Secondly, the characteristics of electricity that are directly derived from the aforementioned technical features of electricity, are discussed.
2.2.1 Fundamentals of Electricity
Electricity is di¤erent from other commodities in various aspects. First, electricity is always delivered over a speci…c period of time as its usage is not feasible at a speci…c point in time. Therefore, electricity is considered a ‡ow commodity. Any agreement concerning the delivery of electricity thus, has a temporal dimension to it. The most common contracts com- prise hours, weeks, months and years. Although there are further products available, both exchange traded and OTC, these usually include any com- bination of the above. Another characteristic of electricity is its limited storability. Although electricity is theoretically storable via pumped stor- age facilities, this approach is currently not feasible in most European countries on a large scale and at reasonable cost.
8Last, electricity is grid
8
According to the German Federal Ministry for the Environment, Nature Conservation
and Nuclear Safety (2008), only 3.4% of all electricity consumption in Germany came
bound and therefore its delivery requires an existing power grid. In addi- tion, electricity spreads across the entire network as soon as injected into the system. Therefore, a simple point to point delivery in electricity mar- kets in not feasible. Moreover, every customer receives an electricity mix across di¤erent suppliers and various generation fuels. This however, poses no harm due to the perfect fungibility of electricity.
The grid boundness and non-storability require an independent system operator in charge of the functionality of the entire power system. These are the transmission system operators (TSOs). In Germany, there are four TSOs corresponding to the respective interconnections in the German elec- tricity market. These include EnBW in the south-west, E.ON in northern, central and southern Germany, RWE in the west and south and Vattenfall in east Germany and Hamburg. Figure 2.2 illustrates the German electric- ity market and its four TSO regions.
TSOs need to ensure that at every point in time the demand and supply in the market are balanced. Since TSOs cannot simply store electricity to dampen shocks to supply or demand, they depend on consumers and generators in case of a sudden mismatch. On the supply side, electricity producers are obliged to provide a certain amount of capacity that TSOs are allowed to call on short notice. On the demand side, TSOs can cut o¤ speci…c customers if needed. This procedure is called a rolling black- out. Customers who agree to accept a rolling blackout beforehand usually receive a price discount.
9from hydro power utilities in 2007. One exception, however, might state Norway. There, hodro power had a share of over 98% of all power generation in 2007. See Nordel (2009) for further details on the Norwegian electricity market.
9
See Konstantin (2009), especially chapter 9.1, for a detailed discussion of the TSO busi-
ness in Europe.
RWE
E.ON EnBW
Vattenfall
RWE
Figure 2.2: TSO map of the German electricity market.
In cross-border electricity markets, the problems for TSOs also apply. How- ever, there is an additional challenge concerning the grid boundness of elec- tricity. As mentioned above, electricity cannot be delivered point to point as it spreads across the entire system as soon as injected. The main problem of this characteristic can be emphasized by a simple example.
10Assum- ing a three node electricity network, e.g. Germany (GER), France (FRA)
1 0
Our example is based on the example of Stoft (2002) chapter 5.4. The reader is also
refereed to ibid. for a detailed analysis of the technical characetristics of cross-border
power grids.
and the Netherlands (NL). Further, all nodes are mutually connected by power lines with limited capacity given next to each line. Moreover, there are 150 MW supplied in Germany and there is a load (demand) of 150 in the Netherlands. Let us also assume that all lines are of the same length and share the same characteristics concerning their impedance.
11Figure 2.3 shows the setup of our example.
FRA
NL
GER
100 MW 180 MW
50 MW
150 MW 150 MW
Figure 2.3: Three node power grid including Germany (GER), France (FRA) and the Netherlands (NL) with limited capacity.
In our example, 150 MW of electricity ‡ow from Germany to the Nether- lands using both routes, i.e. directly and via France. This characteristic is called loop ‡ow and governed by Kirchho¤’s Law stating that electricity spreads across an entire system via the path of least resistance. However, as the indirect path has twice the impedance, only one third of the total current ‡ows via France, i.e. 50 MW. The other 100 MW ‡ow directly.
The problem of this feature becomes evident once we increase the load to
1 1
Impedance can be seen as a generalization of resistance. It describes how di¢ cult it is
for electricity to ‡ow over a given path.
180 MW, i.e. both supply and demand increase to 180 MW. If we supplied 180 MW in Germany, 60 MW would ‡ow via France exceeding the given capacity. Therefore, we would need additional supply from France in or- der to realize this generation set up. If we assume that it is economically optimal for Germany to supply as much electricity as possible, we need to introduce another important feature of electricity in order to determine the optimal production plan in order to realize the total load of 180 MW.
Opposite currents in a power system cancel out. This means that for every MW supplied in France one more MW can be supplied in Germany. Thus, it is optimal, given the above assumptions, to supply 165 MW in Germany and 15 MW in France.
12This little example shows that limited capacity of one cable could hamper electricity ‡ows via another connection. Although this characteristic also applies in national electricity markets, it is of par- ticular interest in cross-border markets due to the scarcity of capacity. In fact, situations are quite common where a congested cable between Ger- many and France prevents the delivery of electricity via a non-congested cable between Germany and the Netherlands.
The occurrence of congestion in our example addresses two relevant topics in cross-border electricity markets. These are the calculation of locational prices (i.e. transmission pricing) and the allocation or valuation of trans- mission capacities in case of congested power markets. For the calculation of locational prices, there are currently two approaches applied in interna- tional electricity markets. These two are nodal transmission pricing, used, for example, in New York and the Pennsylvania-New Jersey-Maryland (PJM) market, and zonal transmission pricing, used, for example, in Aus-
1 2
Given 165 MW are supplied in Germany and 15 MW in France, two-thirds of each load
travel the short, i.e. direct, distance to the Netherlands. One-third travels the indirect
paths. Thus, from Germany, 55 MW ‡ow via France to the Netherlands and 5 MW ‡ow
from France via Germany to the Netherlands. Since opposite currents cancel out, the
net ‡ow between Germany and France complies with the capacity limit of 50 MW.
tralia, California and the Nordic market.
13With nodal pricing, the loca- tional marginal price (LMP), i.e., the price of inducing an additional MW of electricity, is calculated for each node (i.e., every point in the grid where electricity is added or removed) in the electricity network. Zonal pricing, in contrast, groups nodes that are connected by non-congested power lines into zones (or areas). Within each zone, the LMP is identical across all nodes and referred to as the zonal market clearing price (ZMCP). Figure 2.3 is an example of zonal pricing, where within each zone (country) the ZMCP is identical. While nodal pricing is considered more e¢ cient but rather complex, zonal pricing is considered simplistic but more transpar- ent.
Based on the distinction between zonal and nodal pricing, three approaches for the allocation of transmission rights have evolved. These comprise the contract path model, the ‡ow based model and the point-to-point model.
While the …rst two are usually applied in the context of zonal pricing, the latter requires nodal pricing. The contract path model is a rather naive way of allocating transmission capacity. In a …rst step, the total transfer capacity (TTC) is calculated as the maximum available capacity that may be transferred between two zones considering existing security standards.
14Considering the so called transmission reliability margin (TRM), in order to account for unintended physical ‡ows or measurement errors, leads to the net transfer capacity (NTC). After subtracting the already allocated capacity, e.g. from long-term delivery agreements, we …nally receive the available transmission capacity (ATC). Based on the ATC, transmission
1 3
Further approaches discussed in the literature are Chao-Peck pricing (Chao and Peck (1996)) and uniform pricing (Green (2007)). See Kristiansen (2004b) for a short discus- sion of these approaches.
1 4
UCTE (2004) de…nes the so called
n 1criterion. It states that the breakdown of one
element of the power grid, e.g. one power cable or a transformer, must be compensated
by the other elements in the system.
capacity between two zones is allocated where it is assumed that the elec- tricity ‡ows directly between the two zones ignoring the occurrence of loop
‡ows.
15The ‡ow based approach adjusts for this shortcoming. It is based on the power transfer distribution factor approach (PTDF) which incor- porates the actual power ‡ows among zones independent of the announced contract path. Once the delivery of electricity across zones is announced, the PTDF matrix transfers the intended delivery into the resulting power
‡ows across all zones. While the contract path model only requires the cooperation of the two included TSOs, the ‡ow-based approach requires a joint organization of all TSOs within the market. In this case, the TSOs are usually replaced by a centralized ISO (independent system operator) which allocates the path dependent transmission rights. Although the ‡ow-based model o¤ers more ‡exibility and allows loop ‡ows across zones, intra-zone electricity ‡ows are still not considered posing a considerable shortcoming.
In the point-to-point model, which implies nodal pricing, the ISO cen- trally schedules all trades within the power grid. The ISO then computes the LMP for each node within the system.
16In order to clarify the distinction between contract path, ‡ow-based and the poitn-to-point model, we refer to our previous example from Figure 2.3.
In a contract path approach, transmission capacity between Germany and the Netherlands is allocated only based on the utilitzation of the line be- tween those two countries. Any other restrictions occurring from loop ‡ows are neglected. The ‡ow based model resolves this problem by considering the loop ‡ow from Germany via France to the Netherlands. However, as
1 5
Although the contracts path methodology itself does not refer to any particular trans- mission pricing, it is generally applied in the context of zonal pricing.
1 6
Although relevant in the context of cross-border electricity markets in principle, a thor-
ough analysis of the power grid economics is beyond the scope of this thesis. We therefore
refer to Hogan (1998), Hogan (1999) and Ru¤ (2001) for a comprehensive discussion of
transmission pricing.
every country is assumed to be one zone, i.e. there is no congestion within those zones, intrazonal electricity ‡ows are not considered. The point-to- point model corrects this shortcoming by not considering any zones, but by looking at each node within the entire power grid separately. Is this model, ‡ows from every node are considered and calculated.
Although our discussion of cross-border electricity markets is based on the interconnections of three countries, cross-border electricity markets are not de…ned based on nationalities. Rather, cross-border electricity markets are all markets that are connected by interconnections with a limited capacity.
Within Germany, there has not yet been any congestion between the four TSO areas. Because of this attribute as a single electricity market without congestion, Germany is also considered as a copperplate. However, Wawer (2007) discusses the risk of congested powerlines within the German mar- ket. This risk is driven by growing generation capacities in the north and decreasing capacities in the south of Germany leading to increasing intra- national electricity ‡ows. One reason for this development is the growing installation of wind generators in North Germany and especially its o¤- shore regions. Considering the 22.247 MW of installed capacity by the end of 2007,
17an estimated 10.000 MW of additionally planned capacity in o¤shore wind parks are a substantial contribution. Another reason is the agglomeration of new power plants in North Germany in combination with the continuing shut down of power plants in the south. Out of the 30.000 MW of new capacity planned until the year 2015, the majority of this ca- pacity will be located around Brunsbüttel, Wilhelmshafen and the Ruhr.
On the other hand, the nuclear power phase-out will result in a reduction of about 8.000 MW of installed capacity until 2015. Therefore, congested electricity markets are not limited to cross-national interconnections and the existence of cross-border electricity markets within national markets is
1 7
Cf. Federal Ministry for the Environment, Nature Conservation and Nuclear Safety
(2008) p. 11.
a pending threat for the German electricity market.
2.2.2 Characteristics of Electricity Prices
2.2.2.1 National Markets
The unique characteristics of electricity as a commodity have a signi…cant impact on electricity prices. Moreover, they determine the entire setup of the electricity market. The fundamental market segment in the elec- tricity market is, analogous to …nancial markets, the spot market. This market segment, however, di¤ers from traditional …nancial spot markets.
This distinction is based on two key aspects of electricity already intro- duced. First, electricity trading has always a temporal dimension to it, as described above. Therefore, the spot market partitions every day into 24 block of 60 minutes for which electricity is sold separately.
18As the demand for electricity varies considerably during the day, choosing less than 24 par- titions per day does not accommodate the speci…c demand characteristics.
Selling electricity implies that for the respective hour, a prede…ned volume of electricity, usually multiples of 1 MW, is constantly delivered. Thus, one contract in the spot market implies the energy of 1 MWh. The other main feature of the electricity spot market is in‡uenced by the fact that electricity cannot be delivered instantaneously. Rather, its supply requires a speci…c leadtime. Moreover, in case of sudden variations in the supply TSOs cannot guarantee the balance of the power grid. Thus, leadtime is essential from both a technical and a stability point of view.
For the above discussed reasons, the spot market for electricity is in general
1 8
Although the distinction of 24 hours is most common, other setups are also possible. In
the UK, for example, every day is devided into 48 blocks of 30 minutes.
de…ned as a day-ahead market where the day before delivery electricity is auctioned separately for each hour of the following day. In case of a weekend or holiday, the auction is held on the previous working day. The average of all 24 hourly day-ahead prices is called the baseload price.
19In addi- tion, the mean of the hourly prices between 8am and 20pm, i.e. the twelve hours with the highest demand, constitutes the peakload price.
20Besides the day-ahead auction, several exchanges have established intraday market places during the last years. There, electricity is continuously traded with a leadtime between 60 and 90 minutes. At the German EEX for exam- ple, the intraday market opened on September 25, 2006 and allows trading di¤erent blocks of hours for the next day with a leadtime of 75 minutes. Al- though intraday markets have become more and more liquid, their volumes are still signi…cantly below those of the day-ahead auctions.
21Therefore, throughout this thesis, we will denote the day-ahead auction as the spot market.
In an e¢ cient market, prices are determined by marginal costs. This also holds in electricity markets. In order to determine the marginal cost func- tion, electric utilities align their generating plants in ascending order. This alignment also holds for various generators within a speci…c power plant.
The resulting marginal cost function is called power stack or merit order.
The power stack is a convex function of load with a small slope for lower production values. As load increases, however, marginal costs rise steeply.
In those regions of the supply curve, minor changes in the demand curve result in extreme variations in the resulting price. The actual marginal
1 9
Throughout this paper, the baseload price is also considered the daily price.
2 0
Although baseload and peakload price are the most prominent average values and are the underlying of several exchange traded and OTC derivatives, other mean values across arbitrary hours are possible. See for example http://eex.de for other blocks of hours.
2 1
Out of a total spotmarket volume of 154.4 TWh at EEX in 2008, the intraday market
constituted only 2.3 TWh.
costs of a power plant are signi…cantly determined by fuel prices, e.g. coal, natural gas, CO
2, and can even a¤ect the order of power plants within the power stack. Moreover, shutdowns of power plants also in‡uence the shape of the cost function. While these are in general scheduled, mostly due to maintenance measures, they can also occur unexpected leading to a shock of the supply curve.
Besides the supply curve, the demand curve is also subject to considerable variations based on varying demand. Concerning their demand patterns, we can distinguish industrial, commercial and private customers. Based on this distinction, demand varies depending on the hours of the day, the day of the week as well as working vs. non-working days. The variations are easily predictable due to their consistency. There are, however, variations in demand that are harder to predict as they are subject to uncertainty. Here, especially weather driven changes in demand are of relevance.
22In addition to the hardly predictable weather information, its impact on electricity prices shows regional discrepancies. In the USA for example, the demand for electricity increases dramatically in the summer due to the intensive usage of air conditioning. In colder regions in contrast, electricity demand is usually higher during colder months based on longer lighting periods and electric heating devices.
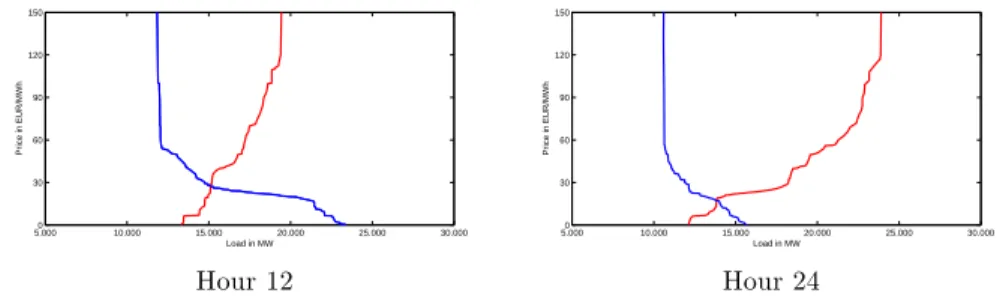
Figure 2.4 shows the aggregated supply and demand curves at EEX on February 22, 2007 for hour twelve and 24.
23For both hours, the convex shape of the supply and demand curve is clearly visible. Also the …gure shows an increased demand for hour twelve compared to hour 24. The
2 2
Among others, Weron (2006) and Pirrong and Jermakyan (2008) use temperature and precipitation as exogenous variables in order to model electricity prices.
2 3
The supply and demand curves in Figure 2.4 are based on actual auction results observed
at the EEX day-ahead auction for the respective hours, where each market participant
submits combined price/volume bids.
5.0000 10.000 15.000 20.000 25.000 30.000 30
60 90 120 150
Load in MW
Price in EUR/MWh
Hour 12
5.0000 10.000 15.000 20.000 25.000 30.000
30 60 90 120 150
Load in MW
Price in EUR/MWh
Hour 24
Figure 2.4: Supply (right) and demand (left) curves for the day-ahead auction at EEX on February 22, 2007.
reduced supply for hour twelve can be either due to power plant outages or, more likely, due to lesser available capacity based on prior delivery agreements. The inelastic part of the demand curve indicates the minimum volume required at any cost.
The speci…c characteristics of electricity are re‡ected by observed market prices. The non-storability and the need of a permanent match of supply and demand can result in extreme price variations. These extreme price movements are most like when demand is already high, i.e. at the steep end of the supply curve. The non-storability of electricity also induces the existence of negative electricity prices. In some cases it is more reasonable for a utility company to pay someone for the use of electricity than to shut down a power plant in order to reduce production.
24Further, seasonal patterns in the demand are also visible in electricity prices. The seasonality
2 4
The existence of negative prices depends on the costs of shutting down and …ring up a
plant and the required leadtime. At the EEX, negative prices were introduced Septem-
ber 1, 2008. The …rst negative electricity price was observed for hour 6 on October 5,
2008. Between September and December 2008, 15 negative prices for single hours were
observed. On a daily basis, there has not yet been a negative price.
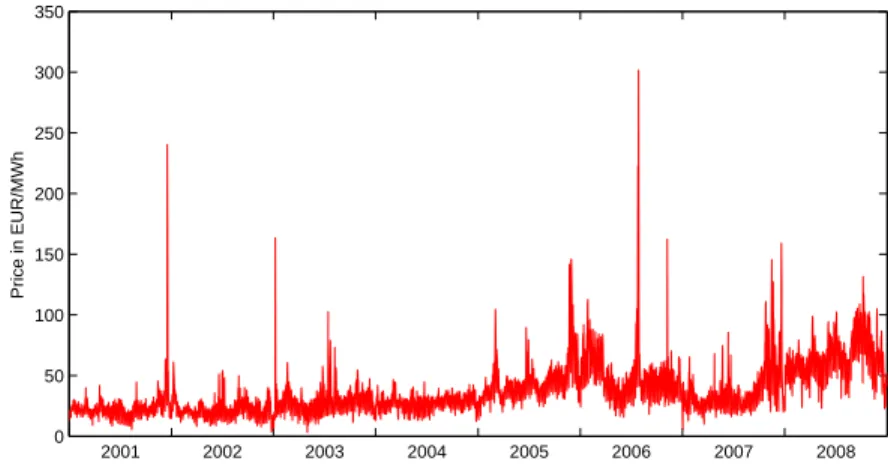
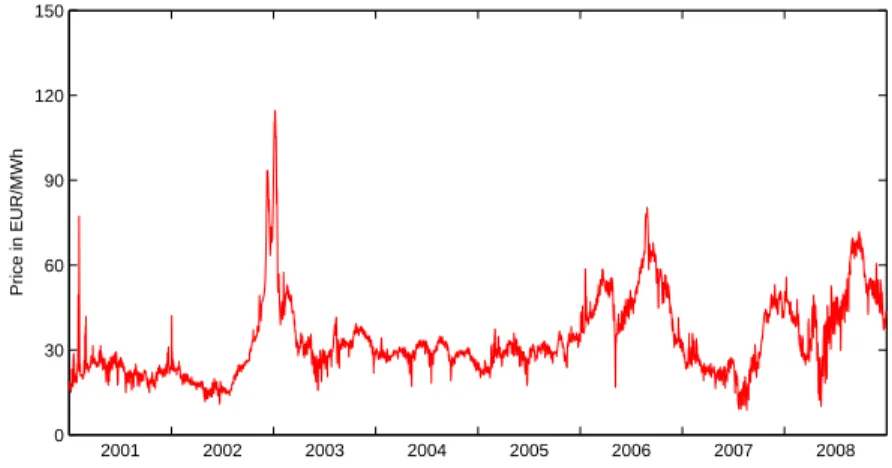
does not only appear on an annual basis but also intraday and across the week as discussed above. Figure 2.5 shows the daily spot prices at the EEX between 2001 and 2008.
2001 2002 2003 2004 2005 2006 2007 2008
Price in EUR/MWh
0 50 100 150 200 250 300 350
Figure 2.5: Daily spot prices at EEX between 2001 and 2008.
Figure 2.5 …rstly shows that prices are not governed by a persistent trend but rather ‡uctuate around a certain level. The mean-reversion characteris- tic is symptomatic for electricity markets and indicates only a loose connec- tion between intertemporal prices. This is based on the short-term nature of shocks to the supply and demand. Supply shocks generally occur in case of sudden breakdowns in the generation park which are resolved within a few days in most cases. Demand shock have an even shorter impact. Due to the non-storability of electricity, intertemporal electricity prices are con- sidered as distinct assets and therefore their demand is not directly linked.
Thus, supply and demand ‡uctuate around a given level resulting in the
mean-reversion behavior of electricity prices. The mean-reversion feature
was formally analyzed, among others, by Weron (2002). He shows that
the Hurst exponent for prices at the California Power Exchange (CalPX)
exhibit a value signi…cantly smaller than 0.5 which indicates nonpersistent
trends and therefore mean-reversion.
Another striking characteristic of electricity prices are the extreme occa- sional jumps. These jumps usually vanish within a few days and have an enormous impact on the overall risk in the electricity market. The stan- dard deviation of daily returns over the above illustrated period was 47%.
This value is not annualized but based on daily data. If we break down the overall standard deviation, we see major di¤erences across hours. While the standard deviation for hour 14 is 89%, the corresponding value for hour 23 is only 18%. In addition to standard deviation, the jumps have also a considerable impact on the higher moments of the distribution of electricity prices. Between 2001 and 2008, daily spot price have a skewness (kurtosis) of 2.43 (14.32). These values con…rm the impact of observed jumps and indicate signi…cant outliers, where positive outliers are more likely than negative ones. The higher moments also vary largely across hours. For the …rst hour of the day, the skewness (kurtosis) is 1.06 (0.73) in contrast to values of 21.16 (627.29) for hour 19. These results support the …ndings of Huisman and Huurman (2003) and Weron (2005) who …nd fat tales in the distribution of electricity prices in the Netherlands and Germany respectively.
Besides their erratic behavior, daily prices are subject to seasonality on an hourly, daily and annual basis. Although the seasonality is not visible at
…rst sight from …gure 2.5, due to the small scale, it becomes evident when
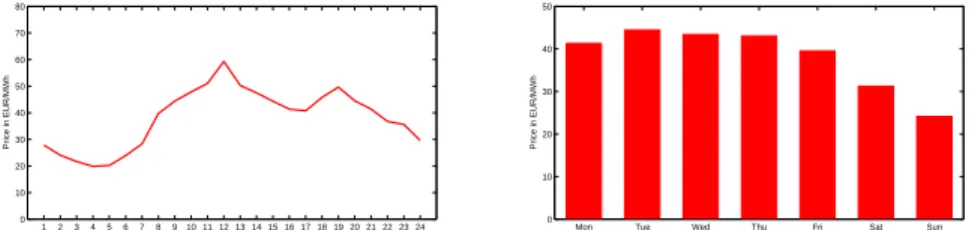
looking at aggregated mean hourly or daily prices. The intraday seasonality
is shown in Figure 2.6 (left). This so called double peak pattern emphasizes
that prices throughout the day di¤er signi…cantly. While prices between
hours three and …ve are around 20 EUR, their values increase 60 EUR and
50 EUR for hours twelve and 19 respectively. The intraday seasonality is
con…rmed for prices at the EEX by Burger et al. (2004). They show a clear
autocorrelation for hourly prices at lag 24 between January 2001 and June
2002.
1 2 3 4 5 6 7 8 910 11 12 13 14 15 16 17 18 19 20 21 22 23 24 0
10 20 30 40 50 60 70 80
Hour of the Day
Price in EUR/MWh
Mon Tue Wed Thu Fri Sat Sun
0 10 20 30 40 50
Day of the Week
Price in EUR/MWh
Figure 2.6: Average spot prices per hour of the day (left) and day of the week (right). Calculations are based on daily EEX prices between January 1, 2001 and December 31, 2008.
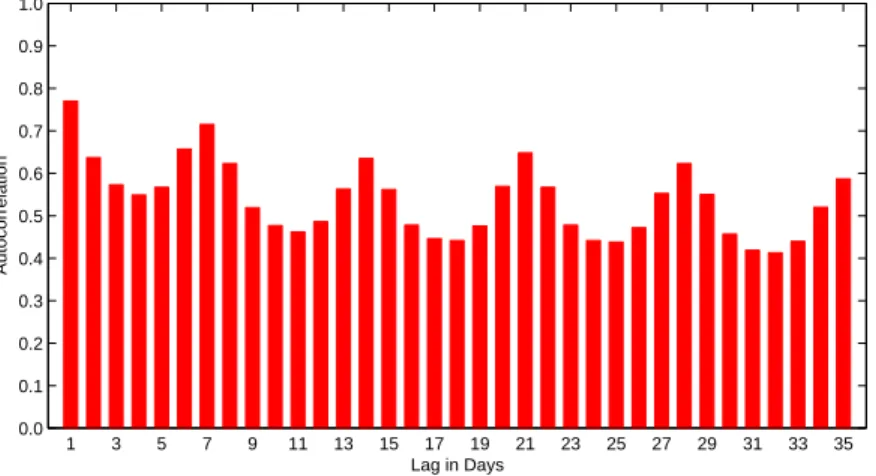
The intra-week seasonality becomes evident when looking at daily aver- age electricity prices. Figure 2.6 (right) shows the mean baseload price per weekday at EEX between 2001 and 2008. While prices on Monday through Thursday di¤er only slightly, the drop towards the weekend is striking with minimum prices on Sundays. The weekly seasonality is con…rmed for Dutch electricity prices by Huisman and Huurman (2003). They show that the logarithm of daily spot prices between January 2001 and July 2003 were on average 0.29 lower on Saturdays and 0.64 on Sundays compared to the overall mean price. Besides clear patterns in the intra-week spot prices, weekly seasonality is con…rmed by an analysis of the autocorrelation func- tion (ACF) of daily spot prices. Figure 2.7 shows the ACF function for daily spot prices at EEX between 2001 and 2008. The increased values for lag multiples of seven are clearly visible. The weekly seasonality in electric- ity prices is con…rmed by Weron (2006) for prices from the CalPX between May 1998 and April 2000. He also shows a signi…cant autocorrelation with a lag of seven days.
The last type of seasonality, i.e. on an annual level, is also evident in elec-
tricity prices. Although, due to the erratic behavior and extreme jumps
in daily prices, the annual seasonality is not as pronounced in Figure 2.5.
1 3 5 7 9 11 13 15 17 19 21 23 25 27 29 31 33 35 0.0
0.1 0.2 0.3 0.4 0.5 0.6 0.7 0.8 0.9 1.0
Lag in Days
Autocorrelation
Figure 2.7: Autocorrelation function of daily spot prices at EEX between January 1, 2001 and December 31, 2008.
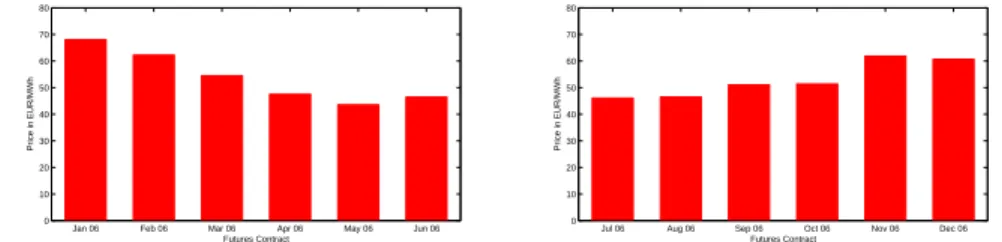
When looking at monthly futures contracts, however, this seasonality is emphasized. Figure 2.8 shows the futures curve for month futures at EEX for the year 2006. In order to depict an entire annual cycle, we observe fu- tures prices at two di¤erent dates throughout the year, since only the next six month contracts are simultaneously traded. The futures prices clearly show an annual seasonality with generally lower prices in the summer and higher ones in the winter. This characteristic pattern is determined from the supply as well as the demand side. Due to longer lighting hours and electricity based heating, demand in Germany is in general higher during the winter. On the supply side, higher natural gas prices during the win- ter, based on extensive heating, lead to a steeper supply curve an thus, to generally higher prices.
252 5
See Routledge et al. (2001) and Douglas and Popova (2008) for a discussion of the
relationship between natural gas and electricity prices.
Jan 06 Feb 06 Mar 06 Apr 06 May 06 Jun 06 0
10 20 30 40 50 60 70 80
Futures Contract
Price in EUR/MWh
Jul 06 Aug 06 Sep 06 Oct 06 Nov 06 Dec 06
0 10 20 30 40 50 60 70 80
Futures Contract
Price in EUR/MWh
Figure 2.8: Prices of monthly futures contracts at EEX. Figures are based on closing prices from December 14, 2005 (left) and Jume 14, 2006 (right).
2.2.2.2 Cross-border markets
In cross-border markets, derivatives are generally written on the spread between two local electricity prices. This spread may either be positive or negative. Further, neighboring prices are often subject to the similar market forces, especially in Europe, and both prices exhibit the above described characteristics. Thus, most characteristics of national electricity prices carry over to cross-border markets while some, in contrast, cancel out. Adjoining market areas in Europe share distinct demand patterns.
This does not only cover intraday or intra-week demand, which is probably quite similar throughout the world. As these markets are generally subject to identical climatic conditions, the demand pattern accord even on an annual basis. Therefore, seasonality in both areas is expected to be at least comparable and thus, the seasonality evident in national prices is not observed in cross-border markets.
In contrast to seasonality, mean-reversion and the characteristic jumps in
national electricity prices, carry over to cross-border markets. Since na-
tional prices revert back to a long-term mean, so obviously does their
spread. Moreover, as the national prices often follow similar long-term
means, as discussed in the preceding paragraph, the spread generally ‡uc-
2002 2003 2004 2005 2006 2007 2008
−150
−100
−50 0 50 100 150
Price in EUR/MWh
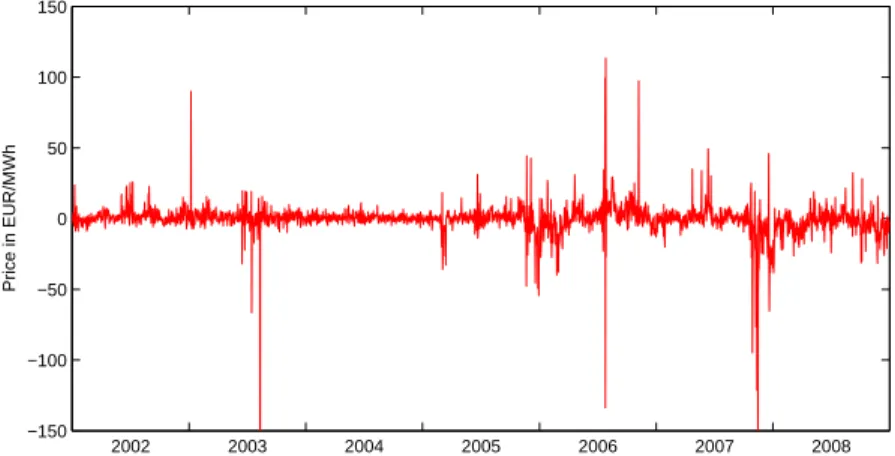
Figure 2.9: Daily spread between EEX and Powernext spot prices between 2002 and 2008.
tuates around zero. However, depending on the overall price level in ad-
joining markets, mostly a¤ected by di¤erent power generation mixes, the
mean-reversion level in cross-border markets may be also positive or nega-
tive. In addition to mean-reversion, the typical spikes in national electricity
prices are also evident in cross-border spreads. As jumps are usually based
on a temporal shock in demand or supply, they are idiosyncratic and there-
fore also observable in price spreads. Moreover, jumps are more frequent
in cross-border markets and can be either positive or negative. Figure 2.9
shows the spread between German and French spot prices between 2002
and 2008 where a positive spread correspond to higher prices in Germany
and vice versa. This …gure depicts the just discussed characteristics of
electricity prices in cross-border electricity markets.
2.3 Derivatives in Electricity Markets
This section introduces the basic derivative contracts in electricity mar- kets, where we distinguish national as well as cross-border markets. In addition, we further explain the most relevant approaches in national and cross-border electricity market for modelling electricity prices. This section therefore constitutes the basis for the valuation of derivatives contracts dis- cussed later in this thesis.
2.3.1 Derivative Products
2.3.1.1 National Electricity Markets
A derivative is de…ned as a "...…nancial instrument whose value depends on (or derives from) the values of other, more basic, underlying variables.".
26Derivatives allow for the purchase or the sale of electricity in the future and their execution is in general binding for the issuer and may be binding or optional for the buyer. Compared to the electricity spot market, its derivatives counterpart is by far larger.
27In electricity markets, on a …rst level one generally distinguishes physically from …nancially settled derivatives. For physically settled derivatives, the actual good, i.e. electricity, is delivered in exchange for an ex ante agreed price. In case of …nancially settled derivatives, the good is not physically delivered but only payments are exchanged. Although …nancial derivatives are more important and the most liquid ones based on exchange traded
2 6
Cf. Hull (2009), p. 1.
2 7
The trading volume of the derivatives market at the EEX was about 1.165 TWh in 2008
including OTC clearing.
volumes, physical contracts are also of high relevance especially in the OTC market.
The most important derivative in the electricity market is the forward or futures contract.
28These mutually binding contracts are either …nancially or physically settled, where the …rst are by far more liquidly traded. During their delivery period, the buyer of a forward usually pays the reference price and receives the daily spot price (either peakload or baseload) in exchange.
29Since the delivery of electricity needs a temporal dimension, so does the forward contract. Therefore, contracts are traded at EEX on a monthly, quarterly and yearly basis, where for each contract type, baseload and peakload prices are distinguished. The payo¤ of a forward contract can thus be written as
Payo¤
F orward= 1 T
2T
1T2
P
t=T1
(P
tF ) : (2.1)
Here, P
tindicates the spot price at time t and F is the …x forward price.
T
1and T
2are the …rst and last day of the delivery period respectively. In case of a futures contract at EEX, the payo¤ slightly changes. Since the futures contract is traded during the delivery period and also marked to market every day, the payo¤ becomes
2 8
Whether forwards or futures contracts are the dominant derivative varies with the ob- served market place. While at the EEX only futures contracts are traded, at Nord Pool forwards are prevailing, with the exception of day and week contracts.
2 9
Since …nancially settled futures comprise the exchange of …nancial payments, they are
stricitly speaking swap contracts. However, we apply the common nomenclature and
refer to these contracts as futures or forward contracts. See Benth et al. (2008b) for a
further discussion on the swap characterisitcs of futures contracts.
Payo¤
F uture= 1 T
2T
1T2
P
t=T1
(F
tF
t 1) : (2.2)
F
t 1is the settlement price of the futures contract on the previous day.
Thus, the total ex-post payo¤ of a futures contract on electricity is, anal- ogous to the equity market, the sum of all daily marking to market pay- ments.
Besides mutually binding derivatives, options contracts are also widely used in electricity markets. The buyer of such an option has the right, but not the obligation to buy or sell electricity at maturity. Analogous to equity options, European and American options are the most common contracts. Other characteristics, such as Bermudan or Asian style options, are also traded especially in the OTC market. The payo¤ of a plain-vanilla call option with a strike price of K is
Payo¤
Call= 1 T
2T
1T2
P
t=T1
(P
tK)
!
+: (2.3)
While options directly written on the electricity spot price are usually
traded OTC, exchange traded options are mostly written on other deriva-
tives such as futures contracts. Besides plain-vanilla derivatives explained
above, more complex options (or exotics), are also very important in the
electricity market. The two most relevant are spark-spread contracts and
swing options. Spark-spread contracts are traded as forwards or options
and are written on the di¤erence between the electricity price and the
price of the generating fuel. When calculating the payo¤ of a spark-spread
option, both parties agree on a heat rate, measured in Btu/kWh.
30Thus, the payo¤ of a spark-spread option can be written as
Payo¤
Spark Spread= 1 T
2T
1T2
P
t=T1
(P
tH V
t)
!
+; (2.4)
where V
tis the price of the generating fuel and H is the heat rate described above. While the term spark-spread refers to natural gas as the generating fuel, other fuels also involve di¤erent terms for the spark-spread contract.
In case of coal, these contracts are also referred to as dark-spread contracts.
For emission allowances one often …nds the term clean- or green-spread.
However, all of these contracts refer to the di¤erence between the electricity price and one resource fuel needed to generate electricity. While those contracts are mostly OTC traded, there are also contracts listed at a few exchanges, e.g. New York Mercentile Exchange (NYMEX).
When exercising plain-vanilla or spark-spread contracts, the holder of the option needs to exercise the option before the delivery period starts and therefore faces the risk of uncertain price movements throughout the deliv- ery period. Further, the amount of electricity delivered is constant for the entire delivery period once the option is exercised. Since these contracts can have delivery periods of several months, the price and volume risk for the holder might be substantial. Swing-options reduce those risks as they allow for adjustments of the delivery volume during the delivery period.
A swing-option does not only de…ne the baselevel of electricity delivery during the delivery period, but also a certain number of allowed up and down swings. These swings allow the holder to increase or decrease the
3 0