1. Introduction
From the analysis of satellite data, a rapid decrease of the present-day Earth's magnetic (geomagnetic) field strength (intensity) is observed, thus raising the question of whether Earth is currently approaching a po- larity reversal (e.g., Hulot et al., 2002; Pavón-Carrasco & De Santis, 2016) or not (Brown et al., 2018). Con- straining the past evolution of intensity (paleointensity) can provide context for this scenario and help us to understand fundamental properties of the geomagnetic field, such as the long-term average dipole moment and how the field's strength is related to polarity reversals, reversal frequency and secular variation (e.g., Cox, 1968).
Generally, paleointensity minima are associated with magnetic excursions and reversals but they are not al- ways associated with these events (Channell et al., 2020). Identifying a relationship between dipole strength
Abstract
Constraining the long-term variability and average of the Earth's magnetic field strength is fundamental to understanding the characteristics and behavior of the geomagnetic field. Questions remain about the strength of the average field, and the relationship between strength and reversal frequency, due to the dispersion of data from key time intervals. Here, we focus on the Cretaceous Normal Superchron (CNS; 121-84 Ma), during which there were no reversals. We present new intensity results from 41 submarine basaltic glass (SBG) sites collected on the Nicoya Peninsula and Murcièlago Islands, Costa Rica. New and revised 40Ar/39Ar and biostratigraphic age constraints from previous studies indicate ages from 141 to 65 Ma. One site with an age of 135.1 ± 1.5 Ma (2σ) gave a reliable intensity result of 34 ± 8 µT (equivalent to a virtual axial dipole moment, VADM, value of 88 ± 20 ZAm2), three sites from 121 to 112 Ma, spanning the onset of the CNS, vary from 21 ± 1 to 34 ± 4 µT (53 ± 3 to 87 ± 10 ZAm2). These results from the CNS are all higher than the long-term average of ∼42 ZAm2 and data from Suhongtu, Mongolia (46–53 ZAm2) and are similar to the Troodos Ophiolite, Cyprus (81 ZAm2, reinterpreted in this study). Together with the reinterpreted data, the new Costa Rica results suggest that the strength of the geomagnetic field was approximately the same both before and after the onset of the CNS. Therefore, the data do not support a strict correlation between polarity interval length and the strength of the magnetic field.Plain Language Summary
Understanding the Earth's magnetic field behavior in the past is important to validate geodynamo simulations. However, because of the paucity of available data, it is poorly understood. In particular, it has been argued that the strength of the Earth's magnetic field, or paleointensity, was correlated with the stability of the field, where a strong field was less prone to magnetic reversals than a weak field. Hence, we have investigated the anomalously long period of stability, the Cretaceous Normal Superchron (CNS) during which no magnetic reversals occurred. Our new data from Costa Rican basaltic glasses, together with reinterpreted data from Inner Mongolia and the Troodos Ophiolite in Cyprus, suggest that the magnetic field during the CNS was similar to the present- day field and these high values are nearly twice the long-term average value for the last 200 Ma. However, high field values were also detected in the period prior to the onset of the CNS, hence our data do not support a strict correlation between strength and stability of the Earth's magnetic field.© 2021. The Authors.
This is an open access article under the terms of the Creative Commons Attribution License, which permits use, distribution and reproduction in any medium, provided the original work is properly cited.
A. Di Chiara1,2 , L. Tauxe2 , H. Staudigel2, F. Florindo1 , M. Protti3 , Y. Yu4 , J.-A. Wartho5, P. van den Bogaard5, and K. Hoernle5,6
1Istituto Nazionale di Geofisica e Vulcanologia, Rome, Italy, 2Scripps Institution of Oceanography, La Jolla, CA, USA,
3Observatorio Vulcanológico y Sismológico de Universidad Nacional de Costa Rica, Heredia, Costa Rica, 4Department of Geological Sciences, Chungnam National University, Daejeon, Korea, 5GEOMAR Helmholtz Centre for Ocean Research Kiel, Kiel, Germany, 6Kiel University, Kiel, Germany
Key Points:
• The Cretaceous Normal Superchron (CNS) is key to understanding geomagnetic field behavior
• We present new paleointensity data from Costa Rica over an age range of 135–112 Ma, spanning the onset of the CNS
• We find that field strength was high both prior and during the early CNS, which does not support a correlation between field strength and stability
Supporting Information:
Supporting Information may be found in the online version of this article.
Correspondence to:
A. Di Chiara,
dichiaraanita@gmail.com
Citation:
Di Chiara, A., Tauxe, L., Staudigel, H., Florindo, F., Protti, M., Yu, Y., et al. (2021). Earth's magnetic field strength and the Cretaceous Normal Superchron: New data from Costa Rica.
Geochemistry, Geophysics, Geosystems, 22, e2020GC009605. https://doi.
org/10.1029/2020GC009605 Received 21 DEC 2020 Accepted 12 MAR 2021
and magnetic reversals (Biggin & Thomas, 2003; Biggin et al., 2012; Constable et al., 1998; Cox, 1968; In- gham et al., 2014; Kulakov et al., 2019; Larson & Olson, 1991; Loper & McCartney, 1986; McElhinny &
Larson, 2003; Prèvot et al., 1990; Selkin & Tauxe, 2000; Tarduno et al., 2001; Tarduno & Cottrell, 2005;
Tauxe, 2006; Tauxe et al., 2013; Tauxe & Yamazaki, 2015; Thomas et al., 1998, 2000) can provide impor- tant constraints on the heat flux across the Earth's core-mantle boundary and the energy states of the ge- odynamo. These in turn have significant implications for the geodynamo and mantle modeling (Biggin et al., 2012). Moreover, understanding the long-term variations of the geomagnetic field strength (Ingham et al., 2014; Juarez et al., 1998; Kulakov et al., 2019; McFadden & McElhinny, 1982; Tauxe et al., 2013; Wang et al., 2015) over thousands to millions of years is not only fundamental for modeling the geodynamo origin and behavior (e.g., Biggin et al., 2012) but also for other applications, such as estimating the solar standoff distance (Tarduno et al., 2014) or geodynamic plate reconstructions (e.g., Olierook et al., 2020). However, there is no consensus yet as to the average strength of the geomagnetic field, with estimates ranging from 80 ± 7 ZAm2 (where ZAm2 = 1021 Am2) for the last 5 Ma (McFadden & McElhinny, 1982), to 42 ± 23 ZAm2 for the last 160 Ma (all intensity values errors are 1σ; Juarez et al., 1998; Tauxe et al., 2013).
Despite the many studies on the strength of the geomagnetic field over time (e.g., Biggin et al., 2010; Perrin
& Schnepp, 2004; Perrin & Shcherbakov, 1997; Tanaka et al., 1995; Tauxe & Yamazaki, 2015, and earthref.
org/MagIC; Tauxe et al., 2016), the data distribution is uneven both geographically and temporally. Overall,
∼95% of the data in the MagIC database (combining both volcanic and archeomagnetic records) come from northern hemisphere locations, whereas only ∼5% come from southern latitudes. Moreover, most of the data are from the last 20,000 years. This significant bias in the geographic and temporal span is due to: (i) the limited availability of suitable materials for paleomagnetic analyses, as older rocks with ideal characteristics are much less common than younger rocks, and (ii) the high-failure rate and time-consuming nature of the paleointensity experiments. The scatter in the database may be also increased by low resolution geochrono- logical dating methods (the 2σ uncertainties can range from hundreds to millions of years).
One way to advance our understating of geomagnetic field activity and mantle dynamics is to investigate the superchrons, intervals of tens of millions of years that lack reversals. Gubbins (1999) proposed that excur- sions and reversals nucleate in the fluid outer core and if the reverse outer core field is maintained for longer than ∼3 ka (the magnetic diffusion time of the inner core) then the field is able to diffuse into the inner core, allowing the dipole field to reverse. This hypothesis may explain the existence and relatively short duration of the magnetic excursions, which are only thousands of years long.
In contrast, superchrons may be related to the relationship between the Earth's dynamo and the lower mantle (Glatzmaier et al., 1999; Larson & Olson, 1991; Olson et al., 2012) or they may be triggered by crustal/upper mantle events, such as the impingement of a subducted slab with the core-mantle boundary (Courtillot et al., 2007; Larson & Olson, 1991). If the long-term thermal effect of mantle convection on the core during the Cretaceous led to a gradual decrease of the reversal rate before the onset of the superchron, then its existence could be predicted (McFadden & McElhinny, 1984; McFadden & Merrill, 2000). Alterna- tively, if the reversal rate was stationary before the superchron (Gallet & Hulot, 1997; Hulot & Gallet, 2003), then this could represent a sudden non-linear transition between a reversing and a non-reversing state of the geodynamo and the Cretaceous Normal Superchron (CNS) could not be predicted (de-coupling be- tween core-mantle processes and long-term geomagnetic field changes, Prèvot et al., 1990). Furthermore, numerical simulations by Olson and Hagay (2015) suggest that superchrons are induced by mantle ”su- perplume” activity. These are manifested by major Large Igneous Provinces (LIPs), the age of which post- date transitions from hyper-reversing (i.e., the Jurassic Hyperactivity Period, JHP; Kulakov et al., 2019) to superchron geodynamo states (i.e., the CNS). Therefore, improving our knowledge of the timing and extent of LIPs could help to constrain the geomagnetic field behavior. Finding a precursor event to a superchron would support one of the competing hypotheses (Gallet & Hulot, 1997; Hulot & Gallet, 2003; Zhu, Hoffman, et al., 2004; Zhu, Lo, et al., 2004). The key to this is to expand the existing sparse database spanning the onset of a superchron (here the CNS). In this study, we focus on obtaining new and robust data from before and after the onset of the CNS, from the study of part of the Caribbean Large Igneous Province (CLIP; e.g., Boshman et al., 2019) in Costa Rica.
2. The Cretaceous Normal Superchron (CNS)
The CNS (C34n; informally called “the Cretaceous quiet zone,” e.g., Gee & Kent, 2007) is a long period of nearly uniform normal polarity, first observed by Helsley and Steiner (1968) in ocean-floor magnetic anomaly profiles. The CNS begins between 123.0 and 121.2 Ma, with a duration of 38.0–40.5 Ma (see re- view by Olierook et al., 2020), and it provides an opportunity to investigate the geomagnetic field behavior before, during, and after a superchron. Indeed, the CNS is preceded by the so-called “Mesozoic dipole low”
(Prèvot et al., 1990) with an average intensity value of ∼32 ZAm2 (e.g., Tauxe et al., 2013), possibly linked to a change of state of the geomagnetic field from a state of relatively rapid reversals, to a period of stability during the CNS. Cox (1968) suggests that when the field is stronger, it is also more stable and therefore the frequency of reversals should be lower. Many subsequent studies support the inverse correlation between field strength and reversal frequency (e.g., Constable et al., 1998; Kulakov et al., 2019; Tauxe, 2006; Tauxe &
Hartl, 1997; Tauxe & Staudigel, 2004; Tauxe & Yamazaki, 2015), whereas others (e.g., Selkin & Tauxe, 2000) suggest that the distribution of paleointensities does not change substantially between a low reversal-rate period (e.g., between 124 and 30 Ma) and a high reversal-rate period (e.g., between 30 and 0.3 Ma).
At present, too few data are available to rule out either of these hypotheses, as suggested by Ingham et al. (2014). The investigation of SBG samples from the Troodos Ophiolite in Cyprus (92 Ma; Tauxe &
Staudigel, 2004) suggest that a strong and stable field was present during the CNS, with a mean dipole moment of 81 ± 43 ZAm2. An even higher dipole moment value of 125 ± 14 ZAm2 is found in single plagioclase crystals extracted from the Rajmahal Traps of India (113–116 Ma; Cottrell & Tarduno, 2000;
Tarduno et al., 2001) and 127 ± 7 ZAm2 from the Canadian Arctic Ellesmere Island lavas (95 Ma; Tarduno et al., 2002). High values are also supported by a review of paleointensity data from all SBG samples from Deep Sea Drilling Project and Ocean Drilling Program (DSDP/ODP) core samples (Tauxe, 2006).
Alternatively, there are many studies that suggest relatively low field values during the whole period of the CNS. Data from the lower crust (gabbros) of the Troodos Ophiolite by Granot et al. (2007) point to intensity fluctuations around a mean of 54 ± 20 ZAm2, which are weaker and more variable than predicted by ge- odynamo simulations. Low intensity values are also observed from the 114-110 Ma Suhongtu lava section (Inner Mongolia) by Zhu et al. (2008) who found a field that fluctuated from 53 ± 20 to 46 ± 27 ZAm2. Sim- ilar low intensity values are observed by Pick and Tauxe (1993a) who analyzed SBG samples from the East Pacific Rise DSDP/ODP sites spanning the onset of the CNS (Holes 417D, 418A, 807C), and near the CNS termination (Hole 543A). A precursor event to the CNS is proposed by Gallet and Hulot (1997) and Hulot and Gallet (2003) and are supported by intensity values of 64 ± 23 ZAm2 at 134 Ma from Uruguay (e.g., Goguitchaichvili et al., 2008). Moreover, data from Zhuanchengzi in Liaoning Province (northeast China), K-Ar dated at 120.93 ± 0.88 Ma (all age uncertainties are 2σ unless otherwise stated) closely following the onset of the CNS, reveal a low average intensity of 39.6 ± 0.8 ZAm2 (Zhu et al., 2001). An even weaker field is reported from the southern hemisphere, with data from 135 Ma old lava flows from the Etendeka-Paranà Province (Namibia; Dodd et al., 2015), with an average of 25 ± 10 ZAm2. Similar low values of 41 ± 16 ZAm2 (and high variability) are found on the southern Brazilian part of the same province, in 130 Ma Ponta Grossa tholeiitic dykes (Cejudo Ruiz et al., 2009), from a sequence of 124–133 Ma lava flows at Si- hetun and 122 Ma andesitic basalt lava flows from Hulahada (northeast China; Zhu, Hoffman, et al., 2004;
Zhu, Lo, et al., 2004). Thus, these data (Cejudo Ruiz et al., 2009; Dodd et al., 2015; Zhu et al., 2001, 2003, Zhu, Hoffman, et al., 2004; Zhu, Lo, et al., 2004) suggest that no precursor to the CNS is recorded and the field was weak both prior to (35.3 ± 0.2 ZAm2) and after (48 ± 0.2 ZAm2) the CNS. These low intensities would support a decoupling of the processes controlling reversal frequency and paleointensity. There is also a discrepancy between magnetic anomalies, volcanic and sedimentary data (Cronin et al., 2001; Granot et al., 2012; Tarduno, 1990) during the CNS. For example, Granot et al. (2012) discovered two magnetic anomalies within the CNS (with higher intensity values at ∼108 Ma, and lower at ∼92 Ma) from deep-tow magnetic profiles in the Central Atlantic Ocean, which are not observed in the volcanic or sedimentary data.
Kulakov et al. (2019) analyzed data from the PINT (Paleo-INTensity) data set (Biggin et al., 2010) to inves- tigate the variability of the geomagnetic field and reversal frequency between the CNS and the JHP, finding a weak inverse correlation using the entire data set, which is in agreement with Channell et al. (1982) and Tarduno and Cottrell (2005). However, when using stricter selection criteria, no correlation was found.
Overall, Kulakov et al. (2019) found an increase of field strength at 133 Ma, before the onset of the CNS,
which lasted up to 15 Ma after the end of the CNS, with two peaks at ∼117 and ∼95 Ma, which is remi- niscent of the findings of Granot et al. (2012). Additionally, Kulakov et al. (2019) points out that different paleointensity sampled material may bias paleointensity results, as data from single zircons yield system- atically higher values with less variability, compared to data from SBG and whole rock samples, with SBGs giving more dispersed results with lower median values. However, we note that there are very few single crystal zircon studies (e.g., Tarduno et al., 2001) and these results have never been verified by measuring crystals that have cooled in known magnetic fields, whereas SBG samples have been verified multiple times (e.g., Bowles et al., 2005; Pick & Tauxe, 1993a, 1993b; Tauxe et al., 2004).
SBG is rapidly cooled (i.e., quenched), is likely to contain single domain magnetic particles (Bowles et al., 2005; Pick & Tauxe, 1993a, 1993b), and can yield results that meet stricter criteria than those from other materials. SBG has been the subject of many paleointensity studies (e.g., Bowles et al., 2005; Juarez et al., 1998; Juarez & Tauxe, 2000; Pick & Tauxe, 1993a; Riisager et al., 2003; Selkin & Tauxe, 2000; Smirnov
& Tarduno, 2003; Tauxe et al., 2013; Tauxe & Staudigel, 2004) and their reliability has been thoroughly test- ed and discussed. For example, Tauxe and Staudigel (2004) show that under certain geological conditions SBGs can yield reliable paleointensity results that meet strict criteria, thus suggesting magnetic stability over millions of years. However, the susceptibility of volcanic glasses to weathering may cause the altera- tion of SBGs into hydrous phases that can yield unreliable paleointensity and geochronological results (e.g., Cogliati et al., 2020; Smirnov & Tarduno, 2003). Nonetheless, fresh-looking SBG samples can be found in outcrops (e.g., Tauxe & Staudigel, 2004) and drill cores (e.g., Selkin & Tauxe, 2000; Tauxe, 2006).
Alternatively, Smirnov and Tarduno (2003) studied the rock magnetic properties and behavior of some Holocene and Cretaceous SBG specimens using Thellier-heating experiments, concluding that the mag- netic behavior of these samples is not comparable to previous studies. They pointed out that partial melt- ing and neo-crystallization of magnetic grains bias the results toward lower paleointensity values. Hel- ler et al. (2002) argue for a low-temperature origin for low-Ti titanomagnetite, because it is not found as an equilibrium phase in mid-ocean ridge basalts. However, three lines of evidence argue against this: (1) Low-Ti titanomagnetite is found in freshly erupted volcanic material, (2) several successful paleointensity studies on historical flows clearly show blocking temperatures of 430–575°C (Bowles et al., 2011; Carlut &
Kent, 2000; Juarez et al., 1998; Kent & Gee, 1996; Pick & Tauxe, 1993a; Tauxe et al., 2013), which yield in- tensity values in good agreement with the known magnetic field associated with the eruptions, and (3) glass is by definition not an equilibrium phase, so the argument of Heller et al. (2002) is not relevant. Finally, as volcanic glasses cool rapidly and are quenched below the Curie temperatures (Bowles et al., 2005), little or no cooling rate correction needs to be applied to the intensity data (as observed in the Scripps Paleomagnetic Laboratory).
In this study, we present new and robust intensity results obtained from SBG samples from Costa Rica (the Nicoya Peninsula and Murcièlago Islands). These new data are combined with new and previous geochro- nology and biostratigraphy studies that yield ages ranging from 141 to 65 Ma, which give us the opportunity to investigate the geomagnetic field strength before and during the CNS.
3. Geological Setting and Sampling
Costa Rica is located near the triple junction of the Cocos, Caribbean and Nazca plates (DeMets, 2001), where the Cocos Plate subducts beneath the Caribbean Plate at a rate of ∼8.5 cm yr−1. For this study, we fo- cus on the Nicoya Peninsula and Murcièlago Islands in the north west (10° N; 85° W, Figure 1), where an im- portant ophiolitic complex exposes upper crust sequences and overlying sediments. The Nicoya Peninsula comprises Cretaceous aphyric pillow lavas and lava flows (dated by the 40Ar/39Ar method), which are asso- ciated with the formation of the Jurassic-Cretaceous CLIP (Hauff et al., 2000; Hoernle et al., 2004; Madrigal et al., 2016; Sinton et al., 1997). The crustal basaltic sequence is locally intruded by late Cretaceous diabases, gabbros and plagiogranites dated by 40Ar/39Ar and U-Pb methods (Hauff et al., 2000; Madrigal et al., 2016;
Sinton et al., 1997; Whattam & Stern, 2016) and by biochronological analyses of dismembered radiolarit- ic chert sequences from the Middle Jurassic to Late Cretaceous (Bandini et al., 2008; Baumgartner, 1984;
Baumgartner et al., 1995; Schmidt-Effing, 1975, 1979). There are also rare occurrences of fossil-bearing intra-pillow sediments indicating an age of ∼94 Ma (Azema et al., 1978; Tournon & Alvarado, 1997).
Three extrusive lava sequences are recognized, which are chronologically divided into three main events:
Nicoya I (∼140 Ma), Nicoya II (∼120 Ma), and Nicoya III (∼90 Ma; Hoernle et al., 2004; Madrigal et al., 2016).
These are considered to be part of the CLIP and a remnant of the Panthalassa Ocean. The lava sequences preserve fresh pillow-rim glasses (Figures 1 and 2). The lack of vesicularity in the lava flows and the high sulfur concentrations (1,000–2,000 ppm S; Hauff et al., 1997) in these fresh pillow rim glasses indicate low degrees of degassing, therefore, they likely erupted in moderate to deep water depths (Moore & Schil- Figure 1. Geological map of the Nicoya Peninsula and the surrounding area (modified from Hauff et al., 2000), highlighting the upper and lower crust terrains of the Nicoya Ophiolite, the sampling sites and ages from our study and previous literature (black squares). The sources for the recalculated 40Ar/39Ar and biostratigraphical ages are Hauff et al. (2000), Hoernle et al. (2004), Madrigal et al. (2016) and Sinton et al. (1997). The CR-labeled paleointensity sites are from SBG samples provided by K. Hoernle, while the NC- sites are from SBG samples collected in 2017 for this study. SBG, submarine basaltic glass.
ling, 1973). In most of the sites, the thickness of the cooling units (up to 50 m) and the paucity or lack of primary sediment intercalations suggests high eruption rates over relatively short time intervals, thus ensuring good preservation and little to no post-eruptive alteration of the volcanic deposits. The ophiolitic complex is overlain in the north by Middle Campanian-Maastrichtian shallow-water carbonate deposits (e.g., Baumgartner & Denyer, 2002), and in the center by Albian black shales and Coniacian-Campanian pelagic to turbiditic sequences. The Murcièlago Islands, north of the Nicoya Peninsula, are not considered part of the Santa Helena ophiolite located in the east, because the basalts are almost geochemically identi- cal to the CLIP and older basaltic suites from the Nicoya Peninsula (Escuder-Viruete et al., 2015; Madrigal et al., 2015).
Two sample collections were available for this study: the CR and NC collections (Table 1 and Figure 1). The CR collection consists of 10 sites of pillow lava rinds and hyaloclastites. Four sites, CR01 to CR04, were col- lected from the same tectonic block and outcrops along the beach east of Playa del Coco. In this study, we present new 40Ar/39Ar dates from sites CR01 (131.0 ± 3.2 Ma) and CR03 (130.0 ± 4.5 Ma). Previous 40Ar/39Ar ages are also available from this area, and we have recalculated them using consistent standard ages and K decay constants (Fleck et al., 2019). These recalculated published ages include 141.4 ± 1.1 Ma (originally 139.1 ± 1.1 Ma; sample AN8 from Hoernle et al., 2004), 139.9 ± 1.8 Ma (originally 137.6 ± 1.8 Ma; sample AN10 from Hoernle et al., 2004) and 136.5 ± 2.5 Ma (originally 137.1 ± 2.5 Ma; sample NI7 from Madrigal et al., 2016). We calculated a weighted mean age of 140.99 ± 0.94 Ma (Mean Squares Weighted Deviation (MSWD) = 2.0, Probability (P) = 15%, from close-proximity samples AN8 and AN10; Hoernle et al., 2004) for the CR02 and CR04 sites. Sites CR05 and CR06 are from northeast of Playa Hermosa, in the same loca- tion as the BN22 site dated at 112.4 ± 0.9 Ma (originally 110.6 ± 0.9 Ma; Hoernle et al., 2004). Sites CR13 and CR14 are from western Playa del Coco, both from the same pillow lava sequence dated at 135.1 ± 1.5 Ma (originally 132.9 ± 1.5 Ma; sample AN3 from Hoernle et al., 2004). In the central-western coast, site CR18 is dated at 121.4 ± 1.1 Ma (originally 119.4 ± 1.1 Ma; sample AN34 from Hoernle et al., 2004). Further south, site CR20 has a slightly younger age of 120.2 ± 1.8 Ma (originally 118.2 ± 1.8 Ma; sample AN40 from Ho- ernle et al., 2004). Samples from sites NC17, NC18, and NC19 to NC28 from this study were collected at the same locations as CR18, and CR19 and CR20, respectively. The NC sample set (Figures 1 and 2) consists of 38 single pillow basalts, where each pillow represents a sampling site. Fragments of fresh basaltic glasses Figure 2. Field photographs showing the sampling of the SBGs in pillow lava margins from the Nicoya Peninsula and Murcièlago Islands (Costa Rica). SBG, submarine basaltic glass.
Site Location Type Lat (°N) Long (°W) Age (Ma) ±2σ (Ma) Ref.
NC01 N of Isla San Pedrito glassy pm 10.856 85.952 113.0 3.5 3
NC02 Golondrina Island pm 10.856 85.944 113.0 3.5 3
NC03 San Jose Island pm 10.854 85.926 113.0 3.5 3
NC04 Cocinera Island SBG 10.857 85.907 110.6 2.0 2
NC05 San Jose Island SBG 10.851 85.912 113.0 3.5 3
NC06 N of P. Guacamaya SBG 10.533 85.781 [-] [-] [-]
NC08 P. Blanca SBG 10.181 85.821 [-] [-] [-]
NC10 A La Joya del Lagarto SBG 10.112 85.794 [-] [-] [-]
NC11 Near NC10 SBG 10.108 85.794 [-] [-] [-]
NC13 N of P. Pitahaya SBG 10.067 85.77 [-] [-] [-]
NC17 San Juanillo SBG 10.034 85.739 121.4 1.1 1
NC18 Punta Islita SBG 9.85 85.404 121.4 1.1 1
NC19 Punta Islita SBG 9.848 85.402 120.2 1.8 1
NC20 Punta Islita SBG 9.848 85.403 [-] [-] [-]
NC21 Punta Islita SBG 9.848 85.403 [-] [-] [-]
NC23 P. Corozalito glassy pm 9.848 85.383 120.2 1.8 1
NC24 P. Corozalito glassy pm 9.849 85.382 120.2 1.8 1
NC25 P. Corozalito glassy pm 9.844 85.374 120.2 1.8 1
NC26 camping Corozalito glassy pm 9.845 85.374 120.2 1.8 1
NC27 camping Corozalito glassy pm 9.845 85.373 120.2 1.8 1
NC28 camping Corozalito glassy pm 9.845 85.374 120.2 1.8 1
NC29 P. Bejuco SGB 9.823 85.331 120.2 1.8 1
NC30 Punta coyote SBG 9.76 85.275 [-] [-] [-]
NC31 P. Las Manchas pm 9.644 85.073 94 [-] 5
NC32 P. Las Manchas SBG 9.646 85.072 94 [-] 5
NC33 Ballena Bay SBG 9.737 84.977 96.1 0.9 2
NC34 P. Posa Colorada glassy pm 9.788 84.922 [-] [-] [-]
NC35 P. Los Muertos glassy pm 9.76 84.893 [-] [-] [-]
NC36 P. Espadilla weathered p. 9.389 84.148 64.7 0.5 4
NC37 P. Espadilla p. breccia 9.388 84.147 64.7 0.5 4
NC38 P. Las Gemelas fine grained 9.38 84.14 64.7 0.5 4
CR01 Punta Cacique hyalo. 10.566 85.693 131.0 1.6 TS
CR02 Punta Cacique glassy pm 10.569 85.7 141.0 0.9 1/TS
CR03 Punta Cacique hyalo. 10.571 85.687 130.0 4.5 TS
CR04 Punta Cacique hyalo. 10.569 85.685 141.0 0.9 1/TS
CR05 NE of P. Hermosa glassy pm 10.589 85.68 112.4 0.9 1
CR06 near CR5 glass pm 10.588 85.679 112.4 0.9 1
CR13 Punta Miga hyalo. 10.555 85.709 135.1 1.5 1
CR14 Punta Miga glassy pm 10.55 85.707 135.1 1.5 1
CR18 B P. San Juanillo glassy pm 10.029 85.739 121.4 1.1 1
CR20 B P. Corozalito hyalo. 9.848 85.383 120.2 1.8 1
Abbreviations: pm = pillow margin; SBG = sub-marine basaltic glass; hyalo. = hyaloclastite; P = playa; Lat = Latitude; Long = Longitude; Ref. = Reference.
The literature 40Ar/39Ar ages were recalculated using the standard ages and K decay of Fleck et al. (2019). Reference 1 = Hoernle et al. (2004); 2 = Hauff et al. (2000); 3 = Madrigal et al. (2016); 4 = Sinton et al. (1997); 5 = Tournon and Alvarado (1997) (radiolaria biostratigraphic age); and TS = this study.
Table 1
Site, Location Name and Coordinates
were collected from pillow lava rinds (Table 1, Figures 1 and 2). The ages of the NC collection were assigned based on their close-proximity to dated sites from previous studies (Table 1, Figure 1). From the north of the Nicoya Peninsula, in the Murcièlago Islands, we collected samples from five sites, NC01 to NC05; sites NC01 and NC03 to NC05 with a close-proximity 40Ar/39Ar age of 110.6 ± 2.0 Ma (originally 109.0 ± 2.0 Ma; sample SE6 from Hauff et al., 2000) and site NC02 with an age of 113.0 ± 3.5 Ma (originally 113.4 ± 3.5 Ma; sample SE-050611-11 from Madrigal et al., 2016). From north to south on the Nicoya Peninsula, 29 sites (NC06 to NC34) were collected. Sites NC31 and NC32 were dated at 94 Ma (based on close-proximity to a radiolaria biostratigraphic age from site NB03; Tournon & Alvarado, 1997). Site NC33 was dated at 96.1 ± 0.9 Ma (originally 94.7 ± 0.9 Ma, based on nearby site AN86 from Hauff et al., 2000) and finally from the south, at Quepos, sites NC36 to NC38 were dated at 64.7 ± 0.5 Ma (originally 63.9 ± 0.5 Ma, based on the close-prox- imity to sample S-QP93-1; Sinton et al., 1997).
4. Methods and Results
In this study, we analyzed a total of 231 specimens from 41 sites for paleointensity using the IZZI method of Yu et al. (2004). Tauxe and Staudigel (2004) successfully used this method to study SBG samples from the Troodos Ophiolite in Cyprus. The IZZI protocol embeds two variations of the Thellier-Thellier meth- od: the in-field, zero-field (IZ) method of Aitken et al. (1988) and the zero-field, in-field (ZI) method of Coe (1967) with the addition of the so-called partial Thermal Remanent Magnetization (pTRM) checks of Coe et al. (1978). This approach ensures a built-in check for alteration during the experiments and a test of the so-called “Reciprocity Law” of Thellier and Thellier (1959).
Between 8 to 20 SBG specimens were analyzed per site, following the suggestion of Santos and Tauxe (2019) that if an experiment contains an insufficient number of specimens, the field estimate may be affected by a large bias. In this study, we performed 20 to 48 heating steps per experiment in four experiments using three different laboratory fields (15, 25, and 45 µT).
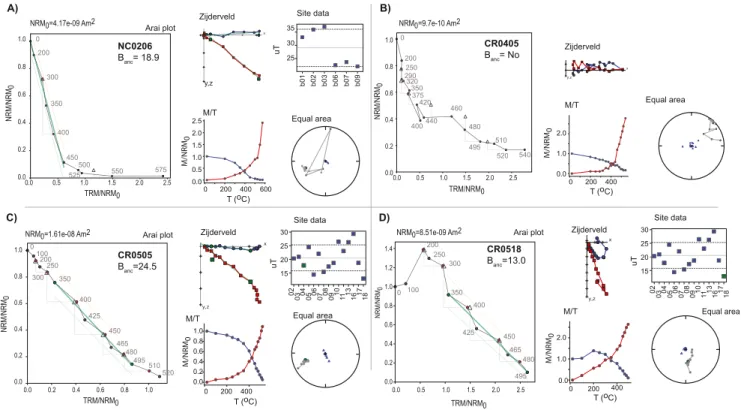
Data were analyzed using the PmagPy software package (Tauxe et al., 2016). The Natural Remanent Mag- netization (NRM) values remaining after each heating step were plotted against the pTRM-gained Arai plots (Nagata et al., 1963) along with corresponding Zijderveld (1967), equal area, magnetization versus temperature (M/T) and site level plots (Figure 3). The criteria employed in this study were used as threshold values to select the most reliable and straight Arai plots and were similar to the strict CCRIT set of Crom- well et al. (2015) and Tauxe et al. (2016). Acceptable (successful) specimens were characterized by three or more pTRM checks (NpTRM), a Fraction of Remanence (FRAC) value used in the slope calculation (defined by Paterson et al., 2014) greater than or equal to 0.78, SCAT (test for the scatter of the points on the Arai plot) = True, a bβ value (ratio of the standard error of the slope to the absolute value of the slope on the Arai plot) smaller than 0.1, MAD (Maximum Angular Deviation of the free-floating directional Principal Component Analyses (PCA) fits to the paleomagnetic direction), a DANG
(Deviation ANGle; the angle between the best-fit direction and the direction between the data center of mass and the origin of the vector component) values of lower than or equal to 10°, and a |k'| value (the curvature value of Paterson, 2011 evaluated over the selected interval) of less than or equal to 0.164. For a few specimens that showed clear evidence of two-component behavior in the directions (as deduced from the Zijderveld diagrams), we allowed the FRAC value to be as low as 0.3 (CCRIT-relaxed) and used the slope of the line associated with the characteristic component of the remanent magnetization (ChRM). For a complete definition of the selection criteria, we refer to the study of Paterson et al. (2014). The selection criteria at site level required that the number of successful specimens per site (Nspec.) was greater than 3 and the standard deviation was lower than 10 µT.
4.1. 40Ar/39Ar Methods and Results
40Ar/39Ar dating was undertaken on two basaltic glass samples (CR01 and CR03) at the Argon Geochro- nology in Oceanography (ArGO) Laboratory at GEOMAR Helmholtz Center of Ocean Research Kiel. A detailed description of the methods and equipment used can be found in Homrighausen et al. (2019) and the full data set is presented in Tables S1 and S2. The samples were irradiated for 168 h at 5 MW, in the C6 position of the GKSS nuclear reactor, Germany. Aliquots of the Taylor Creek sanidine age standard (TCs;
28.344 ± 0.011 Ma (1σ; Fleck et al., 2019) were co-irradiated with the samples, and the K(total) decay con- stant of Steiger and Jäger (1977) was used. In order to directly compare our new data with the literature
40Ar/39Ar ages, the ages of Hauff et al. (2000), Hoernle et al. (2004), Madrigal et al. (2016), and Sinton et al. (1997) were recalculated utilizing the ArAR calculator of Mercer and Hodges (2016), using the total
40K(total) decay constant of Steiger and Jäger (1977), as per the recommendations of Fleck et al. (2019).
The following standard ages were also applied to the previously published 40Ar/39Ar data: a TCs age of 28.344 ± 0.011 Ma (1σ; Fleck et al., 2019) to the Hauff et al. (2000) and Hoernle et al. (2004) data, a Fish Canyon sanidine age of 28.099 ± 0.013 Ma (FCs); (1σ; Fleck et al., 2019) to the Madrigal et al. (2015) data, and a Fish Canyon Tuff biotite age of 28.06 Ma (FCT-3; Kuiper et al., 2008) was applied to the Sinton et al. (1997) data. The recalculated 40Ar/39Ar ages are quoted in Figure 1 and Tables 1 and 2. 40Ar/39Ar dat- ing of samples CR01 and CR03 yielded plateau ages of 131.0 ± 3.2 Ma (61.0% 39Ar; MSWD = 0.41, P = 93%) and 130.0 ± 4.5 Ma (67.8% 39Ar; MSWD = 0.41, P = 96%), respectively. Both age spectra are disturbed, and high Cl concentrations (monitored by the analysis of the mass 35.5 baseline value) were observed in many steps. Initial step-heating analyses yielded very high quantities of atmospheric 40Ar, and overall both sam- ples show quite high atmospheric 40Ar concentrations of 26%–99% (CR01) and 35%–99% (CR03), which suggests that the basaltic glass samples may have been affected by alteration. These factors may explain the large age uncertainties observed in some steps of both samples (Table S2). Inverse isochron plots from the plateau steps of each sample yielded inverse isochron ages within 2σ uncertainties of the plateau ages:
130 ± 11 Ma (CR01%; 95% confidence (95% conf.); MSWD = 0.48, P = 87, with an unacceptable Spreading Factor (SF) value of 25.1%), and 136 ± 11 Ma (CR03%; 95% conf.; MSWD = 0.33; P = 98%, with an accept- able SF value of 41.0%). Both samples yielded initial 40Ar/36Ar ratios of 297 ± 12 (CR01) and 288 ± 13 (CR03), within 95% conf. uncertainties of the atmospheric 40Ar/36Ar ratio of 295.5 (Steiger & Jäger, 1977;
Tables S1 and S2).
Figure 3. Examples of Arai plots (left hand plots in A–D) from four representative specimens, with relative Zijderveld (upper middle plots in A–D), magnetization versus temperature (M/T; lower middle plots in A–D), equal area (lower right hand plots in A–D) and site-level plots (upper right hand plots in A–D). Numbers on the Arai plots are the temperature steps (in °C), the triangles show the directions of the pTRMs acquired in the laboratory field (along the z-axis of the specimens, i.e., the center of the diagram) and each blue and red circle shows a pair of ZI and IZ steps. The Zijderveld diagrams are from unoriented specimens and are plotted on the x-axis as the NRM direction with blue circles on the x,y plane and red squares in the x, z plane. The y-axis is with y, z as positive down. In the equal area plots, closed and open circles represent the NRM directions in the specimen, from the lower and upper hemispheres, respectively. NRM, Natural Remanent Magnetization; pTRM, partial Thermal Remanent Magnetization.
4.2. Paleointensity Results
Overall, 36 of the 231 specimens analyzed passed the CCRIT-strict selection criteria (Table 2), while 85 of 231 specimens passed the CCRIT-relaxed selection criteria (Table 2), with an overall 16% and 37% success rate at the specimen level, respectively. The main reason for failure (77% of the specimens) was a combi- nation of criteria that indicated alteration of the samples, as shown by failed pTRM checks, segmented or curved Arai plots (e.g., Figure 3b) suggesting the presence of multidomain-like grains and random and chaotic behavior (30.5% of the specimens). 12% of the specimens failed the FRAC criterion because of the presence of multi-components of remanent magnetization (e.g., Figure 3d). A further 11% of the specimens failed because of high k' values, thought to reflect a threshold separating single-domain-like from multid- omain-like remanences. Evidence of multiple components of remanent magnetization were observed on some of the Zijderveld diagrams (e.g., Figure 3c), therefore we selected only the temperature steps that corresponded to the ChRM component. For these specimens, we relaxed the FRAC criterion to 0.3. For instance, Figure 3d shows a Zijderveld diagram that clearly indicates two components, a low temperature component (NRM to 300°C) and the ChRM component (from 350 to 495°C) than can be extrapolated to the origin of the plot. Overall, the NRM values vary significantly from ∼5.3 µAm2 to 30 µAm2 and the intensities vary from 21 to 47 µT (Table 2).
A swarm-violin plot shows the distribution of all the 85 specimens that passed the CCRIT-relaxed selection criteria at the specimen level (Figure 4a; Table 2), plotted by site. From these 14 CCRIT-relaxed sites, one site (NC05) contains only two specimens (Table 2). Specimens from four sites (CR01, CR03, CR13, and CR20) showed a highly dispersed distribution with B % 1σ error higher than 30%. The remaining nine sites (CR02, CR03, CR05, CR06, CR14, CR18, NC01, NC03, and NC17) showed a low dispersion of the density distribu- tion, symmetrical around their mean values (Figure 4a) and are the only specimens passing the CCRIT-re- laxed site level selection criteria. For the 36 CCRIT-strict specimens (Figure 4b; Table 2), four sites were characterized by only two specimens (CR02, CR03, NC03, and NC05), while sites CR13 and CR20 showed a highly dispersed distribution with a B % 1σ error of greater than 25%, thus they do not pass the strict se- lection criteria. Finally, sites CR05, CR06, CR14, and NC17 were characterized by a symmetric distribution around their mean values and B % 1σ value of less than 23%, thus they can be considered reliable (Table 2).
Site Age (Ma) n/N B (µT) σ (%) Lat (◦N) VADM VADM1
Strict
CR06 112.4 ± 0.9 7/24 33.7 ± 3.9 11.6 3.6 86.6 ± 10.0 83.0 ± 9.6
CR05 112.4 ± 0.9 6/18 20.7 ± 3.2 15.6 3.6 53.2 ± 8.2 51.0 ± 7.8
NC17 121.4 ± 1.1 3/8 21.4 ± 1.2 5.6 9.5 53.0 ± 3.0 52.8 ± 3.0
CR14 135.1 ± 1.5 5/24 34.4 ± 8.1 23.5 3.6 88.4 ± 20.0 84.8 ± 19.9
Relaxed
CR06 112.4 ± 0.9 13/24 32.9 ± 3.8 11.6 3.6 84.6 ± 9.8 81.1 ± 9.4
CR05 112.4 ± 0.9 14/18 20.9 ± 4.7 22.5 3.6 53.7 ± 12.1 51.5 ± 12.3
NC02 113.0 ± 3.5 5/17 30.3 ± 7.0 23.1 1.5 78.3 ± 18.1 74.5 ± 17.2
NC03 113.0 ± 3.5 5/18 47.4 ± 7.2 17.3 1.5 122.4 ± 18.6 116.5 ± 18.2
NC17 121.4 ± 1.1 6/8 21.8 ± 5.9 26.9 9.5 54.2 ± 14.6 54.0 ± 14.6
CR18 121.4 ± 1.1 3/10 32.3 ± 3.2 9.8 9.5 80.4 ± 8.0 80.0 ± 7.9
CR03 130.0 ± 4.5 3/12 32.3 ± 0.6 1.9 3.6 83.0 ± 1.5 79.6 ± 1.5
CR14 135.1 ± 1.5 11/24 33.1 ± 7.7 23.2 3.6 85.1 ± 19.8 81.6 ± 18.0
CR02 141.0 ± 0.9 3/6 21.1 ± 2.0 10.6 3.6 54.2 ± 5.4 52.0 ± 4.9
Notes. The40Ar/39Ar ages are shown with 2σ uncertainties. Abbreviations: n/N = number (n) of specimens yielding a reliable paleointensity signal and total number of specimens analyzed (N), B = paleointensity values. Lat (◦N) = paleolatitude reported by Boshman et al. (2019), VADM and VADM1 = Virtual Axial Dipole Moment values (ZAm2 = 1021 Am2) calculated using the Boshman et al. (2019) paleolatitudes and present-day latitudes, respectively.
Table 2
Paleointensity Results From Costa Rica Obtained Using the CCRIT-Strict and -Relaxed Selection Criteria
5. Discussion
In total, reliable paleointensity estimates have been obtained for four sites from Costa Rica, with ages span- ning a 23 Ma interval between 135 and 112 Ma, using the CCRIT-strict selection criteria and nine sites spanning 141–112 Ma using the CCRIT-relaxed criteria (Table 2; Figure 5). For the CCRIT-strict sites, two are from the early CNS (113-112 Ma), one is close to the CNS onset (121 Ma) and one is from the pre-CNS (141–130 Ma). For the nine CCRIT-relaxed sites (Table 2), three are from the pre-CNS (141–130 Ma), two are close to the CNS onset (121 Ma) and four are from the early CNS (113–112 Ma).
In order to compare our results from Costa Rica to all the worldwide data with similar ages, we calculated virtual axial dipole moments (VADMs), using paleolatitudes from both the study of Boshman et al. (2019) (VADM; Table 2 and Figure 5) and the present-day latitudes (VADM1; Table 2 and Figure 5), between 9 and 10° N (Table 1). The paleolatitudes reported by Boshman et al. (2019) range from 1° to 9° N (Table 2). The VADM values are systematically slightly higher than the VADM1 values but statistically indistinguishable (overlapping within the quoted 1σ errors).
When we consider our four CCRIT-strict site results, one site (CR14) with an age of 135.1 ± 1.5 Ma gives a reliable intensity result of 34 ± 8 µT (equivalent to a virtual axial dipole moment, of 88 ± 20 ZAm2), while one site (NC17) with an age of 121.4 ± 1.1 Ma gives a value of 21 ± 1 µT (or 53 ± 3 ZAm2) during the onset of the CNS, and two sites (CR05 and CR06) with an age of 112.4 ± 0.9 Ma give variable intensity values ranging from 21 ± 3 to 34 ± 4 µT (or 53 ± 8 to 87 ± 10 ZAm2).
Among our nine CCRIT-relaxed site results, two sites (CR14 and CR02) with an age of 141.0 ± 0.9 and 135.1 ± 1.5 Ma gives an intensity value of 21 ± 2 and 33 ± 8 µT (or 54 ± 5 and 85 ± 20 ZAm2), one site Figure 4. Swarm-violin plots showing the paleointensity values for specimens (black dots) that passed the CCRIT selection criteria, with kernel densities of their statistical distribution (colored areas), by using the (a) CCRIT-relaxed selection criteria with a FRAC value of greater than 0.3, and (b) CCRIT-strict criteria with a FRAC value of greater than 0.78. FRAC, Fraction of Remanence.
(CR03) with an age of 130.0 ± 4.5 Ma gives a value of 32 ± 1 µT (or 83 ± 2 ZAm2), two sites of 121 ± 1.1 Ma (NC 17 and CR18) give values of 21 ± 1 µT (or 53 ± 3 ZAm2) and 32.3 ± 3.2 µT (or 80 ± 3 ZAm2) spanning the onset of the CNS, and two sites (CR05 and CR06) with an age of 112.4 ± 0.9 Ma give variable intensity values ranging from 21 ± 3 to 34 ± 4 µT (or 53 ± 8 to 87 ± 10 ZAm2).
Considering our CCRIT-strict results, the average paleointensity value from Costa Rica during the CNS is
∼25 µT (64 ZAm2; from three sites), whereas the pre-CNS sites record an intensity value of 34 ± 8 µT (or VADM of 88 ± 21 ZAm2). Considering the CCRIT-relaxed results, the average paleointensity value pre-CNS is ∼29 µT (∼74 ZAm2; from three sites), and during the CNS is ∼30 µT (∼79 ZAm2; from six sites). While the relaxed criteria result in very compatible results compared to the strict criteria, we consider only our CCRIT- strict results for a conservative discussion. Unfortunately, the recognition of any trend is limited by the lack of data between 135–130, 130–121, and 120–112 Ma, around the onset of the CNS.
In order to verify the polarity and the reliability of the close-proximity geochronological ages assigned to our sites (CNS sites are expected to have normal polarities), we would like to have compared the directional data of Boshman et al. (2019), which were also obtained from the same locations as this study. Unfortunately, our sampling method did not include the drilling oriented core samples, therefore this direct comparison is not possible. In addition, all of Boshman et al. (2019) sites (except for a few that failed a fold test) are interpreted as having normal polarity, including their sampling site that is near our CR14 site, which was
40Ar/39Ar dated at 135.1 ± 1.5 Ma (Hoernle et al., 2004). Therefore, the directional information of Boshman et al. (2019) cannot provide a test of the 40Ar/39Ar ages, although their results do not negate the assumption that many of our sites came from the CNS. Data from this study (shown as red and black stars, for results ob- tained using the CCRIT-strict and CCRIT-relaxed, respectively, in Figure 6) display similar or lower values than the present-day field (∼80 ZAm2, red dashed line in Figure 6, calculated using the International Ge- omagnetic Reference Field (IGRF) model), and are equal to or slightly higher than the average value of 50 ZAm2 previously obtained for the CNS (blue solid line in Figure 6, Bol'shakov & Solodonikov, 1983; Pick &
Tauxe, 1993a; Zhu et al., 2001; Zhu, Hoffman, et al., 2004).
In order to directly compare the new paleointensity data from Costa Rica with the existing database, we re-analyzed the available data using the same set of CCRIT-relaxed criteria employed in this study. Only five studies published the original measurement data, following the or Findability, Accessibility, Interoperabil- ity, and Reusability (FAIR) principles (Wilkinson et al., 2016). After our re-analysis of the literature data, fewer sites were found to pass the CCRIT-relaxed selection criteria compared to the original studies. From Figure 5. Paleointensity data (in µT) with 1σ error bars from Costa Rica sites versus 40Ar/39Ar ages (in Ma) with 2σ error bars. Red stars are the sites for which the paleointensity values were obtained using the CCRIT-strict selection criteria. The CNS onset interval is marked with a vertical black line. CNS, Cretaceous Normal Superchron.
the reanalysis of the Zhu et al. (2008) data (Sohongtu lavas, Inner Mongolia; pink symbols in Figure 6), 73%
(25 of 34) of the original sites passed the CCRIT-relaxed criteria, and our reanalysis of the Tauxe and Staudi- gel (2004) data (Troodos Ophiolite, Cyprus; orange symbols in Figure 6), only 23% (9 of 39) of the sites pass the CCRIT-relaxed criteria. Our Costa Rica paleointensity values (red and black stars in Figure 6) are similar to the 114-110 Ma Sohongtu lavas values obtained by Zhu et al. (2008) and to the reanalyzed late-CNS mean values from Troodos Ophiolite SBGs (92 Ma; Tauxe & Staudigel, 2004; Granot et al., 2007; orange and green symbols in Figure 6, respectively). We obtained average re-calculated paleointensity values of 65.4 ZAm2 (Tauxe & Staudigel, 2004) and 55.9 ZAm2 (Granot et al., 2007). The latter values were adjusted for cooling rate (reducing the reported value) but the actual original cooling rate is poorly constrained and may have been faster than assumed.
The average Costa Rica paleointensity value (∼64 ZAm2; considering the CCRIT-strict sites) from the CNS is ∼22 ZAm2 higher than the long-term average value of 42 ZAm2 suggested by Juarez et al. (1998 calculated from the last 160 Ma but is similar to the mean value of ∼50 ZAm2 calculated using the entire MagIC da- tabase from the last 200 Ma. These results appear to agree with the suggestion of Selkin and Tauxe (2000) that the distribution of paleointensities does not change substantially between 124 and 30 Ma (low reversal rate) and 30–0.3 Ma (high reversal rate). At the same time, our data do not seem to support the hypothesis that long periods of low reversal frequency are characterized by a stronger field compared to periods of high reversal rates (Constable et al., 1998; Tauxe & Hartl, 1997). It is worth noting that our re-analysis of SBG samples from DSDP and ODP drill cores compiled by Tauxe (2006) from 0 to 122 Ma suggests a consistently weaker field than previously reported and provide low values for both the onset and toward the end of the CNS. Together, the Costa Rica and the Troodos Ophiolite data show a relatively strong field during the CNS.
However, the paucity of data between 110 and 95 Ma hampers the interpretation of any paleointensity field trend during the middle part of the CNS.
Monte Carlo simulations, using the TK03 paleosecular variation model of Tauxe and Kent (2004), show that at least 25 intensity estimates for a given age are required to robustly estimate a paleofield strength value (Tauxe & Staudigel, 2004). Unfortunately, none of the individual studies available so far have sufficient tem- poral sampling to provide a robust estimate of the paleofield strength during the CNS. This robust record of reversals and excursions is needed, along with a reliable and temporally and spatially well distributed paleo- Figure 6. VADM (in ZAm2) versus age (Ma). The black and red stars are the results of this Costa Rica study obtained using the CCRIT-relaxed and -strict selection criteria, respectively, with 1σ error bars and 40Ar-39Ar ages with 2σ error bars. Gray dots represent the virtual (axial) dipole moments (V[A]DM) available from the MagIC database spanning the last 200 Ma. The bounds of the Cretaceous Normal Superchron (CNS) are indicated with vertical black lines.
The strength of the present dipole field is shown as a dashed red line, the solid blue line represents the average of all the MagIC data, and the long-term average from Juarez and Tauxe (2000), and Tauxe et al. (2013) is shown as a solid aquamarine line. Circles represent the data from SBGs that we re-analyzed using the same CCRIT criteria as employed in our study, while the original literature data as presented by the authors are marked as crosses. SBG, submarine basaltic glass; VADM, Virtual Axial Dipole Moment.
intensity data set in order to verify a possible correlation between dipole strength and reversal frequency.
This in turn, would provide important constraints on the heat flux across the Earth's core-mantle boundary, the energy states of the geodynamo and their modeling (Biggin et al., 2012). Our new paleointensity data from Costa Rica contribute significantly to the overall CNS data set and can be used in future numerical simulations in order to understand long-term variations, the geomagnetic field features and whether these are a result of external forcing mechanisms and/or reflect the hydrodynamic processes occurring in the Earth's mantle, and inner and outer cores.
6. Conclusions
This study provides high-quality paleointensity data from four sites from Costa Rica, spanning 23 Ma of volcanic activity, between 135 and 112 Ma, from before the onset of the CNS and the beginning of the CNS.
- We investigated 41 submarine basaltic glass (SBG) sites from pillow lava margins, sampled along the coast from the upper crust sequences of the Murcièlago Islands and the Nicoya ophiolite, and from the north, north-west, and the south of the Nicoya Peninsula.
- New 40Ar/39Ar ages are presented along with recalculated 40Ar/39Ar ages and biostratigraphic ages from previous studies, indicate ages ranging from 141 to 65 Ma.
- We present new high-quality paleointensity results from four sites, with ages from ranging from 135 to 112 Ma, obtained using the IZZI protocol and applying a CCRIT-strict selection criteria.
- Allowing interpretation of two-component magnetization in some of our samples, by relaxing the FRAC criterion (CCRIT-relaxed) resulted in the inclusion of an additional five sites for a total of 14 sites with ages ranging from 141 Ma to 112 Ma.
- The new Costa Rica paleointensity data from before the onset of the CNS (135 Ma) yield a value of 34 ± 8 µT (or a PDM value of 88 ± 20 ZAm2), one paleointensity value for the onset of the CNS at 121 Ma (21 ± 1 µT or 53 ± 3 10 ZAm2), and two paleointensity values from the first part of the CNS vary from 21 ± 3 to 34 ± 4 µT (or 53 ± 8 to 87 ± 10 ZAm2).
- These new CNS paleointensity results from Costa Rica are similar to our reanalyzed value of 50 ZAm2 from the 114–110 Ma Suhongtu lavas (Inner Mongolia; Zhu et al., 2008) and the ∼92 Ma Troodos Ophi- olite value of ∼55 ZAm2 (Granot et al., 2007). However, these values are lower than the reanalyzed Troo- dos Ophiolite paleointensity value of 65 ZAm2 (Tauxe & Staudigel, 2004). Our reanalyzed literature values were obtained using the same CCRIT criteria as employed in our study.
- Despite the still insufficient number of paleointensity estimates for the period spanning the onset of the CNS, our data do not seem to support a correlation between the strength and stability of the geomagnetic field.
- These new paleointensity results contribute to understanding the long-term variation and features of the Earth's magnetic field.
Data Availability Statement
Data will be made available on the MagIC database at https://earthref.org/MagIC/16869 upon publication.
(For purposes of review, see https://earthref.org/MagIC/16870/d197f16c-70ef-459a-98c1-f8f67f757731).
References
Aitken, M. J., Allsop, A. L., Bussell, G. D., & Winter, M. B. (1988). Determination of the intensity of the Earth's magnetic field during arche- ological times: Reliability of the Thellier technique. Reviews of Geophysics, 26, 3–12. https://doi.org/10.1029/rg026i001p00003 Azema, J., Tournon, J., & Sornay, J. (1978). Presencia de amonites del Albiano Superior en las formaciones del Complejo de Nicoya. El yaci-
miento de Loma Chumico, provincia de Guanacaste, Costa Rica, 2 (pp. 71–76). Inf. Sem. IGN.
Bandini, A. N., Flores, K., Baumgartner, P., Jackett, S. J., & Denyer, P. (2008). Late Cretaceous and Paleogene radiolaria from the Nicoya Peninsula, Costa Rica: A tectonostratigraphic application. Stratigraphy, 5, 3–21.
Baumgartner-Mora, C., & Denyer, P. (2002). Campanian-Maastrichtian limestone with larger foraminifera from Pen˜ruja Rock (Santa Elena Peninsula). Revista Geol´o´erica Central, 26, 85–89.
Baumgartner, P. (1984). El complejo ofiolitico de Nicoya (Costa Rica): Modelos estructurales analizados en func´ı´on de las edades de los Radiolarios (Calloviense a Santoniense). In P. Spechmann (Ed.), Manual de Geolog´ıa de Costa Rica, Universidad de Costa Rica (pp.
115–123).
Acknowledgments
This work was supported in part by NSF Grant EAR1547263 and EAR1827263 to LT, and NEXT Data grant to FF and ADC. KH received funds from the GE- OMAR Research Center. We thank Jan Sticklus for his help with the 40Ar/39Ar dating of samples at GEOMAR Helmholtz Center for Ocean Research Kiel. The Editor Josh Feinberg and two anonymous reviewers are thanked for providing constructive reviews that improved this manuscript.
Baumgartner, P., O'Dogherty, L., Gorican, S., Urquhart, E., Pillevuit, A., & De Wever, P. (1995). Middle Jurassic to Lower Cretaceous radio- laria of Tethys: Occurrences, systematics, biochronology. In International Association of Radiolarian Paleontologists. (Ed.), INTERRAD Jurassic-Cretaceous Working Group (pp. 37–685).
Biggin, A. J., Steinberger, B., Aubert, J., Suttie, N., Holme, R., Torsvik, T. H., et al. (2012). Possible links between long-term geomagnetic variations and whole-mantle convection processes. Nature Geoscience, 5, 526–533. https://doi.org/10.1038/ngeo1521
Biggin, A. J., & Thomas, D. N. (2003). Analysis of long-term variations in the geomagnetic poloidal field intensity and evaluation of their rela- tionship with global geodynamics. Geophysical Journal International, 152(2), 392–415. https://doi.org/10.1046/j.1365-246x.2003.01849.x Biggin, A., McCormack, A., & Roberts, A. (2010). Paleointensity database updated and upgraded. Eos, Transactions American Geophysical
Union, 91(2). https://doi.org/10.1029/2010eo020003
Bol'shakov, A., & Solodonikov, G. M. (1983). Geomagnetic field intensity in Armenia in the Late Jurassic and Early Cretaceous. Izvestiya, Physics of the Solid Earth, 19, 976–982.
Boshman, L., van der Wiel, E., Flores, K., Langereis, C., & van Hinsbergen, D. (2019). The Caribbean and Farallon plates connected: Con- straints from stratigraphy and paleomagnetism of the Nicoya Peninsula, Costa Rica. Journal of Geophysical Research: Solid Earth, 123, 6243–6266. https://doi.org/10.1029/2018JB016369
Bowles, J., Gee, J. S., Burgess, K., & Cooper, R. F. (2011). Timing of magnetite formation in basaltic glass: Insights from synthetic analogs and relevance for geomagnetic paleointensity analyses. Geochemistry, Geophysics, Geosystems, 12(2). https://doi.org/10.1029/2010gc003404 Bowles, J., Gee, J. S., Kent, D. V., Bergmanis, E., & Sinton, J. (2005). Cooling rate effects on paleointensity estimates in submarine basaltic
glass and implications for dating young flows. Geochemistry, Geophysics, Geosystems, 6. https://doi.org/10.1029/2004gc000900 Brown, M., Korte, M., Holme, R., Wardinski, I., & Gunnarson, S. (2018). Earth's magnetic field is probably not reversing. Proceedings of the
National Academy of Sciences of the United States of America, 115, 5111–5116. https://doi.org/10.1073/pnas.1722110115
Carlut, J., & Kent, D. V. (2000). Paleointensity record in zero-age submarine basalt glasses: testing a new dating technique for recent MORBs. Earth and Planetary Science Letters, 183, 389–401. https://doi.org/10.1016/s0012-821x(00)00291-0
Cejudo Ruiz, R., Goguitchaichvili, A., Morales, J., Trindade, R., Alva Valdivia, L., & Urrutia-Fucugauchi, J. (2009). Absolute Thellier paleo- intensities from Ponta Grossa dikes (southern Brazil) and the early Cretaceous geomagnetic field strength. Geofísica Internacional, 48, 243–252.
Channell, J. E. T., Ogg, J. G., & Lowrie, W. (1982). Geomagnetic polarity in the early Cretaceous and Jurassic. Philosophical Transactions of the Royal Society of London - Series A: Mathematical and Physical Sciences, 306(1492), 137–146. https://doi.org/10.1098/rsta.1982.0074 Channell, J., Singer, B., & Jicha, B. (2020). Timing of Quaternary geomagnetic reversals and excursions in volcanic and sedimentary ar-
chives. Quaternary Science Reviews, 228. https://doi.org/10.1016/j.quascirev.2019.106114
Coe, R. S. (1967). The determination of paleo-intensities of the Earth's magnetic field with emphasis on mechanisms which could cause non-ideal behavior in Thellier's method. Journal of Geomagnetism and Geoelectricity, 19, 157–179. https://doi.org/10.5636/jgg.19.157 Coe, R. S., Grommé, S., & Mankinen, E. A. (1978). Geomagnetic paleointensities from radiocarbon-dated lava flows on Hawaii and the
question of the Pacific nondipole low. Journal of Geophysical Research, 83, 1740–1756. https://doi.org/10.1029/jb083ib04p01740 Cogliati, S., Sherlock, S. C., Halton, A. M., Ebinghaus, A., Kelley, S. P., Jolley, D. W., & Barry, T. L. (2020). Expanding the toolbox for dat-
ing basaltic lava sequences: 40Ar-39Ar dating of silicic volcanic glass from interbeds. Journal of the Geological Society, 178. https://doi.
org/10.1144/jgs2019-207
Constable, C. G., Tauxe, L., & Parker, R. L. (1998). Analysis of 11 Myr of geomagnetic intensity variation. Journal of Geophysical Research, 103(B8), 17735–17748. https://doi.org/10.1029/98jb01519
Cottrell, R. D., & Tarduno, J. A. (2000). In search of high-fidelity geomagnetic paleointensities: A comparison of single plagioclase crystal and whole rock Thellier-Thellier analyses. Journal of Geophysical Research, 105, 23579–23594. https://doi.org/10.1029/2000jb900219 Courtillot, V., Gallet, Y., Le Mouël, J.-L., Fluteau, F., & Genevey, A. (2007). Are there connections between the Earth's magnetic field and
climate? Earth and Planetary Science Letters, 253, 328–339. https://doi.org/10.1016/j.epsl.2006.10.032
Cox, A. (1968). Lengths of geomagnetic polarity intervals. Journal of Geophysical Research, 73, 3247–3260. https://doi.org/10.1029/
jb073i010p03247
Cromwell, G., Tauxe, L., & Halldórsson, S. A. (2015). New paleointensity results from rapidly cooled Icelandic lavas: Implications for Arc- tic geomagnetic field strength. Journal of Geophysical Research: Solid Earth, 120(5), 2913–2934. https://doi.org/10.1002/2014jb011828 Cronin, M., Tauxe, L., Constable, C., Selkin, P., & Pick, T. (2001). Noise in the quiet zone. Earth and Planetary Science Letters, 190, 13–30.
https://doi.org/10.1016/s0012-821x(01)00354-5
DeMets, C. (2001). A new estimate for present-day Cocos-Caribbean plate motion: Implications for slip along the Central American vol- canic arc. Geophysical Research Letters, 28, 4043–4046. https://doi.org/10.1029/2001gl013518
Dodd, S. C., Mac Niocaill, C., & Muxworthy, A. R. (2015). Long duration (>4 Ma) and steady-state volcanic activity in the early Cretaceous Paraná-Etendeka Large Igneous Province: New paleomagnetic data from Namibia. Earth and Planetary Science Letters, 414, 16–29.
https://doi.org/10.1016/j.epsl.2015.01.009
Escuder-Viruete, J., Baumgartner, P. O., & Castillo-Carrión, M. (2015). Compositional diversity in peridotites as result of a multi-process history: The Pacific-derived Santa Elena ophiolite, northwest Costa Rica. Lithos, 231, 16–34. https://doi.org/10.1016/j.lithos.2015.05.019 Fleck, R. J., Calvert, A. T., Coble, M. A., Wooden, J. L., Hodges, K., Hayden, L. A., et al. (2019). Characterization of the rhyolite of Bodie Hills and 40Ar/39Ar intercalibration with Ar mineral standards. Chemical Geology, 525, 282–302. https://doi.org/10.1016/j.chemgeo.2019.07.022 Gallet, Y., & Hulot, G. (1997). Stationary and nonstationary behavior within the geomagnetic polarity time scale. Geophysical Research
Letters, 24, 1875–1878. https://doi.org/10.1029/97gl01819
Gee, J. S., & Kent, D. V. (2007). Source of oceanic magnetic anomalies and the geomagnetic polarity timescale. In M. Kono (Ed.), Geomag- netism (5, pp. 455–507). Elsevier. https://doi.org/10.7916/D8DV1V8P
Glatzmaier, G. A., Coe, R. S., Hongre, L., & Roberts, P. H. (1999). The role of the Earth's mantle in controlling the frequency of geomagnetic reversals. Nature, 401(6756), 885–890. https://doi.org/10.1038/44776
Goguitchaichvili, A., Cejudo Ruiz, R., Sanchez-Bettucci, L., Reyes, B., Valdivia, L. M. A., Urrutia-Fucugauchi, J., et al. (2008). New absolute paleointensity results from the Parana Magmatic Province (Uruguay) and the Early Cretaceous geomagnetic paleofield. Geochimica et Cosmochimica Acta, 9. https://doi.org/10.1029/2008gc002102
Granot, R., Dyment, J., & Gallet, Y. (2012). Geomagnetic field variability during the Cretaceous Normal Superchron. Nature Geoscience, 5, 220–223. https://doi.org/10.1038/ngeo1404
Granot, R., Tauxe, L., Gee, J., & Ron, H. (2007). A view into the Cretaceous geomagnetic field from analysis of gabbros and submarine glasses. Earth and Planetary Science Letters, 256, 1–11. https://doi.org/10.1016/j.epsl.2006.12.028
Gubbins, D. (1999). The distinction between geomagnetic excursions and reversals. Geophysical Journal International, 137, F1–F4. https://
doi.org/10.1046/j.1365-246x.1999.00810.x