Research Collection
Working Paper
The effect of information on market activity; evidence from vehicle recalls
Author(s):
van den Bijgaart, Inge; Cerruti, Davide Publication Date:
2020-10
Permanent Link:
https://doi.org/10.3929/ethz-b-000444959
Rights / License:
In Copyright - Non-Commercial Use Permitted
This page was generated automatically upon download from the ETH Zurich Research Collection. For more information please consult the Terms of use.
CER-ETH – Center of Economic Research at ETH Zurich
The effect of information on market activity; evidence from vehicle recalls
I. van den Bijgaart, D. Cerruti
Working Paper 20/343 October 2020
Economics Working Paper Series
The effect of information on market activity; evidence from vehicle recalls ∗
Inge van den Bijgaart
†and Davide Cerruti
‡September 29, 2020
Abstract
We evaluate the effect of vehicle recalls on vehicle transactions in the second-hand market.
Using a rich dataset of Dutch vehicle registrations, we exploit the quasi-experimental variation in recalls across nearly-identical cars. We find strong heterogeneities across market segment:
vehicles with a lower (higher) list price or some (zero) defects experience an increase (de- crease) in transactions after a recall. Based on our theoretical model, this suggests that recalls increase sorting in low-end markets, yet exacerbate adverse selection in high-end markets.
Our results shed light on the effect of information arrival in markets subject to uncertainty and information asymmetries.
JEL Classification: D12, D83, L15, L62
Keywords: Vehicles, recalls, adverse selection, sorting, information
∗We thank Anna Bindler, Claudio Daminato, Massimo Filippini, Reyer Gerlagh, Carsten Helm, Cristian Huse, Jonathan Peterson, Henry Schneider and numerous conference and seminar participants for helpful comments and suggestions. All the errors are our own.
†Department of Economics, University of Gothenburg.
‡Centre for Energy Policy and Economics, ETH Zürich.
1 Introduction
Information availability about product characteristics plays a fundamental role in the correct func- tioning of markets. In particular, purchasing decisions about expensive durable goods, such as vehicles or household appliances, involve complex considerations about product quality, which is information not always known in advance, or easily observed, by consumers.
Uncertainty about product quality can be mitigated by measures such as quality certifications and mandatory disclosures. A particular type of information disclosure are product recalls due to safety reasons. Recall procedures are in place for a wide range of products, including food, chemical products, textiles, electronics, machinery, furniture, cosmetics, toys, and motor vehicles.
For durable goods such as cars, where the defect typically involves one specific component, the product is usually not replaced or reimbursed, but instead repaired for free.
In the automotive market, vehicle recalls are often considered an adverse signal of vehicle quality. Recalls of passenger car vehicles are also extremely common. In 2019 alone, the US National Highway Traffic Association registered 743 recall episodes due to vehicle defects, which affected over 34 million vehicles (NHTSA, 2019), while the European Commission recorded 510 vehicle recall occurrences in the EU, each of which often involved multiple models (European Commission, 2020). Though most recall episodes are not widely reported upon, the largest ones generate substantial media attention. Prominent examples are the Volkswagen emission and Takata airbag scandals, which jointly led to the recall of over 50 million vehicles worldwide.
These recalls create concerns with owners of the affected vehicles, regarding the reliability of their vehicle, as well as its potential resale value.1 Yet, despite their widespread occurrence, the effect of recalls on the recalled vehicle and the used-vehicle markets has been strikingly understud- ied. Analyzing the effect of recalls on the used-vehicle market is particularly relevant as for many households a car is the second most expensive durable owned. These cars are actively traded, with the used-vehicle market substantially exceeding the primary market in volume.2
1For instance, both Takata and Volkswagen faced class action lawsuits in several countries. For the Volkswagen class action, claimants were seeking compensation for being misinformed about vehicle specifications and approval.
2In the US, the volume of trade in the used vehicle market exceeds the new vehicle market by a factor of 2.5 (Cox
In this paper we use a difference in differences methodology to assess the effect of recalls on the used car market, focusing primarily on resale rates. We additionally consider the effect of recalls on the depreciation factor (defined as the ratio of used vehicle asking price to new vehicle list price) of vehicles offered in the used car market. Due to its unexpected nature, a recall constitutes an information shock to both sides of the market. As such, the effect of the recall on the used car market offers an insight into the effect of information arrival in markets subject to substantial uncertainty and information asymmetries.
For this empirical assessment we consider vehicle recalls in the context of the Dutch used car market. In the Netherlands, detailed vehicle-level information on recalls is readily available to, and commonly accessed by, both buyers and sellers. Owners of a recalled vehicle are informed of the recall by letter, while several government and commercial search engines offer information about current and/or past recalls of specific vehicles to prospective buyers. The vast majority of recalls are due to mechanical problems that impose serious security risks for the driver or passengers.
Still, while in the Netherlands a recalled vehicle can be repaired free of charge, owners have no obligation to do so, and may continue to use or sell their vehicle without taking any action.
As we show using a stylized model of the used car market, the effect of an adverse signal about vehicle quality on resale rates is not immediate. The model captures two primary motivations for trade in the used car market. The first is sorting, which is driven by differences in the willingness to pay for quality across consumers. Consumers who put a high value on quality will tend to buy new vehicles, and act as sellers on the market for used vehicles. They sell to consumers with a low valuation for quality, who prefer the cheaper, lower-quality, used vehicles over the more expensive new cars. The second motivation for trade is adverse selection: used vehicle sellers have private information about quality, which makes them more inclined to sell especially if this private information indicates that the vehicle quality is low.
The arrival of negative information about vehicle quality affects vehicle transactions through the same two channels. First, the information shock can lead to increased sorting; vehicle sellers
Automotive, 2018). In the Netherlands, this is approximately a factor of 4 (CBS, 2019).
value quality more than buyers, and will thus be more inclined to sell. As such, the arrival of information allows for an improved match of the vehicle to a specific user. Second, the novel information may affect the information asymmetry between buyer and seller. Insofar a recall leads the buyer to downward-adjust its expectation of the privately-observed quality, it will reduce the likelihood of a transaction taking place. Taken together, our theoretical framework points out that the effect of an information shock on trade is ex ante ambiguous; our empirical analysis will provide insight in to which mechanism dominates.
Our analysis uses the Dutch vehicle registration database, which includes detailed vehicle-level information on vehicle characteristics, registration changes and recalls for the entire Dutch vehicle fleet of about 9 million vehicles. The precise classification of the vehicles in our database allows us to adopt an identification strategy that relies on a difference-in-differences strategy exploiting the quasi-experimental variation in the occurrence of recallswithingroups of almost identical cars.
We group vehicles by version, following official EU regulation for vehicle classification. By this regulation, all cars belonging to the same version must be identical in terms of manufactures, chas- sis, engine, body style and other fundamental characteristics; only differences in minor features such as color or options are allowed. Yet, while vehicles within a version are virtually identical in terms of observable characteristics, they might still exhibit unobservable differences in the as- sembly process, such as a different production cycle, plant location, or supplier of the vehicle’s components. For this reason, recalls are issued at the vehicle level, and for a specific version, only a subset of vehicles may be recalled. This feature, in combination with a large sample of vehicles, allow us to control for unobserved vehicle characteristics at the version level. Additionally, we are also able to control for unobserved characteristics of recalled cars of a specific version, and for unobserved version-specific time trends.
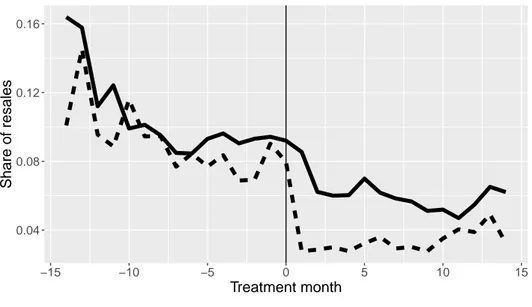
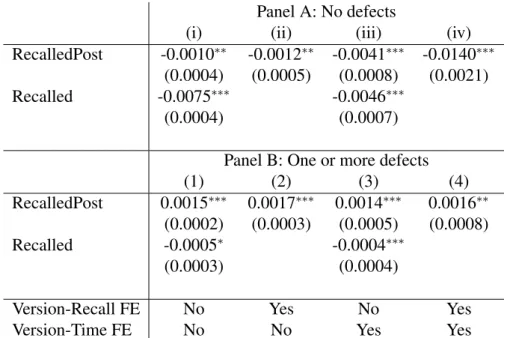
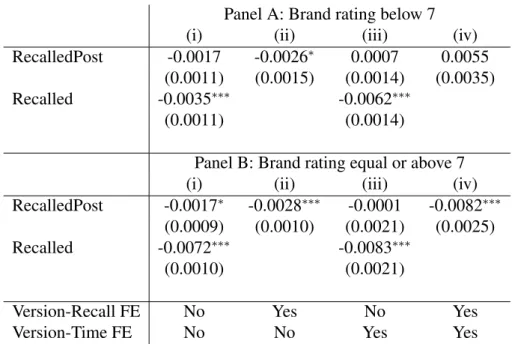
We find that during the first 6 months from the announcement of a recall, the vehicle resale probability decreases, while, depending on the specification, it increases or remains stable after- wards. The effect over the entire sample period is negative, but not statistically significant across all specifications. When considering different market segments, we identify substantial hetero-
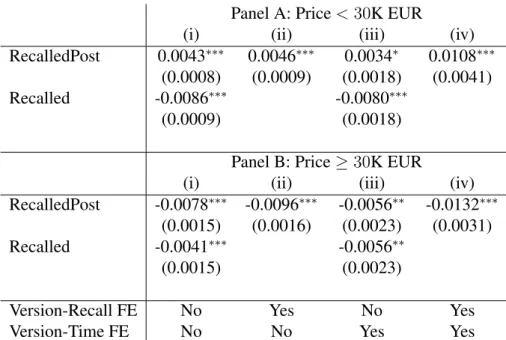
geneity in the response to vehicle recalls. Vehicles in the high-end used-vehicle market, as proxied by high list price, no past defects, and high vehicle brand reliability, tend to experience a decrease in resales following a recall. This is contrary to the effect for inexpensive and low-reliability vehi- cles, where we identify an increase in resales due to the recall. Using an ancillary dataset of a large Dutch vehicle marketplace, we do not find an effect of recalls on the depreciation rate of vehicles offered for sale.
Our results are suggestive of recalls affecting the used car market both through increased sort- ing and a reinforcement of adverse selection. The heterogeneity in our results indicate that for cheap, unreliable vehicles, the sorting effect is dominant. The reduction in transactions of high- quality used vehicles however suggests that for those vehicles, the arrival of recall information primarily reinforces adverse selection and thereby need not improve market efficiency.
Our paper is most closely related to Tadelis and Zettelmeyer (2015), who show that in car auctions, the disclosure of information to prospective buyers increases the number of transactions when the information disclosed is new. Contrary to our analysis, Tadelis and Zettelmeyer (2015) only capture the effect of increased information on the demand-side of the market; their experi- mental design forestalls any supply-side response to the mitigation of the information asymmetry.
We instead analyse a situation where the arrival of information is new to both sides of the market, and both parties respond to this new information. In this setting, our analysis highlights that subtle differences in the institutional setting, the market segment, and the type of information revealed can matter greatly for the effect of information on markets.
As highlighted above, despite the common occurrence of vehicle recalls, their effects on the secondary vehicle market remains understudied; we were able to identify only a limited number of contributions, each focusing on the effects of a large, high-profile recall episode. Hartman (1987) find that the 1981-1985 GM safety recalls negatively affected used car prices. Hammond (2013) estimate a negative, albeit small and temporary, effect of the 2009-2010 Toyota safety recall on used-vehicle prices. The more recent work by Strittmatter and Lechner (2020) and Ater and Yosef (2018) explores the effects of the Volkswagen ’dieselgate’ scandal on used car markets in Germany
and Israel, respectively. Strittmatter and Lechner (2020) establish an increase in the supply of Volkswagen diesel vehicles following the scandal, as well as a reduction in the asking price of those vehicles. Ater and Yosef (2018) similarly establish a reduction in resale prices of used Volkswagen vehicles following the scandal, yet identify a reduction in the number of transactions.
Our contribution to this literature is twofold. First, we consider the effect of recalls generally, rather than the effect of a single highly-publicized episode. Second, our empirical approach relies on the quasi-experimental variation in recalls within the same vehicle versions. As such we capture the effect of the recall on the recalled vehicle itself, filtering out any possible spillover effects to other brands or models or to non-recalled cars of the same model, as well as any version-specific trends in resales that might be correlated with the occurrence of a recall. This contrasts past literature which collectively assesses the effect of recalls by adopting a more aggregated approach, comparing across broader vehicle categories such as brands, fuel type, or year of manufacture.
More generally, by shedding light on how consumers may translate information about product safety into market decisions, our paper contributes to a broader literature that evaluates consumer responses to product recalls. Recent contributions to this literature are Freedman, Kearney, and Lederman (2012), who analyze the spillover effect of a series of toy recalls on new toy sales, and Ferrer and Perrone (2017), who perform a detailed assessment of consumer demand responses following a major food safety crisis. Related contributions that consider the effects of recalls on the primaryvehicle market are Rhee and Haunschild (2006), Liu and Shankar (2015) and Bachmann, Ehrlich, Fan, and Ruzic (2019). Rhee and Haunschild (2006) and Liu and Shankar (2015) establish that consumers respond more negatively to recalls for brands with a strong quality reputation.
Bachmann et al. (2019) consider the Volkswagen scandal. They identify an adverse reputation spillover in response to the scandal, as well as a substitution of new vehicle demand away from diesel and Volkswagen vehicles.
Finally, this paper contributes to the broader literature on the impact of quality certification and information disclosure on consumer choice. Past research in this area considers a variety of sectors, including vehicles (Lewis, 2011), buildings (Eichholtz, Kok, & Quigley, 2013), appliances (Houde,
2018), restaurants (Jin & Leslie, 2003), online marketplaces (Elfenbein, Fisman, & McManus, 2015), and financial markets (Seira, Elizondo, & Laguna-Müggenburg, 2017). Our work provides further insight on how information about quality affects market activity.
The remainder of the paper is structured as follows. Section 2 provides the institutional back- ground of the Dutch used vehicle market and recalls. Section 3 puts forward a stylized theoretical framework of information arrival and resale decisions. The data and empirical approach are dis- cussed in Sections 4 and 5, respectively. Results are presented in Section 6. Section 7 concludes.
2 Institutional background
This section will briefly set out the institutional context of the Dutch used passenger car market and vehicle recalls.
The used car market in the Netherlands The used car market in the Netherlands is very active:
in 2017, out of the 8.2 million cars in the Netherlands, about 2 million changed owner during that year (CBS, 2019). Compared to many other countries, the market is also strikingly transparent.
Vehicles are typically advertised in dedicated online marketplaces, where detailed information regarding the main vehicle characteristics is reported. Prospective buyers can also use the vehicle license plate number to obtain detailed information on car characteristics, past inspection results, as well as any recalls. This information is available for free either directly through the search engine of the Netherlands vehicle registration authorities (RDW), or through one of several websites who offer a ’license plate check’. It is common practice to access these resources prior to purchasing a vehicle; the RDW reports that every month, its vehicle registration database is accessed 12-30 million times (RDW, 2018). Following a vehicle transaction, the new vehicle owner is required to register the vehicle in his or her name. A change in ownership can be registered online, or at one of nearly 2000 post offices and car dealerships across the country, and is effective immediately.
Vehicle recalls As stipulated by EU law, when a common defect which involves the risk of physical injury has been identified, vehicle producers and distributors (henceforth, distributors) have the obligation to notify authorities, inform consumers, recall the product and offer a free repair (European Parliament, 2001; RDW, 2020).
Vehicle recalls are issued at the EU level, but always originate in a single country, typically the one where the vehicles are manufactured. Distributors inform national transport authorities of the recall, who then pass the information on to other EU institutions through the so-called Rapid Alert System. Each national authority then verifies whether any vehicles with the relevant defect are present in their vehicle registry, and if so, initiate the recall procedure. As the Netherlands does not have any major vehicle manufacturers, only very few recalls originate from the Netherlands.3 Instead, nearly all recalls observed in our data are initiated in other EU countries.
The national vehicle authorities initiate local procedures for handling recalls. In the Nether- lands, the relevant authority is the RDW. The RDW supports distributors in contacting and inform- ing the owners of the recalled vehicles about the recall. Due to the active used vehicle market, distributors typically lack accurate data on who owns their vehicles, while the RDW does maintain a detailed registry.
Vehicle owners are informed about a recall by letter.4 This letter typically specifies the type of the defect, associated risk, and instructions to arrange an appointment to repair the defective part. The repair is free of charge, yet, there is no requirement for the vehicle to be repaired to remain in circulation or be traded on the used car market.5 Since 2012, in an effort to increase transparency about vehicle recalls, the RDW publishes online (i) a recall registry searchable by vehicle brand and model, (ii) information on open (non-fixed) recalls searchable by license plate, and (iii) a database of vehicle characteristics and current status (open or closed) of each recall by
3According to the EU Rapid Alert System data (European Commission, 2020), only 11 of the 2694 recall alerts concerning motor vehicles between 2011 and 2019 originated in the Netherlands.
4In a small number of recalls, owners are additionally contacted by phone. Newspaper advertisements, as common for e.g., toy recalls, have not occurred in our sample period.
5As a consequence, many cars are never repaired. In the Netherlands, this rate is between 10 and 20 percent.
Similar, and higher, rates can be found internationally: In the US, for instance, about a third of recalled vehicles remain unrepaired (NHTSA, 2017), while in the UK shares of 47 percent have been reported (Daily Mail, 2017).
license plate. The recall information provided typically includes a short description of the defect, the part involved, the potential risk, and the procedures towards receiving the free repair. Using RDW data, several commercial ‘license plate check’ websites offer vehicle-level information on open recalls free of charge, and in certain cases also closed recalls, either for free or for a small fee. As such, both buyers and sellers have ready access to information about vehicle recalls, and a newly-issued recall can be considered an information shock for all market parties.
3 Theoretical framework
To formalize and assess the potential effects of the recall information shock on the secondary ve- hicle market, this section puts forward a stylized framework of a market for durable goods. The framework builds on the models presented in Hendel and Lizzeri (1999) and Peterson and Schnei- der (2017). In Hendel and Lizzeri (1999), heterogeneous preferences for quality induces trade in consumer durables, such as cars. Asymmetric information about vehicle quality however creates adverse selection, which reduces, but never eliminates, trade in this market. Peterson and Schnei- der (2017) build on this approach by considering two dimensions of quality; one symmetrically observed, and one observed only by the seller. They establish a positive relationship between observable quality and the degree of adverse selection, and provide empirical evidence for this result.6
We take a similar approach by assuming that part of the vehicle quality is ex ante unobserved.
We consider two types of unobserved quality. First, information about vehicle quality may be asymmetric; it is fully observable to the current vehicle owner, but not to the prospective buyer.
Akin to Hendel and Lizzeri (1999) and Peterson and Schneider (2017), this implies that vehicle market features adverse selection. The second type of unobserved quality is symmetric: at the time of trade, neither the current owner nor the vehicle seller can observe its realisation.
This setup allows us to distinguish two potential channels through which information arrival
6See also Peterson and Schneider (2014) for empirical evidence for the simultaneous presence of sorting and adverse selection in the used car market.
might affect the used car market. For the current vehicle owner, the information shock is ’news’
only if it is a credible signal about the symmetrically unobserved part of vehicle quality. The prospective buyer however, might additionally respond to the information shock by updating her expectation of the asymmetrically observed part of vehicle quality.
The specific information shock we consider are vehicle recalls. Vehicle recalls tend to be associated with lower overall vehicle quality.7 We then establish that the effect of a recall on resales depends on which of the channels described above is most important. Specifically, we show that if the recall information shock is primarily a negative signal about fully unobserved quality, it increases the likelihood of a transaction taking place. If instead it is a negative signal about asymmetrically observed quality, this likelihood is weakly reduced.
The model is as follows. We consider a discrete-time economy with infinitely-lived households.
Households can choose to consume a durable good, henceforth referred to as a ’car’ or ’vehicle’.
Per-period utility of a household reads u = θq+z, where θ is a preference parameter, q is the quality of the car the households owns, and z is consumption of a numeraire good. Households can consume at most one vehicle each period, and discount the future by a factor β ∈ (0,1).
We assume households have heterogeneous preferences for vehicle quality. More specifically, we assume there exists a unit mass of households with a high valuation for quality θH, and a larger than unit mass of households with low valuation for qualityθL, with0< θL < θH.
Vehicles last for two periods. If a household decides to buy a new vehicle, it uses it for the first period. At the end of the first period, the household must decide to either use the vehicle for one more period, or sell it on the used car market. We assume new cars have homogeneous qualityqn and are sold at a constant pricepn. The quality of a used car is
qu =b+c+d, (1)
where b, c and d are random variables distributed according to distributions fB(b), fC(c), and
7For instance, using US data, automotive research firm iSeeCars established a negative correlation between recall rates and vehicle reliability ratings (iSeeCars, 2018).
fD(d), with support b,¯b
,[c,c]¯ and d,d¯
, respectively. We assume that used cars are of positive, albeit lower, quality than old cars: qn> qu >0.8
From (1), used vehicle quality can be separated into three components,b,c andd. Each com- ponent differs in observability. The first component, b, is fully observable to both the buyer and the seller. It, for instance, captures verifiable vehicle characteristics, such as model and make, but also mileage and any visible wear and tear. The second component,c, is fully observable to the current owner, but not to the buyer. As such, it captures characteristics that can be observed only after a (short) period of use. This includes early prevalence of defects, and also the quality of the engine. The third component,d, is realised only at the start of the second period; at the time of vehicle sale, neither the buyer nor the seller observes the value ofd. We interpretdas capturing any defects or parts of the vehicle quality that are hard to anticipate and will be revealed only after long periods of use, such as a poor gearbox.9
A vehicle recall may reveal information aboutcandd. We assume that the recall, if anything, is considered an adverse signal about vehicle quality; the conditional expectation ofcanddis weakly lower in the presence than in the absence of a recall. This is formally expressed byE[c|I= 1]≤ E[c|I= 0] and E[d|I= 1] ≤ E[d|I= 0], where E[·] is the expectations operator and I is an indicator equal to1if the vehicle has been subject to a recall, and zero otherwise.10 We assume that both buyers and sellers observe this information signal.
Before we proceed to determine the equilibrium in the used car market, we make two ad- ditional assumptions regarding the new vehicle price. First, we assume the price is sufficiently low such that high-valuation households derive strictly positive expected benefits from new ve- hicle ownership. Unless this assumption is satisfied, no households will be willing to purchase new vehicles, and no cars will be used. Second, we assume the price is sufficiently high such that low-valuation households never purchase new vehicles. Jointly this implies we require pn ∈(θLqn+βθHE[qu], θHqn+βθHE[qu]).
8A sufficient assumption for this is¯b+ ¯c+ ¯d < qnandb+c+d >0
9The gearbox is one of the most expensive vehicle parts to replace. It has a typical lifetime of about 300,000 km, which implies that for many cars, it is never replaced.
10The recall might also be correlated withb, yet, asbis fully observed, it will not affectE[b].
For expositional purposes, the remainder of the analysis will assume that the distributionsfC(c) andfD(d)are independent ofb, and that, conditional on I,canddare independently distributed.
Equilibrium In equilibrium, high-valuation households will purchase new vehicles, while low- valuation households demand used vehicles. After the first period of use, a high-valuation vehicle owner is willing to sell the vehicle whenever the expected value of continued use is equal to or below the expected value of selling the vehicle and purchasing a new vehicle instead. This is the case if
θH(b+c+D(I)) ≤pu+ [V −pn], (2) where D(I) ≡ E[d|I] is the expectation of d conditional on I, pu is the used vehicle price, and V is the expected welfare derived from purchasing a new vehicle: V = θHqn + βE[max{θHqu, pu+ [V −pn]}]. From (2) one directly observes that for a given pu, the vehicle owner is more likely willing to sell the lower is the realisation ofc, and the lower is the expectation ofd. In equilibrium, the pu is equal to the willingness to pay by the low-valuation households, which is in turn equal toθL times expected vehicle quality:
pu=θL[b+C(b,I) +D(I)], (3) whereC(b,I)≡E[c|b,I]is the expectation ofcconditional on the realisation of I, and the obser- vation that the seller is willing to offer a car with observable qualitybon the market. We can then use (3) to rewrite (2) as
b+c+D(I)≤ V −pn
θH −θL + θL
θH −θL (C(b,I)−c). (4) A vehicle will be sold on the used car market whenever (4) is satisfied.11Equation (4) highlights two motives for trade in the used car market. The first motive is sorting. Used vehicle sellers have a higher marginal willingness to pay for quality than buyers. A low expected quality realization
11Determining the equilibrium on the vehicle market additionally requires solving forC(b,I). In Appendix B we do so for a specific distributionfC(c).
b+c+D(I), then implies that sellers are more likely willing to sell the vehicle, as this allows them to upgrade to a new vehicle with higher expected quality. The second motive is adverse selection.
The buyer’s expectation ofc,C(b,I),might deviate from its actual value. Whenever the realisation ofcis low relative toC(b,I), the actual quality of the vehicle is lower than the buyer’s expectation.
In this situation the seller will be particularly inclined to sell the vehicle. Of course the converse is also true. Ifcis high relative toC(b,I),buyers are willing to pay less than the ’true’ value of the vehicle, and consequently vehicle owners are less inclined to sell.
A recall will then affect the market through those same two channels. First, a recall may lead both buyers and sellers to downward adjust their expectation of d. This is the case whenever D(1) < D(0). Then, the recall information shock will induce increased sorting on the used car market, and correspondingly increase the likelihood that a transaction will take place. The reduc- tion inDfollowing a recall may have an additional, indirect, effect throughC(b,I), as the drop in D(I)implies that for givenb, sellers will be willing to sell vehicles with a higher asymmetrically observed quality c. Knowing that higher-level c vehicles are offered on the market for recalled cars, buyers assign a higher expectation of c to such a car: C(b,0) < C(b,1). While the drop inD reduces the used-vehicle price (see (3)), this indirect effect onC(b,I)increases the buyer’s willingness to pay for the vehicle and thus the vehicle price, thereby reinforcing the positive effect of the recall information on vehicle transactions. All in all, the sorting channel predicts an increase in vehicle transactions following a recall, with an ambiguous net effect on the vehicle price.12
Second, the recall may directly affect the buyer’s expectation ofc,C(b,I). More specifically, vehicles with low asymmetrically observed quality may more likely be subject to a recall. In this case C(b,0) > C(b,1), and buyers will expect a car with observable quality b to have a lower asymmetrically observed quality c if the car has been subject to a recall. Such a change in expectations following the recall will reduce the buyer’s willingness to pay, reduce the vehicle price, and in turn reduce the likelihood that the vehicle is traded on the used car market.
This second channel highlights that in the presence of information asymmetries, the recall may
12The example in Appendix B shows that the effect of the recall on the used vehicle price can indeed go both ways.
lead toreducedtrade in the recalled vehicle. It is relevant to note that those vehicles that are most likely pulled out of the market following a recall are those for which the recall leads to anincrease in information asymmetries. This can observed as follows. Consider (4), and suppose that the buyer cannot accurately infer quality c; for a given b and I, sellers with differentc are active on the market. Suppose also that the average qualityc is lower on the market for recalled than non- recalled vehicles: C(b,0) > C(b,1). Then from (4), the sellers closest to the threshold and thus most likely to pull the vehicle off the market are those with the highest level ofc, i.e., those with c > C(b,0). Then asC(b,0) > C(b,1), the recall increases the information asymmetry between the buyer and ’marginal’ seller.13
The remainder of the paper focuses on estimating the effect of a recall on the resale likelihood, as well as prices. Equations (3), (4) and subsequent discussion will aid us in interpreting our empirical results. More specifically, it allows us to assess whether the arrival of information in the form of recalls, primarily affects the market by allowing for increased sorting, or that it causes more owners to refrain from selling their vehicles, by affecting underlying information asymmetries.
In our empirical analysis we estimate the effect of recalls both for the market as a whole, as well as different segments of the market. Across segments, the distributions ofcanddlikely differ, and also the preferences of the market participants, θH and θL may vary. Equation (4), for instance, suggests that, for a given gap in quality preferences of sellers and buyers θH −θL, the adverse selection channel which operates throughC(b,I)and reduces resales is less influential on a market where buyers have a low quality preferenceθL. Similarly, a recall may be considered a stronger signal about individual vehicle quality in some segments than others; in the model, this can be captured by a stronger correlation between recalls and low qualitycanddfor those segments. It is not ex ante clear whether such a signal is likely stronger or weaker for a high-end segment.
For instance, a recall may be more surprising to both buyers and sellers if the car has a strong quality reputation. Simultaneously, a strong reputation may mitigate the extent to which market
13Depending on how ’noisy’ the recall information shock is, this increase in information asymmetries may be more or less common. For instance, the marginal vehicle will never be recalled if recalls only affect the lowest qualityc vehicles.
participants update the perception of vehicle quality after the arrival of recall information.14 Finally, it is important to highlight that the discussion above assumes that a recall is considered an adverse signal of vehicle quality. This is the conventional assumption, and consistent with the negative effects of recalls on new vehicle sales and firm stock market value identified in the literature.15 We however cannot rule out that, in some instances, a recall is instead perceived positively. For instance, a well-managed recall may be interpreted as the manufacturer putting care into ensuring continued satisfaction with its customers. If indeed recalls are perceived as a positive signal for vehicle quality, the above theoretical implications are opposite: it would lead to reduced transactions through the sorting channel, and increased transactions through a mitigation of adverse selection.
4 Data description
Data sources For our analysis we use registration data collected by RDW. We consider passenger car registration data from November 2017 to March 2019. For each vehicle, we have information on the license plate, ownership changes, date of first registration, and detailed information on a wide range of vehicle characteristics. Additionally, we know the type, variant, and version of each vehicle, which allows us to distinguish between different groups of vehicles belonging to the same brand or model. Vehicles within the same version are identical in the most of vehicle characteristics, with the exception of minor traits (e.g., color) or accessories.16
We complement the registration data with data from the RDW recall registry, which includes all recalls since 2012. For each recall, we know the date the recall was issued by the manufacturer and RDW, and the date of notification of car owners. The registry reports also the number of vehicles recalled in the Netherlands and worldwide, a classification of the risk from the defect
14There exists evidence that establishing a brand reputation through advertising can mitigate the adverse customer response after ’bad news’ (Barrage, Chyn, & Hastings, 2020). Rhee and Haunschild (2006) however document that high-reputation automakers experience larger declines in market share following a recall.
15See e.g., Rhee and Haunschild (2006) and Hammond (2013). Analogously, Beattie, Durante, Knight, and Sen (2020) find that newspapers provide lower coverage of recalls issued by manufacturers that are regular advertisers.
16We explain in detail how these categories are determined and their role in our identification strategy in Section 5.
(serious, average, low), the vehicle part that is considered defective, and the method through which the recall was communicated to the vehicle owner. Our final dataset is thus in a panel format, where for each vehicle-month we observe whether the car changed owner and whether a recall was issued.
Market share and recalls by manufacturer While the Dutch passenger car fleet includes a wide range of brands, there are six dominant manufacturers: Volkswagen, Opel, Peugeot, Renault, Ford and Toyota.17 These manufacturers all have market shares exceeding 6%, and collectively account for about half of the total vehicle fleet (see Figure A.1 in Appendix A). The remaining top 20 brands are primarily Asian and European, with individual market shares between 1% and 5%.
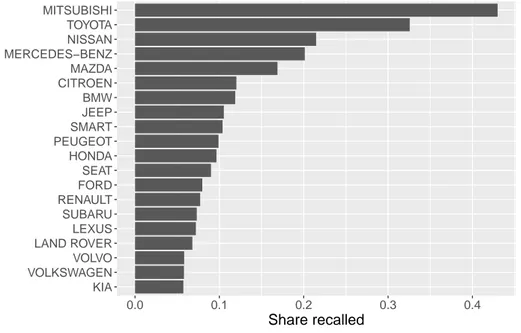
Some manufacturers issue more recalls than others. Figure 1 displays for the major manufac- turers the share of registered vehicles that has been recalled at least once between November 2017 and March 2019.18 We observe that during this period, Mitsubishi and Toyota recalled the greatest proportions of their vehicle fleet, 42 and 32 percent, respectively. These high shares can mostly be attributed to the unusually expansive and continuing Takata-Toyota airbag recall.
Characteristics of vehicle recalls Vehicle recalls are a very common occurrence. From Novem- ber 2017 to March 2019 we observe 896 recall episodes, which jointly involved 957,572 vehicles.
This amounts to about 9.47% of vehicles ever in circulation during that period. If we additionally consider earlier recalls, we find that 1,957,581 vehicles, or 19.37% of the fleet, has been recalled at least once. Appendix A provides additional information about recalls in the Netherlands in terms of severity, part involved, and number of vehicle involved per recall.
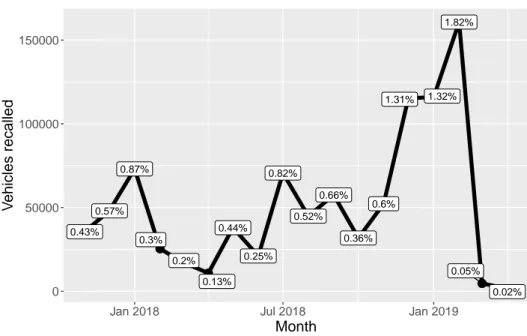
The number of recalled vehicles varies noticeably over time (Figure 2), both in absolute terms and as a share of the size of the fleet in that particular month.19 On average, we observe a monthly
17In the remainder, we will use the terms "brand" and "manufacturer" interchangeably.
18The figure excludes brands with very small market shares. Several of these brands have recall shares exceeding 50 percent. This is probably due to the fact that those manufacturers sell relatively few distinct vehicle models, which implies that a single recall more likely involves a large share of their total fleet.
19The size of the fleet changes from month to month due to new registrations (new vehicle sales and used car imports), exports and vehicles that are stolen or scrapped. As a consequence, the number of vehicles ever in circulation, as referred to in the previous paragraph, exceeds the size of the fleet in a given month by around 1/8.
Figure 1: Share of recalls by brand (Nov 2017-Apr 2019), top 20, only brands with >0.1% market share
KIA VOLKSWAGEN VOLVO LAND ROVER LEXUS SUBARU RENAULT FORD SEAT HONDA PEUGEOT SMART JEEP BMW CITROEN MAZDA MERCEDES−BENZ NISSAN TOYOTA MITSUBISHI
0.0 0.1 0.2 0.3 0.4
Share recalled
recall rate of about 0.59%, which amounts to about 51,000 vehicles each month.
Vehicle resales In our sample period, ownership changes are frequent: on average 2.78% of the vehicle fleet changes owner in a given month. In our sample period, we record a total of 4,246,779 ownership changes.20
Figure 3 shows the share and the total number of resales over time. We observe relatively high resale rates from January 2018 through March 2018. This is likely explained by changes in new vehicle registration taxes becoming effective as of January 2018. Towards the end of our sample period, the rate of monthly resales is fairly stable between2.5%and2.9%
20While in the text we use the terms ownership changes and resales interchangeably, we cannot verify that each ownership change corresponds to an actual transaction. It is possible that ownership changes very close in time are simply the result of administrative changes within a dealer. In our analysis, we find that our results are robust to excluding ownership changes that occur soon after the previous one (3 months, 6 months, 12 months).
Figure 2: Number and share of vehicles recalled per month
●
●
●
●
● ●
●
●
●
●
●
●
●
● ●
●
● ● 0.43%
0.57%
0.87%
0.3%
0.2%
0.13%
0.44%
0.25%
0.82%
0.52%
0.66%
0.36%
0.6%
1.31% 1.32%
1.82%
0.05%
0.02%
0 50000 100000 150000
Jan 2018 Jul 2018 Jan 2019
Month
Vehicles recalled
Figure 3: Number and share of vehicles resold per month
●
●
●
●
●
●
● ●
●
●
●
●
●
●
●
●
● 2.83%
2.64%
3.12%
2.79%
3.1%
2.71%
2.82% 2.82%
2.87%
2.7%
2.67%
2.76%
2.72%
2.53%
2.84%
2.64%
2.77%
230000 240000 250000 260000 270000 280000
Jan 2018 Apr 2018 Jul 2018 Okt 2018 Jan 2019 Month
Vehicles resold
5 Empirical strategy
Identification In this section we introduce the econometric methodology used for the main anal- ysis. Any identification strategy of the causal effect of vehicle recalls on vehicle resales must
take into account why recalls occur in the first place. If recalls were a random event, we could simply compare differences in resales before and after their occurrence. However, vehicle recalls are unlikely to happen randomly; they might be correlated with other (in)visible characteristics and brand-model reputation. For instance, cars from a certain brand might be more likely to be recalled because the manufacturer paid less attention to product quality in general.21Similarly, for specific vehicle models, recalls may be correlated with other problems, such as poor driving experience and performance, or higher overall maintenance costs.
Thus, a simple approach that consider changes in resales between different brands or models might also capture broader brand or model specific characteristics that are not linked to the recall, but do affect the resale probability and prices. In an ideal setting, this issue would be resolved by comparing two groups of identical cars, of which only one received a recall. Our identification strategy mimics this approach by exploiting the variation in resales between recalled (treatment) vehicles and non-recalled (control) vehicles belonging to the same version. As defined by EU regulation, and further explained below, vehicles belonging to the same version must be identical in all main vehicle characteristics. As such we are able to mitigate concerns that, within a version, recall occurrence is correlated with the characteristics of the vehicle.
We consider this approach of using the EU vehicle classification system, where vehicle versions are defined in accordance with directives composed and executed by industry experts, preferable to an alternative approach wherein we ourselves would define an ‘equivalent vehicle’ based on observables. To our knowledge, we are the first to exploit the EU vehicle system classification as part of the identification strategy. This strategy is facilitated by the highly disaggregated and rich nature of the Dutch vehicle registration data. Further information about how vehicle versions are defined in the EU classification system is provided below.
21There is indeed anecdotal evidence on the correlation between vehicle defects and broader flaws in the production process. A report to the GM board of directors about the vehicle recall due to faulty ignition system underlines general issues within the company: "While GM heard over and over from various quarters[...]that the car’s ignition switch led to moving stalls, group after group and committee after committee within GM that reviewed the issue failed to take action or acted too slowly. Although everyone had responsibility to fix the problem, nobody took responsibility.[...]A critical factor in GM personnel’s initial delay in fixing the switch was their failure to understand, quite simply, how the car was built." (Valukas, 2014). Recent research has also established a negative effect of firm financial position on recalls of durable goods, including cars (Kini, Shenoy, & Subramaniam, 2017).
Vehicle version and EU classification Before a specific vehicle can be sold on the European market, vehicle manufacturers are required to obtain an approval. Approvals are classified accord- ing to well-defined categories of vehicle type, variant, and version (European Parliament, 2007).
Vehicles of the same type are identical in the following aspects: manufacturer, fundamental char- acteristics of chassis/floor pan, and power plant (e.g., internal combustion/electric/hybrid). Within the same variant, vehicles must also be identical in terms of body style, engine working principle, number and arrangement of cylinders, axles, while only limited variation in engine power and en- gine size are permitted. Finally, vehicles belonging to the sameversionare also identical in terms of engine power and size, gear, fuel consumption, seats, and emissions. Thus, within a version, vehicles are close to identical, except for certain optional characteristics, such as color, upgraded interior trim pieces, or additional safety packages.
Though, in principle, two vehicles manufactured many years apart could belong to the same version, this rarely occurs. Rather, due to the rapid technological progress and intense competition in the vehicle sector, the dispersion in vehicle age within the same version is small: we find a mean difference between the first and last-sold vehicle within a particular version of 274 days, and a median difference of 190 days.22 As consumers generally understand that different generations of a specific vehicle can be of different quality, and will not consider vehicles that greatly differ in age as ‘equivalent vehicles’, we consider this an advantageous feature of using the version classification to identify very similar cars.
It is relevant to highlight that the same commercial name is typically used for several vehicle versions, or even variants or types.23 Vice versa, manufacturers nearly always advertise all vehicles belonging to the same version under the same commercial name in the market of sale. As the specific version classification is not communicated to the consumer other than through the vehicle certificate, vehicle owners are unlikely aware of this information.
22Changes in vehicle regulatory requirements contribute to this, as vehicle manufacturers are obliged to terminate new vehicle sales whenever vehicles of that particular version are no longer compatible with the latest regulatory requirements.
23For example, the same commercial name "Ford Focus Wagon 1.6 Ecoboost Titanium 150PK" can belong to a vehicle with type approval "e13*2007/46*1138*00", but also to a vehicle with type approval "e13*2007/46*1138*03".
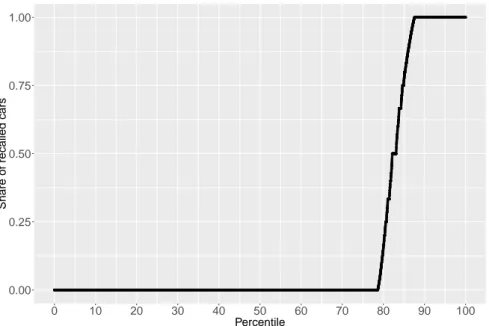
Variation in recalls and sample used Our empirical strategy allows us to identify the effect of receiving information about a recall on the probability of vehicle resale only if there exists suf- ficient variation in recalls across different vehicles belonging to the same version - i.e., if within same version some vehicles are recalled and some are not. Figure 4, which illustrates the distribu- tion of versions based on their share of recalled cars, shows this is the case. As can be seen from the figure, 78 percent of versions never had a vehicle recalled, while for 12 percent of versions, all vehicles had been subject to a recall. Our identification strategy thus relies on exploiting variation in recalls in the remaining 18,789 versions (8.93% of all versions in the sample), as these contain both recalled and non-recalled vehicles.
There are several potential explanations for why of two seemingly identical vehicles, one may be subject to a recall, and the other not. Vehicles from the same versions might have been produced in different plants, in different production cycles, and for these or other reasons have components from different suppliers. Then any variation in the production process across plants or cycles, or simply a poor batch of supplies, may cause variation in recalls within vehicle versions.24 This is similar to what occurs for recalls in the food industry, where typically only specific batches or serial numbers of the same product are withdrawn from the market. Because there exist such variation in the need to recall vehicles within the same version, recalls are issued and registered at the level of specific vehicles.
The main dataset we use in our analysis includes 7,852,875 vehicles and 202,637 versions.
This dataset includes only vehicles that have either not been recalled or that have been recalled only once; this ensures we have a clear date of the start of the treatment. We exclude also very old vehicles, typically registered for the first time before 2000, for which our dataset does not specify the type-variant-version classification. Finally, there is a very small number of vehicles that disappear from the sample within our sample period. This could be because the vehicle has been scrapped or because it has been stolen. Because we are not able to distinguish between these
24Communication with the Dutch regulatory authority confirmed this is a credible hypothesis. Additionally, the fact that the EU Rapid Alert System reports for each recall both the range of dates of fabrication and the Vehicle Identifier Numbers of the recalled vehicles is consistent with this hypothesis.