Philip Manow Patrick Emmenegger
Religion and the gender vote gap Women’s changed political preferences from the 1970s to 2010
ZeS-Working Paper No. 01/2012
WORKING PAPERS
Zentrum für Sozialpolitik Universität Bremen Postfach 33 04 40 28334 Bremen Phone: 0421 / 218-58500 Fax: 0421 / 218-58622
E-mail: srose@zes.uni-bremen.de Editor: Dr. Christian Peters
http://www.zes.uni-bremen.de Design: cappovision, Frau Wild ZeS-Arbeitspapiere ISSN 1436-7203
Prof. Dr. Philip Manow University of Bremen
Centre for Social Policy Research (ZeS) manow@zes.ui-bremen.de
Dr. Patrick Emmenegger
Department of Political Science and Public Management
University of Southern Denmark emm@sam.sdu.dk
Philip Manow Patrick Emmenegger
Religion and the gender vote gap Women’s changed political preferences from the 1970s to 2010
ZeS-Working Paper No. 01/2012
ab st r ac t
For many years women tended to vote more conserva- tive than men (the ‘old’ gender vote gap), but since the 1980s this gap in many countries has shifted direction:
now women in many countries are more likely to sup- port left parties than men of the same age, in the same income bracket, and at the same educational level (the
‘new’ gender vote gap). The literature largely agrees on
a set of political-economic factors explaining the change
in women’s political orientation: changed employment
patterns, women’s higher educational achievements, and
higher divorce rates. These trends turned women into
supporters of generous social programs that promise
to ‘de-familialize’ services formerly provided privately
within the family. In this paper, we demonstrate that these
conventional political-economic factors fall short in ex-
plaining the old gender vote gap. We may therefore also
harbor doubts whether they provide us with a full story
for the new gender vote gap. Instead, we highlight the im-
portance of religion for the gendered pattern of voting be-
havior that we observe. We argue that where vote choice
expressed preferences on a non-economic, i.e. mainly re-
ligious issue dimension, parties in the past could afford –
at least to some extent – ignoring voters’ socio-economic
interests. Given that surveys show us a constantly higher
degree of religiosity among women and a relatively per-
sistent and strong impact of religion on vote choice, reli-
gion can indeed, we argue, explain a substantial part of
the old and new gender vote gap.
co nt Ent
Introduction 7 Explaining the Gender Vote Gap: the Literature 10 Empirical Analysis 15 Data and some descriptive findings 15
Multivariate analysis 19
Conclusions 32 References 33 Appendix 36 Data description: 41
For many years women tended to vote more conservative than men (the “old”
gender vote gap), but since the 1980s this has changed: women in many countries are now more likely to support left parties than men of the same age, same income bracket, and same educational level (the
“new” gender vote gap; cf. Ingelhart and Norris 2000; Giger 2009). The literature has offered several explanations for this robust finding, but largely agrees on a set of determinants to explain the change in women’s political orientation: changed employment patterns, women’s higher educational achievements, higher divorce rates and consequently more lone moth- ers. These trends turned women into sup- porters of generous social programs that promise to “de-familialize” services for- merly provided privately within the fam- ily, i.e. overwhelmingly by women (Esp- ing-Andersen 2009). De-familialization of family care makes it easier for women to find employment in the private service sector or in the welfare state itself, if the welfare state offers women enhanced em- ployment chances in public social services (Huber and Stephens 2000). This expla- nation generates both a temporal predic- tion: over time, the new gender vote gap should widen, and a comparative predic- tion: the new gender vote gap should vary with female labor force participation and divorce rates (cf. Iversen and Rosenbluth 2006, 2010). This could account for the fact that in some countries (Scandinavia, North America) women developed pro-
welfare state preferences, i.e. voted left, much earlier than in other countries (e.g.
Southern Europe).
Although the empirical evidence by and large matches these expectations, we think that this account leaves a couple of important questions unresolved, most importantly: Why did women’s and men’s voting behavior in the 1950s and 1960s differ (the old gender gap)? Female la- bor force participation and divorce rates were still low, political preferences should have predominantly been formed at the household level and therefore supposedly should have been fully harmonious be- tween the sexes. Since the conventional political-economic factors apparently fall short in explaining the old differences in political preferences among the sexes, we also doubt whether they fully explain the new. In this paper we highlight the impor- tance of religion for the gendered pattern of voting behavior that we observe. We argue that where vote choice expressed preferences on a non-economic, i.e. main- ly religious issue-dimension (De La O and Rodden 2008), parties in the past could afford – at least to some extent – ignoring voters’ socio-economic interests. Given that surveys show us a constantly higher degree of religiosity among women and a relatively persistent and strong impact of religion on vote choice (Dalton 1996;
Brooks et al. 2006), religion can indeed, we argue, explain a substantial part of the old and new gender vote gap.
Importantly, our argument pertains
Introduction
not only to religious determinants of the individual vote choice, but also to the competitive constellation among parties.
We contend that in countries with a strong confessional cleavage, party competition over the religious, i.e. over-proportion- ately female vote was distorted. Given that devout Catholics could not credibly threaten to switch to a left party given those parties’ pronounced, often aggres- sive anti-clericalism, Christian democratic parties could for a long time count on loyal voters with a socio-economic background who otherwise, in the absence of the con- fessional cleavage, would have opted for a different party with a more redistributive platform. Elsewhere, the inter-party com- petition for the female vote was not reli- giously contorted, and therefore left and right parties’ programmatic adjustment to the changed employment and family pat- terns happened much earlier.
In the following we show that (1) relig- iosity remains a strong and independent factor in vote choice in Western democra- cies (although the share of religious voters has decreased over time), that (2) gender differences in religiosity accounted for much of the old gender differences in vot- ing behavior, i.e. that gender differences in voting substantially decrease once we control for religiosity. We demonstrate that religious voting is more pronounced in party systems with a strong pro-/anti- clerical cleavage (3). And we show that (4) the gender vote gap is almost fully explained with controls for employment, marital status, and religiosity.
We also point to one intervening fac- tor which up to now has been rather ne- glected in the literature: although women
may develop an interest in more generous child care provision, all-day schooling, and other welfare programs that “de-fa- milialize” services initially provided pri- vately, these political preferences often, but not necessarily, translate into a vote for a left party. This is because women’s interests in easy labor market entry may also translate into preferences for less employment protection, lower minimum wages, and higher labor market flexibility – given that high minimum wages crowd out private services (like private child care) and given that high employment protection discriminates against women with their higher probability of career in- terruption (Estevez-Abe 2006). But these
“outsider” interests in less regulation have clearly not been served by tradition- al left parties (Rueda 2005). We therefore need to control for labor market context if we want to identify the determinants of the female vote choice: where the provi- sion of public social services by a gener- ous welfare state is a likely option, women might increasingly vote for social demo- cratic parties (Huber and Stephens 2000;
Iversen and Wren 1998), but where this is not a realistic option, it might be in their interest to vote for a party that promises to deregulate labor markets.
Our argument contributes to the lit- erature in several respects: we offer a consistent explanation for the alignment and re-alignment of the female vote. In accordance with a larger voting literature (cf. Dalton 1996; Brooks et al. 2006), we stress the enduring importance of non- economic factors, in particular the impact of religion on vote choices. We emphasize that this also means that women’s political
preferences in conservative welfare states or Catholic countries cannot exclusively be explained with rational calculations based on socio-economic interests (Ivers- en and Rosenbluth 2006, 2010). Thereby our argument also helps explain a para- dox of the comparative welfare state liter- ature, namely that women in Continental and Southern Europe tended to vote for parties that were particularly unrespon- sive to their socio-economic interests (Lewis 1992; Sainsbury 1994; Sainsbury 1996; O'Connor et al. 1999). Our main ex- planation points to the distorted electoral competition for the religious vote in coun- tries with a strong confessional cleavage.
Moreover, we demonstrate the context sensitivity of women’s vote choice. Where the generous provision of social services by the welfare state was not a feasible op- tion (Iversen and Wren 1998), women’s interest in less regulated labor markets of- ten made them opt for the political right.
We thereby demonstrate the relevance of the service economy trilemma for the new gender vote gap in Western European countries since the 1970s.
The paper proceeds as follows: After a brief summary of the literature, we de- velop our own hypotheses, describe our data and report our empirical findings and finally conclude.
Explaining the Gender Vote Gap: the Literature
The literature on electoral behavior in the first three postwar decades finds a per- sistent pattern of “female conservatism”
– women are more likely than men with the same socio-economic characteristics to vote for conservative parties (Norris 1987). These gender differences in voting behavior were often not very large and varied across countries, but they existed and persisted. However, this old gender vote gap seemed to have dissolved by the late 1970s and early 1980s. With the Unit- ed States as a forerunner and the Scandi- navian countries close behind, students of electoral behavior observed first women’s political de-alignment and subsequently their re-alignment: not only did the old gender vote gap disappear in many coun- tries, a new one appeared in its stead, with women now being more likely to vote left than men of the same age, income and educational level (Studlar et al. 1998; In- glehart and Norris 2000: 450, Figure 3).
The literature has explained the tradi- tional gender differences in political pref- erences and behavior with women’s lower degree of labor market participation and longer life expectancy. The literature also refers to women’s educational role in the family and the corresponding stronger emphasis on moral and value issues as the cause of political preferences and of a voting behavior that seems to be less well predicted with socio-economic status (cf.
Jelen et al. 1994). The new gender vote gap then could – to a large extent, so it seemed – be consistently explained with
changes in the determinants of the old one: with higher female labor force par- ticipation, higher divorce rates, and more generally with changed family patterns and encompassing value change. With a higher chance of being or becoming eco- nomically independent of the male part- ner’s income and his labor market fate, with a higher chance of own labor force participation, with higher educational attainment, women’s voting decisions should more and more mirror their dis- tinct economic policy preferences. Wom- en’s changed economic role went hand in hand with a broader value change, a stronger emphasis on self-expression, equal opportunity, the erosion of tradi- tional gender roles, more liberal views on the family and sexual mores. According to the “developmental” theory of the old and new gender vote gap structural and cul- tural changes – mutually reinforcing each other – both contributed to women’s po- litical de- and re-alignment (Inglehart and Norris 2000; Inglehart and Norris 2003;
Inglehart 1990; Inglehart 1997).
Behind these explanations lies an ar- gument in which a lesser degree of labor market participation or generally of eco- nomic involvement allows non-economic considerations to more forcefully enter the individual voting decision. Jelen et al. (1994: 171) summarize this position as follows: “relatively sheltered lives led by most women in much of the West in earlier decades … rendered women rela- tively pure carriers of a culture’s tradi-
tions. (…) as women increasingly enter the paid labour force, these traditional differences are likely to be reduced or eliminated.” More recent studies on the impact of religion on political preferences are compatible with this argument (cf. De la O and Rodden 2008; Finseraas 2010).
A second, “moral” issue dimension ex- plains deviations from purely economic, interest-driven voting because it forces voters to choose between their moral and economic preferences. Race or religion in the context of US politics or religion in the context of European politics can be such a second dimension, which splits the class vote and thereby weakens the support of the left. The saliency of the two dimen- sions may differ among societal groups.
For instance, De la O and Rodden (2008:
440) show that the relationship between church attendance and voting for non-left parties is mainly driven by low income voters. In contrast, high income voters seem to more closely follow their econom- ic preferences. In a variation of this argu- ment, Roemer (1997, 2001) explains de- viations from economic voting with “issue bundling”. Political parties adopt posi- tions on several issue dimensions. Voters then choose among these issue bundles offered. Given a limited number of par- ties, poor religious voters might be forced to choose between a pro-redistribution, anti-clerical and an anti-redistribution, pro-clerical party. For strongly religious voters, the anti-clerical party might not be an option.
Other explanations for the observed gender differences have been put for- ward. Some hold that spirituality and pro- tection against existential threats are sub-
stitutes for each other, so that religious persons demand less social protection than non-religious people, also because they in situations of need can count on local support networks (Gill 2001; Norris and Inglehart 2004; Scheve and Stasav- age 2006). An alternative argument holds that traditionally the gender division of labor had aligned women’s political pref- erences with that of their male partners (cf. Iversen and Rosenbluth 2010, 2006).1 Given that women have natural advantag- es in caring for very young children, fami- lies in the past tended towards an “effi- cient” division of labor: men are in formal employment, women do the non-market family work (Becker 1981). But once di- vorce and/or female labor force participa- tion become likely events, women start to care more about their labor market
“outside options”. Male and female eco- nomic and then also political preferences become distinct.
Women’s new interests primarily con- cern the compatibility of work and fam- ily, easier labor market access, a (public) infrastructure for early child care and all-day schooling as well as for caring for the old and frail, own welfare entitle-
1 One – less often discussed – implication would be that we may then observe not only gender differences in vote choices, but also in turnout. In fact, studies on electoral turnout have found persistent, if small differences between the sexes (Blais 2000; Franklin 2004), but usually do not discuss causes and conse- quences. Our argument stresses that religious voters are confronted with ‘cross-pressures’ – on a socioeconomic dimension they would like to vote for left parties, on a second dimension they cannot, since left parties are aggressively anti-clerical. Cross-pressure has been identi- fied as a major determinant of abstention.
ments instead of those that are linked to the male’s employment status, the reform of tax provisions that discriminate against female labor force participation etc. (Esp- ing-Andersen 2009). The traditional gen- der division of labor – epitomized in the
“male breadwinner” model – becomes contested, since women’s household skills are only partially marketable and are developed at the cost of their marketable skills. With higher divorce rates, women therefore develop political preferences for welfare state policies that would ease their labor force participation (Manza and Brooks 1998).2 Rosenbluth and Iversen (2010) see variations in values then as caused by the different degrees of wom- en’s inclusion into the labor market: “In countries where the demand for female labor is limited … women are more likely than men to be socially conservative de- spite the unflattering roles their conserva- tism gives them to play. … the reason is that women for whom the marriage mar- ket is the principal way to secure a live- lihood seek to shore up the sanctity and strength of family values. Once committed to the life of a married woman, that mar- riage is the best that binds securely and for which obligations are taken seriously by the man as well as by the woman”
(Iversen and Rosenbluth 2010: 113).
These explanations leave us with a
2 This is not necessarily the case, but rather dependent on whether the transition to a post- industrial society with high female employ- ment in the service sector takes a ‘private’ or a ‘public’ route, i.e. whether much of the new social services are provided by the welfare state – as in Scandinavia – or through the market – as in the Anglo-Saxon countries (Scharpf 1997;
Iversen and Wren 1998).
couple of open questions. Let us first take the “religious people demand less welfare”-argument. The reversed causali- ty seems more plausible: where traditional religious voting loses its former strength, religious parties (= Christian Democracy) may want to keep their voters by appeal- ing increasingly to their material inter- ests. Social protection may be a substitute for religiosity, not because religious per- sons demand less social protection, but because religious parties supply more so- cial protection once religious motives lose strength (Kersbergen and Manow 2009).
This implies – put pointedly – that the wel- fare state does not cause secularization (Norris and Inglehart 2004), but is caused by secularization, i.e. a waning religiosity.
As we know, Christian Democratic par- ties are not simply the transmission belt for the Catholic Church and its social doc- trine, but they have used social policies to become independent from the church hierarchy (cf. Kalyvas 1996) and – we can add – more recently to become independ- ent from exclusively religiously motivated voters, particularly in light of the fact that these voters are declining in numbers.
This would also explain the “women un- friendliness” of the Christian Democratic welfare state: these parties could afford to neglect the interests of the groups who were most loyally attached to them.
Secondly, let us look at Iversen/Rosen- bluth’s argument about women’s rational preferences for the male breadwinner model. Changing family patterns and work roles are common trends affecting all Western nations, but why has the de- mand for female labor been more limited in some countries and why was the tran-
sition towards a post-industrial and more gender-equal society slower in some countries than in others in the first place?3 We encounter the same problem when we consider divorce rates as an explanatory factor for recent changes in female voting behavior. Edlund and Pande (2002) found a nexus between a country’s “divorce risk” and women’s left voting – but again it is not clear whether higher divorce rates indicate a weakening of religious norms – a weakening which then would also set free a vote that previously had been “cap- tured” by religious parties (i.e. Christian Democracy), or whether women – con- fronted with higher divorce rates – react rationally to the risk of income loss due to a family breakup by voting for left par- ties and their pro-welfare state programs.
For labor force participation as well as for divorce rates, the rationalist/materialist account has a hard time explaining why in the past some countries female labor force participation was so much lower than elsewhere, if the old “male bread- winner” model was simply based on the small (and universal) differences between the sexes with respect to caring for very young children, or why the breakup of a marriage was less likely in some countries than in others. In this context it seems im- portant to emphasize that a gender gap does not only emerge “when marriage contracting is incomplete and termination
3 Part of the answer may lie in the gendered employment pattern of coordinated econo- mies (Estevez-Abe 2006). But only part, since countries like Italy that do not rank high on any index of non-market coordination show the pat- tern of low female labor force participation, low divorce rates, a traditional male breadwinner model, and a conservative gender vote gap.
of the contract is an ever-present possibil- ity” (Iversen and Rosenbluth 2010: 110), since – as we have seen – voting behavior also differed between the sexes in the old days of low divorce rates. This, we claim, points to the persisting independent caus- al impact of religion or religiosity on vote choices.
Once this independent causal impact is acknowledged, we can move beyond the ultimately unanswerable question whether Catholicism led to a very tra- ditional, patriarchic gender division of labor which then contributed to female conservatism, or whether a low degree of women’s integration into the labor mar- ket instilled conservative values among female voters. Our argument, which em- phasizes the influence of the party sys- tem, posits that in countries with a strong pro-/anti-clericalism cleavage pious vot- ers could not vote for left parties because of the latter’s strong anti-clerical stance.
One central prediction following from this is that the influence of religion on politi- cal preference formation and voting will not go away once we control for female labor force participation or for differences in marital status. Our empirical investiga- tion will show that religiosity remains a strong if slowly weakening determinant of vote choices and political preferences even if we control for all relevant econom- ic and familial factors. The higher degree of religiosity among women is a factor that consistently explains cross-country and temporal variance in the old and new gender vote gaps, with its consequences for redistribution, design of welfare state schemes, gender division of labor etc. Our main causal path, therefore, does not go
through the labor market, but through the party system.4 Our argument generates a series of hypotheses that will be tested in the following section:
(H1) Religiosity is a powerful inde- pendent predictor of the voting decision, in particular in countries characterized by a strong confessional cleavage.
(H2) The weaker the confessional cleavage in a country, the earlier the old gender vote gap disappears.
(H3) The old (new) gender vote gap becomes weaker (stronger) when we con- trol for religiosity.
(H4) Non-married female respondents are more likely to vote for left and cent- er-left parties. But since marital status is endogenous to religiosity, the effect of marital status is weaker than the effect of religiosity.
(H5) Labor market participation in- creases the likelihood of women voting for left and center-left parties if the country
4 This distinguishes our argument from John Roemer’s related argument (Roemer 1997, 2001). His model supposes two-party competition in two dimensions and therefore seems to fit the US case better. It emphasizes the incentives for a left party: Given that some religious poor voters do not vote for the left, a left party has to cater to a voter with a higher income than it would in the absence of this second dimension. We look at multi-party systems in which inter-party competition over a certain group of voters is severely distorted.
We emphasize the incentives for the (center-) right party: Given that it can count on a group of loyal voters, it can neglect this group’s mate- rial interests. Our model is rather informed by Europe’s Christian Democratic party family and the welfare states it has contributed to set up in the postwar period. We would also like to highlight that a second moral issue dimension cannot be invoked by politicians at will – but either exists in a country or does not exist.
is characterized by the public provision of social services. Again, since labor mar- ket participation is (partly) endogenous to religiosity, the effect of labor market participation is weaker than the effect of religiosity.
Data and some descriptive findings
We use two data sources, the World Val- ue Survey and the Eurobarometer Sur- veys. Eurobarometer is a biannual survey conducted in all EU member states with around 1,000 respondents per country.
The 86 surveys from 1970 to 2002 have been integrated and standardized in the EB trendfile as provided by the Mannhe- im Centre for European Social Research with around 1.13 million observations. We have combined the trendfile with more recent Eurobarometer surveys to cover four full decades of socio-economic and cultural change from 1970 to 2010. The Eurobarometer surveys are a surprisingly underused data source. Besides a bat- tery of EU-related questions, the surveys include a large number of standard ques- tions relating to the respondent’s demo- graphic, socio-economic and attitudinal profile. Surveys ask respondents for their left-right self-placement, their vote inten- tion, and whether they “feel close” to a particular party or are party members.
This information can be combined with the additional basic demographic and socio-economic information on gender, income, age, education, marital status, and occupation. The Eurobarometer sur- veys also provide information on denomi- nation, religiosity, work for charitable or religious organizations, and – of particu- lar importance for our context – on church attendance. This exceptionally rich data set allows for a longitudinal study of the
changing political and religious affilia- tions of men and women, although such an endeavor is hindered by the fact that some basic categories have not been re- ported continuously.5
The World Value Survey is the larg- est cross-national survey on political atti- tudes. As of now, five waves are available.
In the following analyses, we use waves 1 (early 1980s), 2 (early 1990s) and 4 (early 2000s) from the four-wave integrated data file produced by the WVS data archive.
There are thus approximately ten years between each wave. The following ten countries are included in all three waves:
Belgium, Canada, Denmark, France, Ger- many, Great Britain, Ireland, Italy, Spain, and the United States of America. The World Value Survey provides information on the party respondents would vote for, church attendance, labor market partici- pation, marital status, and a range of con- trol variables.
We start with some descriptive find- ings based on the long-term trends docu- mented by four decades of Eurobarometer surveys. For presentational reasons, we first pick four prototypical countries: Italy as a classic Catholic country with a strong confessional cleavage line, with a con- servative, “women-unfriendly” welfare
5 The church attendance question has been asked only rarely in Eurobarometers conducted after 1998, the vote intention question has unfortunately not been continued past 2000, and the household income question has been dropped in post-2002 surveys (see below).
Empirical Analysis
state and – paradoxically – a particularly strong conservative gender vote gap (Cor- betta and Cavazza 2008); Germany as an- other conservative welfare state, although with somehow different labor market and social security institutions, but historical- ly also with a strong conservative gender vote gap (Inglehart and Norris 2000: Ta- ble 1, 443); Denmark as an initially Prot- estant, today very secular society in which women early on shifted their allegiance to left parties in support of the generous Scandinavian welfare state policies; final- ly Great Britain as a country with an inter- mediate level of religiosity (and a domi- nant Anglican state church, therefore no strong confessional cleavage line), with a liberal-residual welfare state, in which women did not find employment in pub- lic (social) services, but mainly in private services (Scharpf 1997; Iversen and Wren 1998), where women’s interests with re-
spect to the welfare state therefore were much more equivocal. Without employ- ment in the public sector as a very likely option, female labor force participation rests on a flexible labor market both in the sense of allowing to substitute private family services via a cheap private service sector and of easing labor market entry by
“outsiders” (Rueda 2005). 6
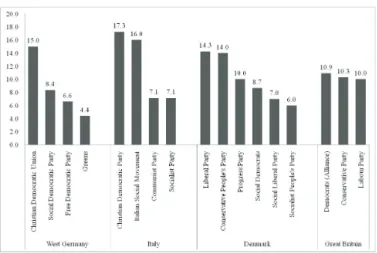
Figure 1 displays the strength of the confessional cleavage in these four coun- tries. Using the data by Laver and Hunt (1992) and for parties with a vote share higher than 5 percent at the time of the expert survey (1989), Figure 1 shows the
6 The EB surveys contain data for five more countries from the 1970s onwards. The analysis of Belgian, Dutch, and French data leads to identical conclusions (results are available upon request). We did not use data for Luxem- bourg (low number of observations) and Ireland (the confessional cleavage is intermingled with issues of national identity and independence).
Figure 1: Anti-clerical (1) vs. pro-clerical (20) policy scale in 1989
Note: Position of party leadership on the anti-clerical (1) vs. pro-clerical (20) policy scale based on an expert survey conducted by Laver and Hunt (1992). Only parties that had a vote share higher than five percent at the time of the expert survey (1989) are listed. Source of party vote share: Armingeon et al.
(2010).
position of the party leadership on the anti-clerical (1) vs. pro-clerical (20) policy scale. The strongest confessional cleav- age can be observed in Italy, followed by West Germany. Virtually no confessional cleavage can be observed in Great Britain.
Finally, Denmark is located somewhere in-between with a quite pro-clerical Lib- eral Party (14.25) and an only moder- ately anti-clerical Social Democratic Party (8.67).
We focus on church attendance as our indicator for religiosity. This is a better in- dicator than religious beliefs “because it ties religiosity to existing institutions in- stead of more abstract religious concepts and values” (Minkenberg 2002: 237). In addition, church attendance captures the element of social control that is central to our argument. Finally, this operationaliza- tion enables us to use the same variable in both datasets and across all countries.
We are aware that this indicator tends to bias against Protestant countries, since Protestantism is a more individualized religion and puts stronger emphasis on individual forms of religious practice, like prayers (Haller and Höllinger 1994). Our main reason for using church attendance is data availability and comparability.
Church attendance is also better covered in the Eurobarometer surveys with 33 sur- veys including this question in the trend- file alone (i.e. from 1972-2002), but only 21 surveys asking about the respondents’
religiosity. Most importantly in our con- text, church attendance has figured in an additional five surveys in the 2000s (see appendix below, surveys in 2005, 2006 and 2010), which allows us to study four full decades of changing religious behav-
ior and attitudes, while religiosity or the importance of religion has not been an explicit topic in these more recent sur- veys. The same reasoning also guides our choice of dependent variables. We use the vote intention variable in our analysis of World Value Survey data. However, in the case of Eurobarometer surveys, data avail- ability speaks in favor of using the left- right self-placement of respondents (77 surveys) as our dependent variable, rather than their vote intention (59 surveys) or their last vote (covered in 31 surveys).
Very unfortunately, vote intention has dis- appeared altogether from Eurobarometer surveys after 20027 , the last vote question has been asked only once, in 2008 (EB 69.2), but not in a survey with informa- tion on church attendance. However, we arrive at similar conclusions when using vote intention as our dependent variable in the analysis of Eurobarometer surveys (results are available upon request).
Figure 2 (p. 18) displays the share of frequent churchgoers (attending church services once a week or more) by gen- der for Denmark, Great Britain, Italy, and West Germany in the period 1970 to 2010.
It shows that religiosity is clearly strong- est in Catholic Italy, but even here we see very marked gender differences. Almost 50 % of all Italian women go to church once or several times a week to about a third of all Italian men. This demonstrates that a substantial share of the old gender vote gap in the South European Catholic countries is due to the marked gender dif- ferences in religiosity. In the more secu-
7 The last Eurobarometer survey containing data on vote intention, church attendance, and control variables is from 1994.
Figure 2: Share of frequent churchgoers (several times or once a week), by country and year, 1970- 2010
Source: Mannheim Eurobarometer trendfile 1970-2002 (EB 1996 omitted). 2005: EB63.1, EB63.4, EB64.3; 2006: EB65.2; 2010: EB73.1. Data for 1972, 1974, 1979, 1982-84, 1986-87, 1996-97, 1999-2004, and 2007-2009 linearly imputed.
larized countries Denmark, Great Britain, and West Germany gender differences are less marked, although we find con- stantly higher church attendance rates among women in these countries, too. In addition, Figure 2 shows that the share of frequent churchgoers has declined in all countries except Denmark, where the share of frequent churchgoers was al- ready below 5 percent in the early 1970s.
In Italy the share of frequent churchgoers has declined from more than 50 percent in the early 1970s to less than 30 percent in 2010; in Great Britain and West Ger- many the share of frequent churchgoers has declined from about 25 percent in the 1970s to about 10 percent in mid-2000s.
In parallel to these decreasing levels of religiosity, we observe a change in the political positions of men and women.
Figure 3 (p. 19) displays the gender vote gap for the four countries in the period 1973 to 2010 using Eurobarometer data.
For reasons of data availability, we use the respondents’ left/right self-placement, which is a highly significant predictor of respondents’ vote intention and party af- filiation. The gender vote gap is measured as the difference between the share of women who score themselves as “left” (1 to 3 out of 10) and the share of men who score themselves as “left”. Figure 3 shows a clear old gender vote gap in Italy up to the mid-1990s and a clear new gender vote gap in Denmark from the mid-1980s onwards. Gender differences are less pro- nounced in Great Britain and West Ger- many. However, a move from a rather old gender vote gap to a new gender vote gap is clearly discernible.
Thus, we can observe a parallel trend in Western democracies: while the gender vote gap has turned from “old” (women vote more conservative than men) to
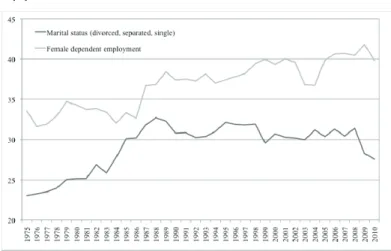
“new” (men vote more conservative than women), the share of highly religious voters has declined in parallel. Not only religiosity has changed in the last four decades, however. Figure 4 (p. 20) shows the average development of the share of respondents living alone (divorced, sepa- rated, without partner) and the female de- pendent employment rates in the period 1975 to 2010. In all four countries, we are observing secular trends towards single households and marital instability (most clearly in Denmark and Great Britain) as well as female labor market participation (most clearly in Italy and West Germany).
As in the case of religiosity, these secular
trends run in parallel to the changes in the gender vote gap.
Multivariate analysis
Given these parallel developments pre- sented in the previous section, we now turn to a multivariate analysis of the gen- der vote gap. In a first step, we analyze World Value Survey data to identify gen- eral trends across Western democracies.
The advantage of this data is that we can analyze more countries (10) and incor- porate more control variables into our regression models. The drawback is that we only have data for the early 1980s, early 1990s and early 2000s. 8 In a second
8 Using the other two available waves would force us to use different countries in the analy- sis of the different periods.
Figure 3: Gender vote gap, by country and year, 1973-2010
Source: Mannheim Eurobarometer trendfile 1970-2002; 2003: EB59.1; 2004: EB61; 2005: EB63.4; 2006:
EB65.1; 2007: EB67.2; 2008: EB69.2; 2009: EB71.1; 2010: EB73.4. Data for 1974 and 1975 are linearly imputed.
step, we use Eurobarometer data for the detailed analysis of the gender vote gap in Denmark, Great Britain, Italy, and West Germany. Eurobarometer data have the advantage that we can cover a longer time period (1970 to 2010). However, we are more limited with regard to use of control variables.
In the subsequent analysis of World Value Survey data, we use the intention to vote for left or center-left parties as our dependent variable. Respondents were asked which party they would vote for if national elections were held tomorrow..
We use a dummy variable to distinguish between respondents with the intention to vote for left or center-left parties and respondents with the intention to vote for any other party. We classified parties us- ing Cusack et al.’s (2006) party classifica- tion scheme. Our four main independent variables are gender, religiosity, labor market participation, and marital status.
We code respondents as religious if they attend religious services once a week or more. For labor market participation, we code respondents as economically ac- tive if they are employed (full-time and part-time), self-employed or looking for work (unemployed). The operationaliza- tion of gender is straightforward. Finally, marital status is measured using a dummy variable, which distinguishes between re- spondents living alone (divorced, sepa- rated, without partner) and the remaining respondents. In addition, we add interac- tion effects between gender and religios- ity, gender and labor market participation, and gender and marital status. We use the three interactions to test whether religios- ity, labor market participation, and mari- tal status have different effects on women than on men. Finally, we follow the lit- erature in controlling for age, education, income, unemployment, and union mem- bership (De La O and Rodden 2008). See
Figure 4: Respondents living alone (divorced, separated, without partner) and female dependent employment, 1975-2010
Source: Mannheim Eurobarometer trendfile 1970-2002; 2003: EB59.1; 2004: EB61; 2005: EB63.4; 2006:
EB65.1; 2007: EB67.2; 2008: EB69.2; 2009: EB71.1; 2010: EB73.4.
Table 1b: Predicted values (based on Table A1): Effect of dependent employment on left vote Women Men
Early 1980s 0.056
[0.009; 0.104] -0.020 [-0.070; 0.034]
Early 1990s 0.002
[-0.028; 0.032] 0.019 [-0.013; 0.050]
Early 2000s 0.028
[-0.004; 0.061] -0.005 [-0.038; 0.027]
Note: Shaded cells indicate significant effects (95% confidence intervals in brackets).
Table 1a: Predicted values (based on Table A1): Effect of church attendance on left vote Women Men
Early 1980s -0.059
[-0.102; -0.015] -0.115 [-0.162; -0.067]
Early 1990s -0.222
[-0.250; -0.194] -0.207 [-0.237; -0.177]
Early 2000s -0.175
[-0.204; -0.145] -0.143 [-0.177; -0.109]
Note: Shaded cells indicate significant effects (95% confidence intervals in brackets).
Table 1c: Predicted values (based on Table A1): Effect of marital status (divorced, separated, single) on left vote
Women Men
Early 1980s 0.058
[0.007; 0.108] 0.024 [-0.027; 0.075]
Early 1990s -0.000
[-0.034; 0.033] 0.009 [-0.023; 0.041]
Early 2000s 0.043
[0.011; 0.076] 0.033 [0.007; 0.065]
Note: Shaded cells indicate significant effects (95% confidence intervals in brackets).
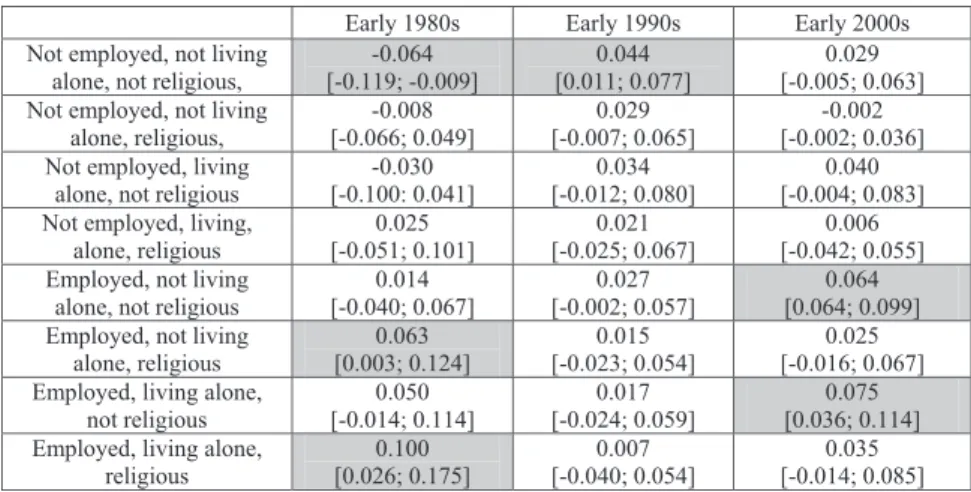
Table 1d: Predicted values (based on Table A1): Effect of gender on left vote
Early 1980s Early 1990s Early 2000s Not employed, not living
alone, not religious, -0.064
[-0.119; -0.009] 0.044
[0.011; 0.077] 0.029 [-0.005; 0.063]
Not employed, not living
alone, religious, -0.008
[-0.066; 0.049] 0.029
[-0.007; 0.065] -0.002 [-0.002; 0.036]
Not employed, living
alone, not religious -0.030
[-0.100: 0.041] 0.034
[-0.012; 0.080] 0.040 [-0.004; 0.083]
Not employed, living,
alone, religious 0.025
[-0.051; 0.101] 0.021
[-0.025; 0.067] 0.006 [-0.042; 0.055]
Employed, not living
alone, not religious 0.014
[-0.040; 0.067] 0.027
[-0.002; 0.057] 0.064 [0.064; 0.099]
Employed, not living
alone, religious 0.063
[0.003; 0.124] 0.015
[-0.023; 0.054] 0.025 [-0.016; 0.067]
Employed, living alone,
not religious 0.050
[-0.014; 0.114] 0.017
[-0.024; 0.059] 0.075 [0.036; 0.114]
Employed, living alone,
religious 0.100
[0.026; 0.175] 0.007
[-0.040; 0.054] 0.035 [-0.014; 0.085]
Note: Shaded cells indicate significant effects (95% confidence intervals in brackets).
1d can be summarized as follows: First, religiosity has a strong negative effect on the probability to vote for left or center- left parties (see Table 1a). This effect is significant for both men and woman, and for all three waves. No meaningful differ- ences between the genders can be ob- served.
Second, labor market participation only has a weak effect on left party vote (see Table 1b). Although the coefficient is consistently positive for female respond- ents, only the coefficient for the first wave (early 1980s) is significantly different from zero. No effect of labor market par- ticipation can be observed in the case of male respondents.
Third, living alone (divorced, separat- ed, without partner) has a positive effect on the probability of voting for left and center-left parties (see Table 1c), in par- ticular for female respondents. The coeffi- the appendix for a detailed discussion of
the operationalization.
We are primarily interested in the in- teraction effects between gender on the one hand and religiosity, labor market participation, and marital status on the other hand. The interpretation of interac- tion effects is fundamentally different for non-linear regression models such as log- it models compared to linear regression models. For instance, an insignificant es- timate of the interaction coefficient does not necessarily indicate an insignificant effect; nor does the sign of the coefficient necessarily denote the correct direction of the effect (Ai and Norton 2003). Conse- quently, we predict probabilities based on our regression models for all three waves only varying the variables of interest (see Tables 1a to 1d). The regression models are displayed in Table A1 in the Appendix.
The findings presented in Tables 1a to
cients are positive and significantly differ- ent from zero in the early 1980s and the early 2000s for female respondents and in the early 2000s for male respondents.
Fourth, substantively, religiosity is a more powerful predictor of vote choice than labor market participation and mari- tal status. For instance, religiosity de- creases the probability of left party choice by between 5.9 to 22.2 percentage points (see Table 1a). In contrast, labor market participation changes the probability of left party choice by maximum 5.6 per- centage points (see Table 1b), while mari- tal status changes the probability of left party choice by maximum 5.8 percentage points (see Table 1c).
Finally, when we control for religios- ity, marital status, and labor market par- ticipation, gender has only a weak effect on left party choice (see Table 1d). Out of eight possible combinations of our dum- my variables (2^3) in the three waves of the World Value Survey, we find signifi- cant effects of gender in only six cases (out of 24 possible cases). This clearly shows that religiosity, marital status and labor market participation can explain a considerable part of the observed gender vote gap.
In sum, we find some evidence in favor of all three secular trends identi- fied above. Respondents living alone are more likely to vote for left and center-left parties, while religious respondents are less likely to do so. With regard to la- bor market participation, the evidence is more mixed. Overall, religiosity is clearly the most powerful predictor of left party choice and has a strong and independent effect on vote choice.
In a second step, we now turn to the detailed analysis of our four “prototypi- cal” cases. Above, we argued that we should be able to observe profound cross- national differences because of marked differences in the strength of the confes- sional cleavage (see Figure 1) and differ- ent employment opportunities for female labor market participants. Using Euroba- rometer surveys we now follow the de- velopments in these four countries over four decades. We look at the left-right self-placement, a variable which in the Eurobarometer dataset runs from 1 to 10.
We have recoded it into one variable cap- turing whether respondents have placed themselves in the interval 1 to 3 (left) or not. We then look at the covariates for a left self-placement controlling for religi- osity, labor market participation, marital status, age, income, and education. Data availability forces us to drop some Euro- barometer surveys from our dataset. Most importantly, only one Eurobarometer sur- vey in the first decade of the 21st century contains all variables needed to estimate these regression models. As a result, the last decade refers to EB 73.1 (2010) only.
Figure 5 (p. 24) shows the effect of controlling for religiosity on the coeffi- cient of the variable “gender”. It displays the coefficients with (dark gray) and with- out (light gray) control for religiosity for four countries and four decades. In each country and in each decade, controlling for religiosity decreases (increases) the negative (positive) of gender on left party choice. Thus, in all four countries and in all four decades, religiosity contributes to the old gender vote gap (or inhibits the new gender vote gap from becoming vis-
Figure 5: Effect of gender on left self-placement in four decades, with control for religiosity (dark gray bars) and without control for religiosity (light gray bars)
West Germany Italy
Denmark Great Britain
Note: Logistic regressions with the dependent variable left self-placement. The figures show the coefficient of the variable gender. The following control variables have been used: age, education, and income (socio-economic level in the model using data from 2010). Dark gray bars display the coefficient in models controlling for religiosity (measured with church attendance, ranging from 1 (never) to 5 (several times a week)), light gray bars display the coefficient in models not controlling for religiosity. Source: Eurobarometer trendfile and EB73.1 (2010).
ible). Figure 5 further shows that in Den- mark the new gender vote gap emerged already in the 1980s, while in Italy we are still observing a weak old gender vote gap.
For West Germany, the old gender vote gap virtually disappeared in the 1990s be- fore it reappeared in 2010. We speculate that this is a “Chancellor effect”. Given that Christian Democrat Angela Merkel is the first female Chancellor, it is likely that she is able to attract a large share of the female vote.
In a next step, we estimate logistic regressions of left self-placement on the
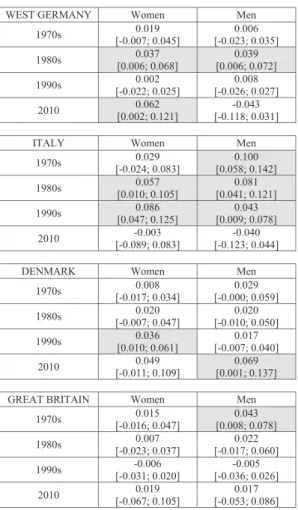
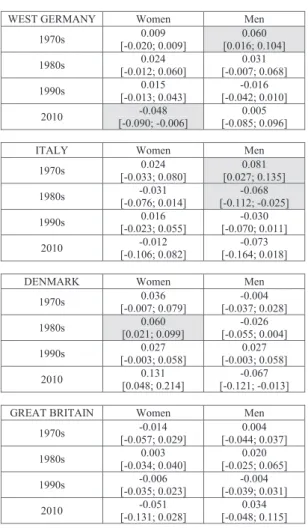
dummy variables for gender, religiosity, labor market participation, marital status, and control variables (see Tables A2 to A5 in the Appendix). As in the case of the World Value Survey data, interaction ef- fects in non-linear regression models are best analyzed using predicted probabili- ties. Table 2a displays the effect of religi- osity, Table 2b the effect of labor market participation, Table 2c the effect of marital status (divorced, separated, without part- ner), and Table 2d displays the effect of gender on left self-placement.
The findings presented in Tables 2a
to 2d (p. 27-31) can be summarized as follows: First, religiosity has a negative and substantially important effect on left self-placement in Italy and West Germany (see Table 2a). The effect of religiosity is weaker in Denmark and Great Britain.
The weak effect of religiosity on left self- placement in Great Britain is consistent with the absence of a strong confessional cleavage (see Figure 1), while the weak effect of religiosity in Denmark is likely to be the result of the low number of reli- gious respondents (see Figure 2). 9
Second, as Table 2b shows, labor market participation is a weaker predic- tor of left self-placement than religiosity.
Among women, labor market participa- tion significantly increases the probability of left self-placement in West Germany in the 1980s and 2010, in Italy in the 1980s and 1990s, and Denmark in the 1990s. In contrast, labor market participation does not affect the probability of left self-place- ment in Great Britain. Among men, labor market participation significantly increas- es the probability of left self-placement in West Germany in the 1980s, in Italy in the 1970s, 1980s, and 1990s, in Denmark in 2010, and in Great Britain in the 1970s.
This analogy between male and female voting behavior has noteworthy implica- tions. Since labor market participation has similar effects on the probability of left self-placement for men and women, it cannot be ruled out that the effect of labor market participation on left self-place-
9 Using the original ordinal scale indicator of religiosity (ranging from 1 to 5) instead of the dummy variable leads to significant effects in Denmark, but not in Great Britain (results are available upon request).
ment is the result of the pro-labor stance of left and center-left parties (expected to affect both genders) rather than their programmatic focus on reconciliation of work and family life and their support for public sector jobs (expected to mostly af- fect women).
Third, marital status has only a weak effect on the probability of left self-place- ment (see Table 2c). Among women, we only observe a significant positive effect of living alone (divorced, separated, with- out partner) in Denmark in the 1980s, and a significant negative effect in West Germany in 2010. Among men, we ob- serve significant positive effects in West Germany in the 1970s and in Italy in the 1970s, and a significant negative effect in Italy in the 1980s. Overall, marital status has a significant positive effect on left self-placement in only 3 of 32 cases. In accordance with our theoretical expecta- tions, marital status has no effect on the probability of left self-placement in Great Britain, which we argue took a “private”
route to high female employment in the service sector.
Finally, when controlling for religios- ity, marital status, and labor market par- ticipation, gender has only a weak effect on left self-placement (see Table 2d). Of the 128 logically possible combinations of the four countries, four decades, and eight combinations of the three dummy variables for religiosity, marital status, and labor market participation we are analyz- ing, the coefficient of the variable “gen- der” turns out to be significantly different from zero in only 18 cases (14.1 percent;
in 12 cases, the coefficient is negative; in six cases, the coefficient is positive). In-
terestingly, it seems as if the regression models for the 1970s fail to fully explain the old gender vote gap (seven significant effects of gender in the 1970s compared to eleven significant effects of gender in the other three periods combined).
We can draw two main conclusions on the basis of the above analysis of Euroba- rometer data. First, the observed gender vote gap, both the “old” and the “new”
one, largely disappears once control vari- ables for religiosity, labor market partici- pation, and marital status are introduced.
Thus, these three factors largely explain the existence of the gender vote gap. Sec- ond, among the three factors, religiosity has by far the largest substantive effect.
Except in Great Britain where there is no confessional cleavage to speak of (see Figure 1) and to a certain extent Denmark (few religious voters), religiosity is a pow- erful predictor of left self-placement. In contrast, labor market participation and marital status are only occasionally sig- nificant predictors of left self-placement.
Table 2a: Predicted probabilities (based on Tables A2 to A5): Effect of church attendance on left self- placement
WEST GERMANY Women Men
1970s -0.022
[-0.045; 0.000] -0.081 [-0.109; -0.053]
1980s -0.063
[-0.093; -0.033] -0.071 [-0.109; -0.032]
1990s -0.049
[-0.073; -0.025] -0.056 [-0.086; -0.027]
2010 0.062
[-0.459; 0.584] -0.180 [-0.368; 0.008]
ITALY Women Men
1970s -0.283
[-0.322; -0.243] -0.263 [-0.303; -0.222]
1980s -0.215
[-0.251; -0.179] -0.270 [-0.306; -0.233]
1990s -0.148
[-0.179; -0.117] -0.192 [-0.225; -0.158]
2010 -0.200
[-0.303; -0.096] -0.159 [-0.437; 0.120]
DENMARK Women Men
1970s -0.026
[-0.088; 0.037] -0.060 [-0.078; 0.066]
1980s -0.023
[-0.072; 0.027] -0.010 [-0.072; 0.053]
1990s -0.028
[-0.076; 0.021] -0.060 [-0.103; -0.017]
2010 -0.163
[-0.205; -0.121] -0.169 [-0.252; -0.085]
GREAT BRITAIN Women Men
1970s -0.017
[-0.051; 0.018] -0.005 [-0.044; 0.034]
1980s 0.007
[-0.028; 0.043] -0.030 [-0.072; 0.011]
1990s -0.004
[-0.032; 0.023] -0.020 [-0.054; 0.015]
2010 -0.159
[-0.256; -0.062] -0.119 [-0.208; -0.029]
Note: Shaded cells indicate significant effects (95% confidence intervals in brackets for the 1970s, 1980s, and 1990s, and 90% confidence intervals for 2010).
Table 2b: Predicted probabilities (based on Tables A2 to A5): Effect of dependent employment on left self-placement
WEST GERMANY Women Men
1970s 0.019
[-0.007; 0.045] 0.006 [-0.023; 0.035]
1980s 0.037
[0.006; 0.068] 0.039 [0.006; 0.072]
1990s 0.002
[-0.022; 0.025] 0.008 [-0.026; 0.027]
2010 0.062
[0.002; 0.121] -0.043 [-0.118; 0.031]
ITALY Women Men
1970s 0.029
[-0.024; 0.083] 0.100 [0.058; 0.142]
1980s 0.057
[0.010; 0.105] 0.081 [0.041; 0.121]
1990s 0.086
[0.047; 0.125] 0.043 [0.009; 0.078]
2010 -0.003
[-0.089; 0.083] -0.040 [-0.123; 0.044]
DENMARK Women Men
1970s 0.008
[-0.017; 0.034] 0.029 [-0.000; 0.059]
1980s 0.020
[-0.007; 0.047] 0.020 [-0.010; 0.050]
1990s 0.036
[0.010; 0.061] 0.017 [-0.007; 0.040]
2010 0.049
[-0.011; 0.109] 0.069 [0.001; 0.137]
GREAT BRITAIN Women Men
1970s 0.015
[-0.016; 0.047] 0.043 [0.008; 0.078]
1980s 0.007
[-0.023; 0.037] 0.022 [-0.017; 0.060]
1990s -0.006
[-0.031; 0.020] -0.005 [-0.036; 0.026]
2010 0.019
[-0.067; 0.105] 0.017 [-0.053; 0.086]
Note: Shaded cells indicate significant effects (95% confidence intervals in brackets for the 1970s, 1980s, and 1990s, and 90% confidence intervals for 2010).
Table 2c: Predicted probabilities (based on Tables A2 to A5): Effect of marital status (divorced, separated, single) on left self-placement
WEST GERMANY Women Men
1970s 0.009
[-0.020; 0.009] 0.060 [0.016; 0.104]
1980s 0.024
[-0.012; 0.060] 0.031 [-0.007; 0.068]
1990s 0.015
[-0.013; 0.043] -0.016 [-0.042; 0.010]
2010 -0.048
[-0.090; -0.006] 0.005 [-0.085; 0.096]
ITALY Women Men
1970s 0.024
[-0.033; 0.080] 0.081 [0.027; 0.135]
1980s -0.031
[-0.076; 0.014] -0.068 [-0.112; -0.025]
1990s 0.016
[-0.023; 0.055] -0.030 [-0.070; 0.011]
2010 -0.012
[-0.106; 0.082] -0.073 [-0.164; 0.018]
DENMARK Women Men
1970s 0.036
[-0.007; 0.079] -0.004 [-0.037; 0.028]
1980s 0.060
[0.021; 0.099] -0.026 [-0.055; 0.004]
1990s 0.027
[-0.003; 0.058] 0.027 [-0.003; 0.058]
2010 0.131
[0.048; 0.214] -0.067 [-0.121; -0.013]
GREAT BRITAIN Women Men
1970s -0.014
[-0.057; 0.029] 0.004 [-0.044; 0.037]
1980s 0.003
[-0.034; 0.040] 0.020 [-0.025; 0.065]
1990s -0.006
[-0.035; 0.023] -0.004 [-0.039; 0.031]
2010 -0.051
[-0.131; 0.028] 0.034 [-0.048; 0.115]
Note: Shaded cells indicate significant effects (95% confidence intervals in brackets for the 1970s, 1980s, and 1990s, and 90% confidence intervals for 2010).
Table 2d: Predicted probabilities (based on Tables A2 to A5): Effect of gender on left self-placement
WEST GERMANY 1970s 1980s 1990s 2010
Not employed, not living
alone, not religious -0.043
[-0.074; -0.012] -0.023
[-0.057; 0.010] -0.019
[-0.047; 0.009] -0.116 [-0.185; -0.048]
Not employed, not living
alone, religious 0.010
[-0.015; 0.035] -0.016
[-0.053; 0.020] -0.012
[-0.045; 0.022] 0.126 [-0.414; 0.667]
Not employed, living
alone, not religious -0.098
[-0.158; -0.039] -0.030
[-0.083; 0.023] 0.015
[-0.026; 0.056] -0.167 [-0.261; -0.074]
Not employed, living,
alone, religious -0.008
[-0.051; 0.036] -0.021
[-0.072; 0.029] 0.011
[-0.030; 0.051] 0.056 [-0.927; 0.440]
Employed, not living
alone, not religious -0.028
[-0.062; 0.007] -0.026
[-0.064; 0.013] -0.018
[-0.045; 0.009] -0.005 [-0.079; 0.068]
Employed, not living
alone, religious 0.023
[-0.010; 0.056] -0.019
[-0.067; 0.029] -0.011
[-0.047; 0.025] 0.229 [-0.496; 0.954]
Employed, living alone,
not religious -0.083
[-0.144; -0.023] -0.033
[-0.084; 0.018] 0.016
[-0.017; 0.048] -0.080 [-0.166; 0.006]
Employed, living alone,
religious 0.071
[0.035; 0.107] -0.025
[-0.087; 0.037] 0.012
[-0.028; 0.051] 0.130 [-0.404; 0.663]
ITALY 1970s 1980s 1990s 2010
Not employed, not living
alone, not religious 0.014
[-0.037; 0.064] -0.056
[-0.105; 0.008] -0.068
[-0.110; -0.026] -0.043 [-0.412; 0.056]
Not employed, not living
alone, religious -0.005
[-0.043; 0.033] -0.002
[-0.035; 0.031] -0.025
[-0.055; 0.005] -0.090 [-0.3729; 0.193]
Not employed, living
alone, not religious -0.049
[-0.132; 0.034] -0.013
[-0.082; 0.056] -0.016
[-0.079; 0.048] 0.023 [-0.119; 0.165]
Not employed, living,
alone, religious -0.040
[-0.098; 0.017] 0.014
[-0.022; 0.051] 0.004
[-0.037; 0.045] -0.054 [-0.268; 0.161]
Employed, not living
alone, not religious -0.065
[-0.133; 0.004] -0.079
[-0.146; -0.012] -0.014
[-0.069; 0.040] -0.003 [-0.102; 0.095]
Employed, not living
alone, religious -0.051
[-0.104; 0.003] -0.013
[-0.064; 0.037] 0.008
[-0.037; 0.052] -0.069 [-0.315; 0.177]
Employed, living alone,
not religious -0.129
[-0.210; -0.049] -0.032
[-0.109; 0.044] 0.044
[-0.024; 0.111] 0.054 [-0.064; 0.172]
Employed, living alone,
religious -0.100
[-0.170; -0.031] 0.010
[-0.038; 0.059] 0.044
[-0.008; 0.097] -0.039 [-0.224; 0.146]
DENMARK 1970s 1980s 1990s 2010 Not employed, not living
alone, not religious -0.008
[-0.036; 0.020] -0.005
[-0.034; 0.024] 0.016
[-0.008; 0.040] -0.012 [-0.074; 0.050]
Not employed, not living
alone, religious -0.025
[-0.107; 0.057] -0.016
[-0.079; 0.046] 0.043
[-0.011; 0.097] -0.006 [-0.062; 0.049]
Not employed, living
alone, not religious 0.029
[-0.021; 0.079] 0.073
[0.025; 0.120] 0.016
[-0.023; 0.055] 0.166 [0.070; 0.262]
Not employed, living,
alone, religious 0.002
[-0.100; 0.104] 0.048
[-0.029; 0.125] 0.051
[-0.017; 0.119] -0.004 [-0.035; 0.028]
Employed, not living
alone, not religious -0.029
[-0.055; -0.003] -0.005
[-0.030; 0.019] 0.035
[0.013; 0.057] -0.032 [-0.104; 0.040]
Employed, not living
alone, religious -0.047
[-0.150; 0.056] -0.019
[-0.096; 0.058] 0.064
[-0.004; 0.131] -0.010 [-0.100; 0.079]
Employed, living alone,
not religious 0.013
[-0.040; 0.066] 0.087
[0.040; 0.135] 0.037
[-0.005; 0.079] 0.198 [0.094; 0.302]
Employed, living alone,
religious -0.016
[-0.140; 0.108] 0.058
[-0.037; 0.153] 0.075
[-0.009; 0.159] -0.006 [-0.056; 0.045]


![Table 1a: Predicted values (based on Table A1): Effect of church attendance on left vote Women Men Early 1980s -0.059 [-0.102; -0.015] -0.115 [-0.162; -0.067] Early 1990s -0.222 [-0.250; -0.194] -0.207 [-0.237; -0.177] Early 2000s -0.175 [-0.](https://thumb-eu.123doks.com/thumbv2/1library_info/4963992.1641267/21.629.54.393.539.634/table-predicted-values-table-effect-church-attendance-women.webp)