from Sustainable Utilization of herbaceous Biomass
(BESUB)
Biochemikalien und Energie aus der nachhaltigen Verwertung
pflanzlicher Biomasse
Bornimer Agrartechnische Berichte
Heft 42
Potsdam-Bornim 2005
Biochemicals and Energy from Sustainable Utilization
of herbaceous Biomass (BESUB)
Biochemikalien und Energie aus der nachhaltigen Verwertung pflanzlicher
Biomasse
Bornimer Agrartechnische Berichte
Heft 42
Potsdam-Bornim 2005
Max-Eyth-Allee 100 14469 Potsdam
0331 5699-0
Fax 0331 5699-849
E-Mail atb@atb-potsdam.de Internet www.atb-potsdam.de
Bearbeiter des ATB:
Dr.-Ing. Joachim Venus
Dr. sc. nat. Dr. rer. nat. Klaus Richter Dr.-Ing. Dr. sc. agr. Winfried Reimann Dipl.-Ing. (FH) Christine Mehlmann Dipl.-Ing. (FH) Rohland Schneider
Projekt:
General Project Information www.cordis.lu/eesd/src/projects.htm
CRAFT Contract: ENK-CT-2002-30014 CRAFT Project No: CRAF-1999-70986
Projektpartner:
SME:
- IBC - Icelandic Biomass Company, Hafnafjordur (ISL) - Beltra Forestry Ltd., New Port (IRL)
- tetra Ingenieure GmbH, Neuruppin RTD:
- RALA Agric. Res. Inst., Reykjavik (ISL) - Universität Heidelberg
- Biorefinery.de, Potsdam - BIOPOS, Teltow
- Institut für Agrartechnik Bornim (ATB)
Typographische Gestaltung:
Joachim Venus Regina Hager Oktober 2005
Herausgegeben vom Leibniz-Institut für Agrartechnik Potsdam-Bornim e.V. (ATB) mit Unterstützung der Europäischen Kommission.
Für den Inhalt der Beiträge sind die Autoren verantwortlich.
Eine Weiterveröffentlichung von Teilen ist unter Quellenangabe und mit Zustimmung des Leibniz-Instituts für Agrartechnik Potsdam-Bornim e.V. möglich.
ISSN 0947-7314
© Leibniz-Institut für Agrartechnik Potsdam-Bornim e.V., Potsdam-Bornim 2005
Content
Project summary... 5
1 Introduction...8
2 Strain selection and strain characterization ...10
2.1 Objectives ...10
2.2 Screening program ...10
2.3 Preliminary assessment of fermentation performance ...12
2.4 Phenotypic strain optimisation...13
2.4.1 Methods ...13
2.4.1.1 Experimental design ...14
2.4.1.2 Conditions of cultivation...15
2.4.1.3 Test description ...15
2.4.1.4 Evaluation of experiments ...15
2.4.2 Results ...20
2.4.2.1 Characteristic quantities related directly from the measured data ...20
2.4.2.2 Estimate of kinetic values for product formation and cell growth from experimental data by model approximation ...21
2.4.2.3 Estimation of the optimal parameters for lactic acid production and cell growth by means of non-linear regression ...23
2.4.2.4 Estimate of the maximum values of the specific performance rates of the strain L. paracasei 168 by means of non-linear regression...27
2.4.3 Discussion of results and conclusions ...30
3 Preparation of glucose from barley grains ...36
3.1 Grain milling ...36
3.2 Enzymatic hydrolysis of barley coarse meal ...37
3.2.1 Starch liquefying ...37
3.2.2 Starch saccharification...41
3.3 Mass balance of starch hydrolysis ...46
4 Utilization of green biomass as nitrogen source ...47
4.1 Preparation of green juice from wet lucerne by pressing ...47
4.2 Chemical analysis of pressing products...48
5 Batch fermentation in laboratory and bench scale ... 51
5.1 Raw materials for lactic acid fermentation... 51
5.2 Batch cultivation of a lactic acid bacterium on barley hydrolysate ... 52
5.3 Batch cultivation of a lactic acid bacterium on lucerne green juice... 54
5.4 Lactic acid production in bench scale... 57
6 Continuous lactic acid fermentation process ... 58
6.1 Operation in chemostat mode... 58
6.2 Cell recycle bioreactor... 59
6.3 Conclusions... 61
7 Down-stream processing of lactic acid... 62
7.1 Methods... 62
7.1.1 Membrane filtration ... 62
7.1.2 Removal of divalent cations... 63
7.1.3 Electrodialysis ... 64
7.1.4 Mono-polar electrodialysis ... 65
7.1.5 Bipolar electrodialysis ... 65
7.1.6 Ion exchange... 66
7.1.7 Analytical Methods ... 66
7.2 Results and Discussion... 67
7.2.1 Ultrafiltration ... 67
7.2.2 Removal of multivalent metals... 68
7.2.3 Conventional electrodialysis (EDM)... 69
7.2.4 Bipolar electrodialysis (EDB) ... 70
7.2.4.1 Two-compartment bipolar electrodialysis (EDB2C) ... 71
7.2.4.2 Three-compartment bipolar electrodialysis (EDB3C)... 72
7.2.5 Final purification stages. ... 72
7.3 Conclusions... 74
8 References... 75
9 List of Figures... 78
10 List of Tables ... 81
Project summary
The explosive growth of industrial societies in the last century was achieved through scientific and technological development, and easy access to cheap energy like fossil fuels. Social and environmental imbalances resulted and employment opportunities concentrated to urban centres bringing about high levels of pollution concentration, fer- tiliser and pesticide contamination and global warming. Sustainable development, which in political and public terms primarily means careful resource management and greater focus on renewable energy developments, has become the catchphrase at the start of the 21st century. To meet this challenge the project partners, which are involved in de- signing bio-refineries using biomass such as grains, grasses, legumes and straw for feedstock, have decided to engage in the production of the following industrial bio- products:
- Transportation fuels from biomass: e.g. ethanol.
- High value bio-chemicals and materials from biomass-based raw materials e.g.
sparteine derivatives, ethyl-lactate.
- Animal feed based on starchy and cellulosic feedstock.
- Carbon dioxide for the preservation of foods.
- Biogas production for use in electric utilities, industry and for private use.
Project objectives
- Ascertain the availability of suitable biomass, it’s cost, quality and yields
- Develop methodology and processes for extracting high value bio-chemicals from green biomass such as sparteine and it’s derivatives
- Develop a new continuous fermentation process for lactic acid and a new ethyl- lactate production process
- Select optimal economical processes and products that contribute to the biosphere and assess production in rural communities
Project structure
The project partnership is composed of partners from three countries SME:
- IBC - Icelandic Biomass Company, Hafnafjordur (ISL)
- Beltra Forestry Ltd., New Port (IRL)
- tetra Ingenieure GmbH, Neuruppin
RTD:
- RALA Agric. Res. Inst., Reykjavik (ISL)
- Universität Heidelberg
- Biorefinery.de, Potsdam
- BIOPOS, Teltow
- Institut für Agrartechnik Bornim (ATB) and of different of activities:
WORK PACKAGES SHORT DESCRIPTION WORK PACKAGE WP1: Biomass procurement
WORK PACKAGE WP2: Separation of sparteine and development of derivatives
WORK PACKAGE WP3: Fermentation and Esterification
WORK PACKAGE WP4: Further use of fibre and liquid residue after extraction, fermentation and protein recovery WORK PACKAGE WP5: Economic assessment
WORK PACKAGE WP6: Project evaluation and proposal for further steps
WORK PACKAGE WP7: Project Co-ordination and dissemination
Bio-refinery
A bio-refinery is a processing plant in which biomass feedstock is converted into a spec- trum of valuable products with zero or near zero CO2 emission in its overall concept.
Bio-refineries are based upon a similar concept as petrochemical refinery technologies, but are much more complex and offer significantly greater potential because the quan- tity of renewable biomass is enormous. Moreover, they offer the possibility of being non- polluting industries in terms of biodegradability and zero emission of harmful wastes and greenhouse gases. Their development will result in keys for the integrated production of chemicals, animal feed and fuels as outlined in Figure 1.
The bio-refineries proposed will provide high-technology jobs in rural environment, as well income to farmers from the production of biomass. In general energy gains will ex- ceed energy use. The processes developed will be implemented in the near future by the participating SME´s involved in this project. It will be licensed to qualified parties and the products sold mainly through professional vendors.
The BESUB Craft-project considered and projected a number of bio-refinery options using herbaceous biomass. Two main initial implementation approaches remain feasi- ble, one based on the use of rye grain (ATB-tetra) for the production of ethyl-lactate, the other based on the use of barley/lupine to produce ethanol and by-products, such as ethyl lactate and animal feed.
Fields
Harvesting
Biorefinery
Fuels Ethanol Chemicals
Intermediate Materials
Energy
Consumer Product Companies Consumer
Stores Composting
Distribution
Sun
Households
Farming
CO2 Industrial
Industrial Biorefinery ProductBiorefinery ProductCycleCycle
Figure 1: Sustainable Biorefinery Products Cycle (without foods)
Project approach
Being a pan-European project, a specific goal of this project has been to focus on widely available herbaceous feedstock. The Alaska lupine has been used for land reclamation purposes with very good results. Large expanses of barren land, which had reached quite serious levels of land erosion, have been reclaimed.
The most relevant data needed for commercial harvesting of these plants for biomass pur- poses such as sustainability of growing, feasibility of harvesting, suitability etc. has been investigated. Special focus was directed towards the lupine, which contains the alkaloid sparteine, which has potential uses as a natural insecticide. The feasibility of using the types of biomass available has been assessed based on present knowledge with empha- sis on cost in term of kg DM (Dry Matter). The growing of Lupinus Nootkatenisis has a good potential on the extensive sandy areas on the southern coast of Iceland.
The aim of ATB’s research is to create a new lactic acid production process using starchy crops (grains, potatoes) and green plant materials (lucerne, lupine) as raw materials. In collaboration with the Potsdam Research Group (Biopos), the process will be adapted to an esterification process for producing ethyl lactate. Use of by-products and wastes for energy generation will be integrated into the whole process. Mass and energy balances, cost estimation and recommendations for technological design of the integrated process will be given.
1 Introduction
In view of the disuse of agricultural lands in Europe and other parts of the world, there is an ever increasing demand for alternative use options for agricultural products in the non- food sector. Renewable raw materials can be utilized directly, e.g. as energy carriers, as packaging materials, as fibres, for the production of colouring agents or as lubricants.
However, they can also be converted biotechnologically by enzymes and microorganisms, giving us access to a multitude of new, biocompatible products and possible uses (MONT- GOMERY 2004). Often the ecnomy of bioprocesses is still the problem because in the case of bulk products the price is affected mainly by raw material costs (WILLKE & VORLOP
2004).
Biotechnological production of lactic acid as an example of these “building blocks” is car- ried out in technical reactors by using a suitable strain. Lactic acid, its salts and esters have a wide range of potential uses and are extensively used in diverse fields of food, in- dustrial, cosmetic, pharmaceutical industries and agriculture (DATTA et al. 1995, KAMM et al. 1997 & 2000, DUDA &PENCZEK 2003). Besides the wide group of Lactobacilli (ANTONIO
et al. 1996, HOFVENDAHL & HAHN-HÄGERDAHL 1997, BERRY et al. 1999, FU & MATHEWS
1999, KWON et al. 2001) other bacteria, e.g. Bacillus (PAYOT et al. 1999, DANNER et al.
2002, PATEL et al. 2004), and filamentous fungi (MARTAK et al. 2003), especially Rhizopus oryzae (YIN et al. 1997, BAI et al. 2003) were also used as production strains. The lactic acid bacteria convert easily monosaccharids like glucose or fructose into lactic acid, cell mass and byproducts depending on the species. This microbial synthesis is a multi-step reaction, the partial reactions of which are catalyzed by enzymes. The overall reaction equation can be written as
C6H12O6 cells,nutrients(e.g.N,P,...)→
1.92⋅CH3-CH(OH)-COOH+
0.27⋅C0,8H2,8O0,8N0,4+...
In this process, the cells grow and multiply forming biomass. Energy necessary for growth and maintenance is obtained by producing lactic acid. Lactic acid formation and cell growth are closely coupled in lactic acid fermentation. The microorganisms have a need for a carbon source, a source of nitrogen and nutrients, and a phosphorus source. The latter is available when inorganic phosphate salts are added to the medium. The demand for nitrogen can’t be covered by inorganic salts only. Lactic acid bacteria need also a se- ries of nitrogen-containig nutrients (amino acids, peptides etc.) for growth and therefore, the medium have to be supplied by complex protein hydrolyzates (yeast extract, peptone etc.). The protein extracts mentioned are very expensive and their substitution by low- priced nutrient extracts is necessary when a large-scale production is planned. A useful combination of green biomass processing for the production of fodder pellets and the utili-
zation of the pressed juice for the lactic acid fermentation was described by (ANDERSEN &
KIEL 2000). The use of date juice together with different nitrogen sources as a substrate for lactic acid production was investigated by (NANCIB et al. 2001).
In recent years, new lactic acid production processes consisting of the operations of en- zymatic hydrolysis of starch (GROHMANN &BOTHAST 1997, ANURADHA et al. 1999; MIURA et al. 2003; FUKUSHIMA et al. 2004) and cellulose (MELZOCH et al. 1997, MOLDES 1999, WOICIECHOWSKI 1999, PARK et al. 2004, WEE et al. 2004), fermentation process (RICHTER
&BEYER 1998, PAYOT et al. 1999, KWON et al. 2001, BULUT et al. 2004, BUSTOS et al. 2004, TANIGUCHI et al. 2004), lactic acid separation and product purification (SIEBOLD et al. 1995, FRIELING &SCHÜGERL 1999, CAO et al. 2002, BAILLY 2002, HUANG et al. 2004, BOUCHOUX
et al. 2005) were developed.
The research is advancing focused on the use of renewable agricultural raw materials as carbon substrates as well as protein sources. In this context, there is an strong interest to reduce costs for raw materials and to use renewable resources like grain and green bio- mass respectively. In this research, the objective was to test the suitability of grains (bar- ley, rye) and green masses (lupine, lucerne) for use as raw materials in lactic acid fermen- tation.
Due to the importance of sepration and purification of the product the investigations concentrate on the down-stream processes of lactic acid in the form of sodium lactate made by fermentation of the renewable raw material barley. Conventional processes are based on precipitation steps that generate large amounts of chemical effluents (BAI- LEY & OLLIS 1986). Consequently the environmental impact and the operating costs of traditional precipitation processes can be reduced by using alternative technologies, such as two-stage electrodialysis (GLASSNER &DATTA 1990, LEE et al. 1998). In the first step of desalting electrodialysis, sodium lactate is recovered, purified and concentrated.
In the water-splitting or acidification step, lactic acid is generated from sodium lactate, and sodium hydroxide is recovered and purified (KIM &MOON 2001). Membrane opera- tions, for instance microfiltration, nanofiltration, and reverse osmosis, as well as mono- polar (EDM) and bipolar (EDB) electrodialysis, are increasingly being used as an alter- native to conventional methods such as filtering, separating, crystallizing, vaporization, drying, and ion exchange (SIRKA et al. 1999). The down-stream processes were per- formed as reported by (BAILLY 2002) for the production of fermented organic acids, based on membrane processes and a final purification stage using ion exchange resins.
The efficiency of each down stream process is stated.
2 Strain selection and strain characterization
One of the objectives stated in the project BESUB is a new process for producing lactic acid, which can be used in a biorefinery. In this context, there is a need to find a high- productivity bacterium strain. This strain will be the basis for developing a batch and continuous fermentation technology respectively.
2.1 Objectives
The aim of this research was to identify a lactic acid bacteria strain, which is suitable for producing lactic acid from barley in a technical facility. This strain should be character- ized by
- a high lactic acid producing capacity,
- a high selectivity for producing pure L(+)-lactic acid and - a highly stability.
It should also not be patented for use by other individuals/ companies.
To solve this problem, the following tests had to be carried out:
- screening in shake flask experiments and selection of strains for further testing
- preliminary assessment of the fermentation performance of the strains chosen in discontinuous fermenter experiments and selection of the best strain
- phenotypic optimisation of the selected strain
- determining the kinetic data of cell growth and product formation.
2.2 Screening program
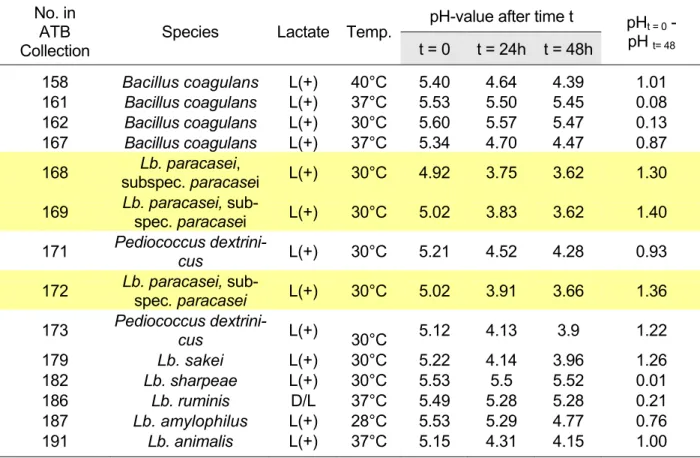
A series of strains of the species Bacillus, Lactobacillus and Pediococcus, which had not previously been used in any fermentation process, were purchased from the Ger- man Collection of Microorganisms and Cell Cultures Braunschweig and partly chosen from the strain collection of the ATB Potsdam, respectively. The acidifying power of the microorganisms selected was firstly tested in shaking flask experiments. To achieve this, the bacteria were cultivated discontinuously in a special medium without pH control and the pH value was measured after 24 h and 48 h (Figure 2). According to the ther- mal growth behaviour of the microorganisms used, the temperature for this screening step varied between 28°C and 40°C.
The pH value decreases during the fermentation due to the formation of lactic acid.
Therefore, the decrease of the pH value can be considered as a measure of the lactic acid production. The deeper the pH value drops during the fermentation the more the amount of lactic acid in the medium increases. Significant decreasing of pH below a value of 4.0 gives also evidence for the stability of the strain tested.
3 4 5 6 7
0 10 20 30 40 50
time [hours]
pH value pHt=0– pHt=48
Figure 2: Decrease of pH during discontinuous fermentation
Selected results of this research are shown in Table 1. The best results (absolute de- crease of ∆pH ≥ 1.3 and minimum pH attained < 3.8) were obtained with the three strains Lactobacillus paracasei 168, Lactobacillus paracasei 169 and Lactobacillus paracasei 172. All of the other strains tested were unable to decrease the pH below a value of 3.8. Therefore these three strains were chosen for subsequent optimisation.
Table 1: Results of the strain screening by measuring the decrease of pH in standard medium MRS
pH-value after time t No. in
ATB Collection
Species Lactate Temp.
t = 0 t = 24h t = 48h
pHt = 0 - pH t= 48
158 Bacillus coagulans L(+) 40°C 5.40 4.64 4.39 1.01
161 Bacillus coagulans L(+) 37°C 5.53 5.50 5.45 0.08
162 Bacillus coagulans L(+) 30°C 5.60 5.57 5.47 0.13
167 Bacillus coagulans L(+) 37°C 5.34 4.70 4.47 0.87
168 Lb. paracasei,
subspec. paracasei L(+) 30°C 4.92 3.75 3.62 1.30 169 Lb. paracasei, sub-
spec. paracasei L(+) 30°C 5.02 3.83 3.62 1.40 171 Pediococcus dextrini-
cus L(+) 30°C 5.21 4.52 4.28 0.93
172 Lb. paracasei, sub-
spec. paracasei L(+) 30°C 5.02 3.91 3.66 1.36 173 Pediococcus dextrini-
cus L(+)
30°C 5.12 4.13 3.9 1.22
179 Lb. sakei L(+) 30°C 5.22 4.14 3.96 1.26
182 Lb. sharpeae L(+) 30°C 5.53 5.5 5.52 0.01
186 Lb. ruminis D/L 37°C 5.49 5.28 5.28 0.21
187 Lb. amylophilus L(+) 28°C 5.53 5.29 4.77 0.76
191 Lb. animalis L(+) 37°C 5.15 4.31 4.15 1.00
2.3 Preliminary assessment of fermentation performance
This investigation was carried out in a laboratory stirred tank (vessel volume 3 litres) bioreactor BIOSTAT MD (B. Braun Biotech International GmbH, Germany) equipped with a digital control unit DCU. The pH value was controlled at the respective set point, using NaOH as a correction agent. The medium used was a modified model medium (MRS) containing glucose as carbon source (40 g · L-1 and 100 g · L-1) and meat extract and peptone (10 g · L-1) as nitrogen sources. The time course of lactic acid production was observed. The results are given in Figure 3 - 5.
0 20 40 60 80 100
0 5 10 15 20 25 30
time [hours]
Lactic acid [g/L]
100 g/L Glucose S 40 g/L Glucose
Figure 3: Time course of lactic acid formation in discontinuous cultivation of the strain Lactoba- cillus paracasei 168 on model media containing glucose in quantities of 40 g · L-1 and 100 g · L-1
0 20 40 60 80 100
0 10 20 30 40 50
time [hours]
Lactic acid [g/L]
100 g/L Glucose S 40 g/L Glucose
Figure 4: Time course of lactic acid formation in discontinuous cultivation of the strain Lactoba- cillus paracasei 169 on model media containing glucose in quantities of 40 g · L-1 and 100 g · L-1
0 20 40 60 80 100
0 10 20 30 40 50
time [hours]
Lactic acid [g/L]
100 g/L Glucose S 40 g/L Glucose
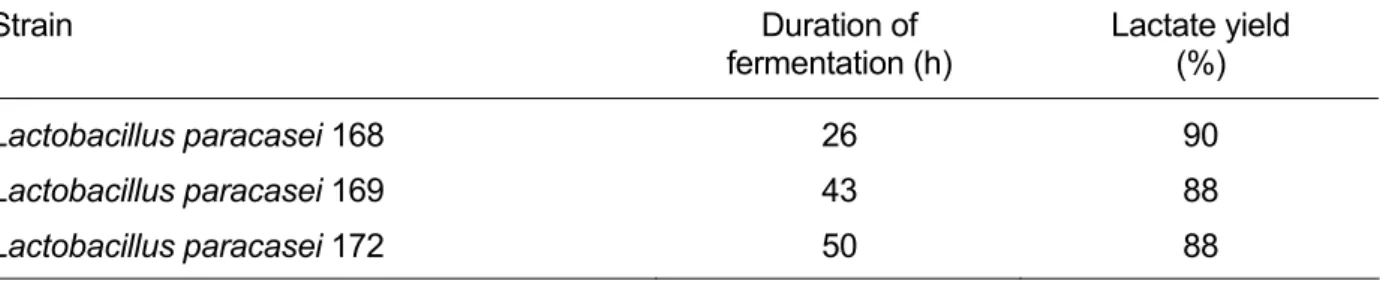
Figure 5: Time course of lactic acid formation in discontinuous cultivation of the strain Lactoba- cillus paracasei 172 on model media containing glucose in quantities of 40 g · L-1 and 100 g · L-1 The three strains are able to use the substrate completely when the glucose concentration is at 100 g · L-1. The lactic acid yields reach 88 % to 90 % in this case. Comparing the curves of the three strains, it is noticeable that the strain L. paracasei 168 shows the great- est slope in lactic acid accumulation. Therefore, it can be concluded, that this strain is the most efficient one. This is also made clear by the fact that the cultivation of the strain L.
paracasei 168 on a medium initially containing 100 g · L-1 of glucose is terminated in a much shorter time than is possible when the other two strains are used (Table 2).
Table 2: Duration of batch cultivation observed with 3 selected strains on a medium with an initial glucose content of 100 g · L-1
Strain Duration of
fermentation (h)
Lactate yield (%)
Lactobacillus paracasei 168 26 90
Lactobacillus paracasei 169 43 88
Lactobacillus paracasei 172 50 88
2.4 Phenotypic strain optimisation
The strain Lactobacillus paracasei 168 was selected to be the most appropriate by means of the methods described above. In this section, a methodology is shown for op- timising the environmental parameters of temperature and pH value with respect to both the lactic acid production and cell growth of this strain.
2.4.1 Methods
The methods used were an experimental design-aided trial methodology, an approxima- tion of model functions and a surface response method of parameter optimisation.
2.4.1.1 Experimental design
The optimum values of some process parameters for cell growth and lactic acid production were determined in discontinuous fermentation experiments with pH control in a 5-L- fermentor using a model MRS medium and an extended 23 factorial experimental design.
Temperature and pH value, each set up at three and four levels respectively, were the independent variables and the specific growth rate, specific lactate formation rate, the du- ration of fermentation and the lactic acid yield were the dependent variables:
Independent variables:
Temperature (T): 28°C 33°C 38°C 40.5°C -
pH value (pH): 5.5 6.0 6.5 - 7.0
trial code of variables -1 0 +1 +1.5 +2
The experimental scheme containing 15 trials is shown in Table 3 and Figure 6.
Each point in the three-dimensional scheme (Figure 5) represents a trial with one of the parameter combinations defined in Table 3.
Table 3: Experimental scheme of phenotypic strain optimisation
T pH
+1.5 -1 +1.5 0 +1.5 +1
+ 1 -1
+ 1 0
+1 +1 +1 +2 0 -1 0 0 0 +1 0 +2 -1 -1 -1 0 -1 +1 -1 +2
0 +1
-1 0 +1
Temperature
pH-value +1,5
+2
Fig. 6: Three-dimensional diagram of experiments
2.4.1.2 Conditions of cultivation
Batch cultivations were carried out in a stirred tank reactor under the condition of both temperature and pH value control (Figure 7).
The medium used was a modified MRS (created by de Man, Rogosa and Sharpe, 1960) medium. It contained 120 g of glucose, 5 g of yeast extract, 10 g of peptone, 10 g of meat extract, 1 g of Tween 80. 5 g of sodium acetate, 2 g of ammonium citrate, 2 g of K2HPO4, 0.2 g of MgSO4 · 7H2O, 0.05 g of MnSO4 · H2O and 1 g of NH4Cl per litre. The volume of inoculum amounted to 180 mL in each of the experiments carried out.
Figure 7: BIOSTAT MD (B. Braun Biotech International GmbH, Germany) equipped with a digital control unit DCU
2.4.1.3 Test description
Experiments were started after the process parameters (temperature, pH value) were fixed at their desired level and the inoculum was added. Samples were taken from the medium during the experiments at time intervals of 2 hours in order to determine the actual con- centrations of glucose, lactic acid and cell mass in the fermentation broth. The trials were terminated when the glucose was exhausted.
2.4.1.4 Evaluation of experiments
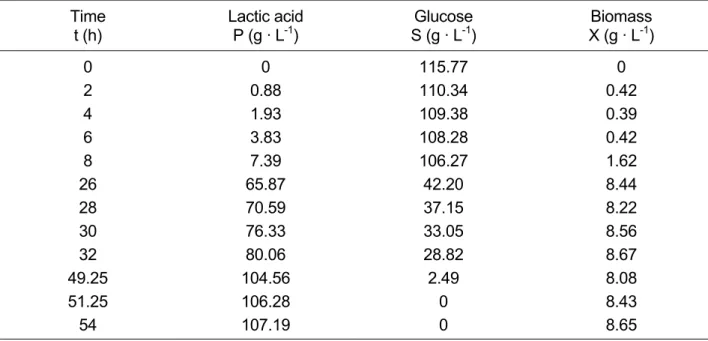
The kinetic data needed for characterizing a strain can be derived from the concentrations of reactants estimated during the fermentation at different times. In Table 4 the measured values of lactic acid, glucose and biomass (the latter as dry matter) are listed for a batch culture of Lactobacillus paracasei 168 on a 120 g · L-1 glucose medium.
Table 4: Concentrations of reactants in batch fermentation with the strain L. paracasei 168 (initial glucose concentration: 120 g · L-1, T: 28°C; pH: 5.5)
Time t (h)
Lactic acid P (g · L-1)
Glucose S (g · L-1)
Biomass X (g · L-1)
0 0 115.77 0
2 0.88 110.34 0.42
4 1.93 109.38 0.39
6 3.83 108.28 0.42
8 7.39 106.27 1.62
26 65.87 42.20 8.44
28 70.59 37.15 8.22
30 76.33 33.05 8.56
32 80.06 28.82 8.67
49.25 104.56 2.49 8.08
51.25 106.28 0 8.43
54 107.19 0 8.65
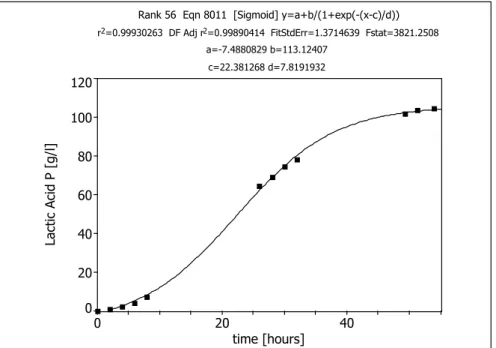
Initially, time functions describing exactly the change of the concentrations of glucose, lactic acid and biomass are determined by model approximation. In these cases, the sigmoidal equation (equation 1) was found to be suitable for use as a target function.
This procedure could be easily achieved by means of the computer programme Ta- bleCurve 2D (Jandel Scientific Software).
)) d / ) c t ( exp(
( a b S
, X ,
P(t) (t (t)
−
− + +
= 1 (1)
The factors a, b, c, and d are constants which are calculated by the computer by itera- tion. The time functions obtained on the way described are presented in Figure 8 - 10.
The accuracy data displayed at the top of each diagram supports the excellent model approximation attained using the sigmoidal equation.
Rank 56 Eqn 8011 [Sigmoid] y=a+b/(1+exp(-(x-c)/d)) r2=0.99930263 DF Adj r2=0.99890414 FitStdErr=1.3714639 Fstat=3821.2508
a=-7.4880829 b=113.12407 c=22.381268 d=7.8191932
0 20 40
time [hours]
0 20 40 60 80 100 120
Lactic Acid P [g/l]
Figure 8: Time function of lactic acid concentration in a batch cultivation of L. paracasei 168 (Initial glucose concentration 110 g · L-1; Temp: 28°C; pH: 5.5)
Rank 74 Eqn 8011 [Sigmoid] y=a+b/(1+exp(-(x-c)/d)) r2=0.99859441 DF Adj r2=0.99779121 FitStdErr=2.0511482 Fstat=1894.518
a=-1.7365255 b=118.87832 c=22.44378 d=-7.7748556
0 20 40
time [hours]
0 20 40 60 80 100 120
Glucose S [g/l]
Figure 9: Time function of glucose concentration in a batch cultivation of L. paracasei 168 (Ini- tial glucose concentration 110 g · L-1; Temp: 28°C; pH: 5.5)
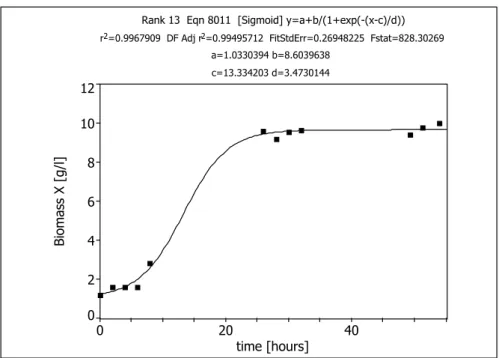
Rank 13 Eqn 8011 [Sigmoid] y=a+b/(1+exp(-(x-c)/d)) r2=0.9967909 DF Adj r2=0.99495712 FitStdErr=0.26948225 Fstat=828.30269
a=1.0330394 b=8.6039638 c=13.334203 d=3.4730144
0 20 40
time [hours]
0 2 4 6 8 10 12
Biomass X [g/l]
Figure 10: Time function of biomass concentration in a batch cultivation of L. paracasei 168 (Initial glucose concentration 110 g · L-1; Temp: 28°C; pH: 5.5)
The second stage is to form the first derivation of equation (1):
(
1 exp( (t c)/d))
2c)/d) (t
( d exp b dt
;dX dt
; dS dt dP
−
− +
−
−
= ⋅
− (2)
and obtain through this the time course of the volumetric production rates and the glu- cose degradation rate. All of these curves run through maxima representing the maxi- mal productivities of growth, lactate production or the maximal glucose degradation rates, which may be achieved by the strain tested under the conditions of cultivation tested (Figure 11).
0 1 2 3 4 5
0 10 20 30 40 50
time [h]
-dS/dt, dP/dt
0,0 0,2 0,4 0,6 0,8 1,0
dX/dt
SLactic acid productivity dP/dt
Biomass productivity dX/dt Glucose degradation rate –dS/dt
] h L g
[ ⋅ −1⋅ −1 ] h L g
[ ⋅ −1⋅ −1 ] h L g
[ ⋅ −1⋅ −1
0 1 2 3 4 5
0 10 20 30 40 50
time [h]
-dS/dt, dP/dt
0,0 0,2 0,4 0,6 0,8 1,0
dX/dt
S
ty productivi acid
Lactic dP/dt [g⋅L−1⋅h−1] ] h L g [ ⋅ −1⋅ −1 ty
productivi
Biomass dX/dt
rate radation deg e cos
Glu −dS/dt [g⋅L−1⋅h−1]
0 1 2 3 4 5
0 10 20 30 40 50
time [h]
-dS/dt, dP/dt
0,0 0,2 0,4 0,6 0,8 1,0
dX/dt
SLactic acid productivity dP/dt
Biomass productivity dX/dt Glucose degradation rate –dS/dt
] h L g
[ ⋅ −1⋅ −1 ] h L g
[ ⋅ −1⋅ −1 ] h L g
[ ⋅ −1⋅ −1
0 1 2 3 4 5
0 10 20 30 40 50
time [h]
-dS/dt, dP/dt
0,0 0,2 0,4 0,6 0,8 1,0
dX/dt
S
ty productivi acid
Lactic dP/dt [g⋅L−1⋅h−1] ] h L g [ ⋅ −1⋅ −1 ty
productivi
Biomass dX/dt
rate radation deg e cos
Glu −dS/dt [g⋅L−1⋅h−1]
Figure 11: Time functions of lactic acid and biomass productivity as well as volumetric glucose degradation rate in a batch cultivation of L. paracasei 168 (Initial glucose concentration 110 g · L-1; Temp: 28°C; pH: 5.5)
Thirdly, we can obtain the time course function of the specific capacity of a strain by dividing equation (2) by the time course function of cell concentration. When using equation (2) for lactic acid production and cell mass formation, the time function of the specific lactate formation rate (equation 3) and the specific growth rate (equation 4), is obtained. In an analogous way we obtain the time function of the specific glucose deg- radation rate (equation 5).
dt dP X biomass
)) d / ) c t ( exp(
( a b lactate ))
d / ) c t ( exp(
(
) d / ) c t ( d exp(
b
⋅
=
=
−
− + +
⋅
−
− +
−
−
⋅
1 1
1
1 2 π (3)
dt dX X biomass ))
d / ) c t ( exp(
( a b biomass ))
d / ) c t ( exp(
(
) d / ) c t ( d exp(
b
⋅
=
=
−
− + +
− ⋅
− +
−
−
⋅
1 1
1
1 2 µ (4)
dt ) dS ( X biomass
)) d / ) c t ( exp(
( a b e cos glu )) d / ) c t ( exp(
(
) d / ) c t ( d exp(
b
⋅ −
=
=
−
− + +
⋅
−
− +
−
−
⋅
1 1
1
1 2 σ (5)
The time function of the specific lactic acid formation rate π according to the equation (3) is plotted in Figure 12. The points marked are characteristic performance data of the strain, which can be used as criteria for strain optimization.
0 5 10 15
0 5 10 15 20 25 30
time [hours]
dP/dt, X
0 1 2 3
spezificproductivity
dP/dt specific productivityπ X
Lactic acid productivityBiomass dP/dt [g⋅L−1⋅h−1] ] L g [ ⋅ −1
] h [ −1 1/X⋅
0 5 10 15
0 5 10 15 20 25 30
time [hours]
dP/dt, X
0 1 2 3
spezificproductivity
Lacticacidproductivity
dt /
dP [g⋅L−1⋅h−1]
Biomass X [g⋅L−1]
π ty productivi
specific 1/X⋅dP/dt [h−1]
0 5 10 15
0 5 10 15 20 25 30
time [hours]
dP/dt, X
0 1 2 3
spezificproductivity
dP/dt specific productivityπ X
Lactic acid productivityBiomass dP/dt [g⋅L−1⋅h−1] ] L g [ ⋅ −1
] h [ −1 1/X⋅
0 5 10 15
0 5 10 15 20 25 30
time [hours]
dP/dt, X
0 1 2 3
spezificproductivity
Lacticacidproductivity
dt /
dP [g⋅L−1⋅h−1]
Biomass X [g⋅L−1]
π ty productivi
specific 1/X⋅dP/dt [h−1]
Figure 12: Courses of the time functions of the lactic acid productivity, the specific lactate for- mation rate and the biomass concentration during a typical batch fermentation of the strain L paracasei 168
2.4.2 Results
The objective of these batch experiments was to calculate quantities that are characteristic of the strain Lactobacillus paracasei 168 and suitable for optimising process parameters.
For this purpose, time-dependent concentrations of lactic acid, biomass and glucose measured during the trials were used as starting data. Some of the strain-characteristic quantities could be related directly from the latter, some other quantities had to be esti- mated by fitting target functions on the time-dependent data and calculating the turning points of these functions.
2.4.2.1 Characteristic quantities related directly from the measured data
This is in reference to the final concentrations of lactic acid and biomass, the duration of fermentation and the yields of lactic acid and biomass. The values found are listed in Table 5.
Table 5: Measuring data and characteristic performance data (Lactobacillus paracasei 168)
T(°C) pH Xmax Pmax YP Yx ∆t
40.5 5.5 10.7 104.8 88.1 8.99 40
40.5 6.0 10.75 103.3 93.5 9.73 31.5
40.5 6.5 12.2 104.2 92.5 10.8 26.0
38 5.5 10.6 105.0 83.9 8.5 34.25
38 6.0 11.8 102.5 89.7 10.3 23.4 38 6.5 13.1 99.15 80.9 10.7 27.5 38 7.0 8.2 103.3 97.6 7.75 43.1 33 5.5 26.8 102.8 92.3 25.1 44.2 33 6.0 14.2 102.0 91.3 12.8 26.4 33 6.5 12.3 102.8 93.5 11.2 26.7 33 7.0 9.1 102.9 94.4 8.35 46.5
28 5.5 8.65 107.2 92.5 7.47 54
28 6.0 15.2 104.3 91.9 13.4 30.7 28 6.5 19.8 102.8 89.4 17.2 30.4 28 7.0 9.8 101.1 91.3 8.86 45.6
Xmax Final biomass concentration in batch fermentation g · L-1 Pmax Final lactic acid concentration in batch fermentation g · L-1
YP Mean yield of lactic acid %
Yx Mean yield of biomass %
∆t Duration of fermentation h
Table 5 shows that the new strain is able to accumulate more than 100 g of lactic acid per litre in the medium. The yield of lactic acid can be higher than 90 % and the duration of fermentation varies between 23 and 54 hours.
2.4.2.2 Estimate of kinetic values for product formation and cell growth from experimen- tal data by model approximation
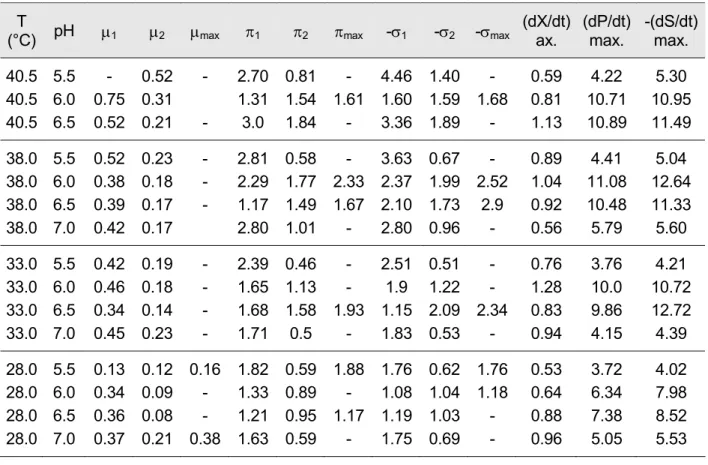
In this context, the maximum productivities of both lactic acid and biomass production, the maximum glucose utilization rate and the corresponding specific rates of the forma- tion of lactic acid and biomass as well as the specific glucose degradation rate are the most important quantities. The values obtained are shown in Table 6.
Table 6: Measuring data and kinetic data obtained by means of model approximation T
(°C) pH µ1 µ2 µmax π1 π2 πmax -σ1 -σ2 -σmax (dX/dt) ax.
(dP/dt) max.
-(dS/dt) max.
40.5 5.5 - 0.52 - 2.70 0.81 - 4.46 1.40 - 0.59 4.22 5.30 40.5 6.0 0.75 0.31 1.31 1.54 1.61 1.60 1.59 1.68 0.81 10.71 10.95 40.5 6.5 0.52 0.21 - 3.0 1.84 - 3.36 1.89 - 1.13 10.89 11.49 38.0 5.5 0.52 0.23 - 2.81 0.58 - 3.63 0.67 - 0.89 4.41 5.04 38.0 6.0 0.38 0.18 - 2.29 1.77 2.33 2.37 1.99 2.52 1.04 11.08 12.64 38.0 6.5 0.39 0.17 - 1.17 1.49 1.67 2.10 1.73 2.9 0.92 10.48 11.33 38.0 7.0 0.42 0.17 2.80 1.01 - 2.80 0.96 - 0.56 5.79 5.60 33.0 5.5 0.42 0.19 - 2.39 0.46 - 2.51 0.51 - 0.76 3.76 4.21 33.0 6.0 0.46 0.18 - 1.65 1.13 - 1.9 1.22 - 1.28 10.0 10.72 33.0 6.5 0.34 0.14 - 1.68 1.58 1.93 1.15 2.09 2.34 0.83 9.86 12.72 33.0 7.0 0.45 0.23 - 1.71 0.5 - 1.83 0.53 - 0.94 4.15 4.39 28.0 5.5 0.13 0.12 0.16 1.82 0.59 1.88 1.76 0.62 1.76 0.53 3.72 4.02 28.0 6.0 0.34 0.09 - 1.33 0.89 - 1.08 1.04 1.18 0.64 6.34 7.98 28.0 6.5 0.36 0.08 - 1.21 0.95 1.17 1.19 1.03 - 0.88 7.38 8.52 28.0 7.0 0.37 0.21 0.38 1.63 0.59 - 1.75 0.69 - 0.96 5.05 5.53 (dX/dt)max Maximum value of the biomass productivity during batch fermentation g · L-1 · h-1 (dP/dt)max Maximum value of the lactic acid productivity during batch fermenta-
tion
g · L-1 · h-1 (-dS/dt)max Maximum value of glucose utilisation rate during batch fermentation g · L-1 · h-1 µmax Maximum value of the specific growth rate during batch fermentation h-1 µ1 Value of specific growth rate when it is identical with that of biomass
productivity
h-1 µ2 Value of specific growth rate at the moment of maximum biomass pro-
ductivity
h-1 πmax Maximum value of the specific lactic acid formation rate during batch
fermentation
h-1 σmax Maximum value of the specific glucose degradation rate during batch
fermentation h-1
π1 Value of specific lactic acid formation rate when it is identical with that of lactic acid productivity
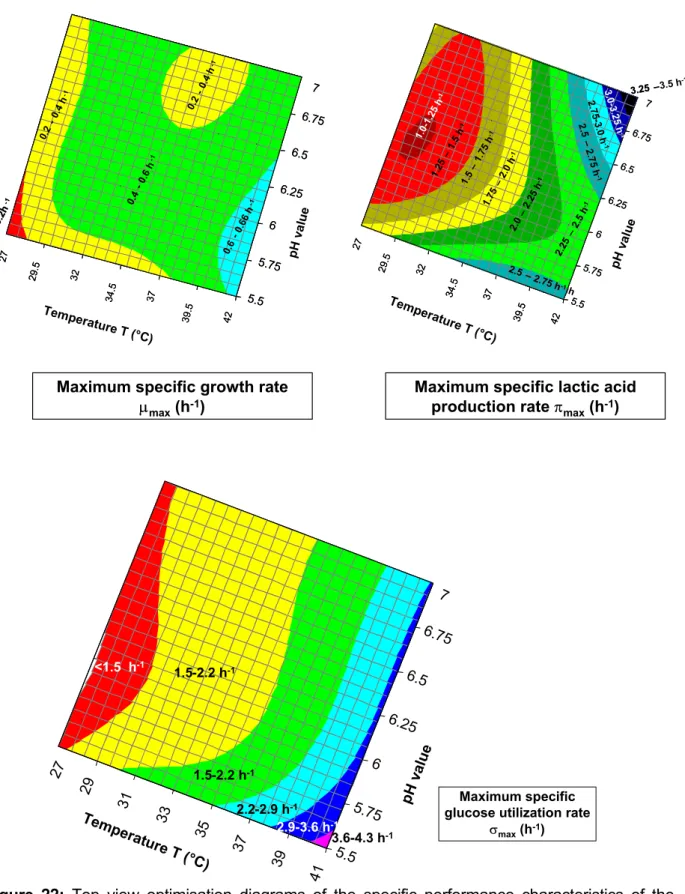
h-1 π2, σ1, σ2 accordingly to the previous specific reaction rates h-1 It may be stated that the kinetic quantities had a wide range of variance depending on the actual values of temperature and pH. The maximum lactic acid productivity and the maximum biomass productivity can be between 3.7 and 11 [g · L-1 · h-1] and 0.5 and 1.3 [g · L-1 · h-1], respectively. In this way, the maximum values of the specific growth rate, the specific product production and the specific glucose utilisation rate were found to be µ = 0.75 h-1, π = 3.00 h-1, σ = 4.46 h-1.
2.4.2.3 Estimation of the optimal parameters for lactic acid production and cell growth by means of non-linear regression
The data matrices shown in Table 5 and Table 6 were used in parameter optimisation by non-linear and three-dimensional regression using the computer program TableCurve 3D v2 (Jandel Scientific Software).
The duration of fermentation is the time interval between starting the process by inocula- tion and break off when glucose is exhausted completely. For its dependence on tempera- ture and pH value a model equation of the type
pH T j pH
T i pH T h
pH g T f pH T e
pH d T c
b a
t = + ⋅ + + ⋅ 2 + 2 + ⋅ + ⋅ 3 + 3 + ⋅ 2 + ⋅ 2
∆ (6)
was derived (r2 = 0.98319). Its constants were found to be
a = 6641.0714, b = 47.62301, c = -123641.65, d = -2.7939018, e = 655138.79, f = 544.85337, g = 0.022021249, h = -1055964.1, i = -2584.6406, j = 4.0491776.
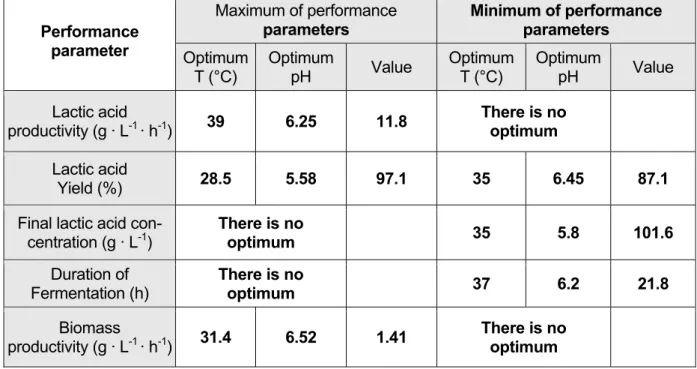
The model describes a central minimum (Figure 13) at the coordinates T = 37°C and pH = 6.2. The shortest duration of fermentation amounts to 21.8 hours.
27 29.5
32 34.5
37
T 39.5
emp eratu
re T (°C
) 7 6.7 6.4 6.1 5.8 5.5
pH 20
20 27
27 34
34 41
41 48
48 55
55 62
62
27 29.5
32 34.5
37 39.5
7 6.7 6.4 6.1 5.8 5.5
20
20 27
27 34
34 41
41 48
48 55
55 62
62
Duration of fermentation ∆t (hours)
Figure 13: Spherical diagram of the function ∆t = f (T, pH): side view
The final lactic acid concentration is the lactic acid concentration at the moment of break off. It is the maximum lactic acid concentration, which can be realized by the strain under the respective process conditions. Using the corresponding values from Table 6 the model approximation (r2 = 0.9929) results in a model equation having the structure of equation (7).
pH T
j pH
T i pH
h T
g pH T
f pH
e T
d pH
c T a b Pfinal
+ ⋅ + ⋅
+
⋅ + + +
+ + +
= 2 2 3 3 2 2 (7)
Its constants are
A = -610.01731, b = 4952.1035, c = 13174.471, d = 115013.77, e = -71912.831, f = -131679.11, g = -6223001.8, h = 158215.24, i = -122891.92, j = 3054063.2.
A diagram of this model is illustrated in Figure 14.
29.5 27 34.5 32
39.5 37
Temperature T (°C)
7 6.4
5.8 5.2 100
101.5 103 104.5 106 107.5 109
29.5 27 34.5 32
39.5 37 7
6.4 5.8
5.2
100 pH 101.5 103 104.5 106 107.5 109
29.5 27 34.5 32
39.5 37 7
6.4 5.8
5.2 100
101.5 103 104.5 106 107.5 109
Final lactic acid concentration P (g/l) 2729.53234.53739.5 7
6.4 5.8
5.2 100
101.5
101.5 103
103 104.5
104.5 106
106 107.5
107.5 109
109
Figure 14: Spherical diagram of the function Pfinal = f (T, pH)
Unfortunately, this model shows a minimum as optimum value and so there is no sole pa- rameter combination, which guarantees a maximum lactic acid concentration. The mini- mum final concentration amounts to 101.6 g · L-1 and is realized at a temperature of T = 35°C and a pH value of 5.8. But it is clear that there are other parameter combina- tions for higher final lactic acid concentrations up to 107 g · L-1.
The mean yield of lactic acid is the overall lactic acid yield calculated by dividing the final amount of lactic acid by the amount of glucose utilized. The model of mean lactic acid yield has a mathematical structure (equation (8)) like that found for the duration of fermen- tation, but it shows a distinct minimum and maximum (Figure 15).
pH T j pH
T i pH T h
pH g T f pH T e
pH d T c
b a
YP = + ⋅ + + ⋅ 2 + 2 + ⋅ + ⋅ 3 + 3 + ⋅ 2 + ⋅ 2 (8)
The constants of equation (8) are:
a = 5610.4949, b = 4.0826278, c = -101847.05, d = -0.94274624, e = 584453.27, f = 338.79754, g = 0.013115906, h = -1126333.1, i = -694.84883, j = -2.0450459 (r2 = 0.93502).
2729.53234.53739.5 Temperatu
re T (°C )
5.2 5.5 5.8 6.1 6.7 6.4
pH 85
85 87.5
87.5 90
90 92.5
92.5 95
95 97.5
97.5 100
100
Lactic acid yield Yp (%)
7
2729.53234.53739.5 Temperatu
re T (°C )
5.2 5.5 5.8 6.1 6.7 6.4
pH 85
85 87.5
87.5 90
90 92.5
92.5 95
95 97.5
97.5 100
100
Lactic acid yield Yp (%)
7
Figure 15: Spherical diagram of the function YP = f (T, pH)
The minimum lactic acid yield (87.1 %) is situated within the parameter limits chosen in this research. Its coordinates are T = 35°C and pH = 6.45. A maximum of 97.1 % was found at T = 28.5°C and pH = 5.58.
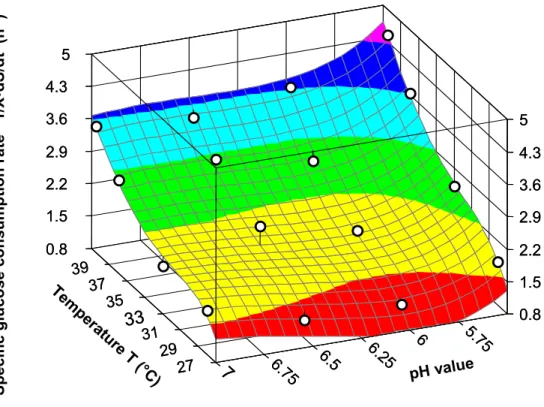
The calculated values of lactic acid productivity can be described as a function of the independent variables temperature and pH. A very good approximation of a polynomial function of the type
pH T
j pH
T i pH
h T
g pH T
f pH
e T
d pH
c T a b dt dP
+ ⋅ + ⋅
+
⋅ + + +
+ + +
= 2 2 3 3 2 2 (9)
on the values of lactic acid productivity was achieved (r2 = 0.9829). A three-dimensional presentation of this function is shown in Figure 16.
The constants of equation (9) were found to be