Evolutionary Algorithm in the Problem of SO
2Emission Reduction
Jarosław Stańczak, Piotr Holnicki, Andrzej Kałuszko, Systems Research Institute
Polish Academy of Sciences Newelska 6, 01-447 Warsaw, Poland
stanczak@ibspan.waw.pl holnicki@ibspan.waw.pl kaluszko@ibspan.waw.pl
Abstract: This work deals with the regional-scale strategy for air pollution abatement. The pivotal role in the presented approach plays the problem of optimal allocation of financial means for the long-term reduction of SO2
concentration in a given region. This problem is formally stated as a cost- constrained minimization of the environmental damage function during the accepted time horizon. The optimal distribution of financial means for desulfurization technologies within the predefined set of controlled pollution sources is a difficult computational problem, thus a specialized evolutionary algorithm has been prepared to solve it. The proposed evolutionary method is equipped with a specialized encoding of solutions with properly designed genetic operators and a quite complicated method of fitness function computation considering imposed financial constraints.
The test computations have been performed for the major power plants in Silesia Region (Poland).
1 Introduction
Regional-scale abatement strategy depends on the criteria upon which the environmental damage is evaluated ([HKC04]). It is obvious, that the process of pollution elimination must be treated as a long-term process due to the high financial requirements and time needed to apply new technologies. This leads to formulation of the problem in terms of optimization techniques, based on cost-effectiveness analysis of emission reduction, taking into account a time factor. The problem is very difficult to solve using traditional optimization methods, thus an evolutionary algorithm has been chosen to solve it.
Similar problems, but without taking into account a time factor were considered in [HK00], [HK04].
281
2 Statement of the problem
Assume that there are N controlled emission sources in a region Ω and M technologies for emission reduction. Each technology has its effectiveness and the unit costs (investment and operational). The goal is to allocate emission reduction technologies (M methods) to all the sources in such a way, that the value of certain environmental damage index (1) will be minimal subject to constraints on total costs in every year of the time horizon. The environmental cost function has the following form:
∑ ∫
= Ω − Ω= T
t
ad
t x y d d
d y
x w d
J
1
]2
) ) , ( , 0 ( max [ ) , 2 (
) 1
( (1)
Ω = Lx ×Ly - rectangle area under consideration;
w(x,y) - area sensitivity (weight) function;
T – control horizon, t – time, t∈{1,...,T};
dad – admissible concentration level;
dt(x,y) – the concentration forecast, calculated using formula (2):
∑
=Ω
∈
⋅ +
= N
i i it
t xy d x y A x y u x y
d
0( , ) 1 ( , ) , ( , )
) ,
( (2)
d0(x,y) – background concentration (impact of uncontrolled sources);
Ai(x,y) – unit transfer matrix (relation emission to concentration) of the i-th source;
uit – current emission intensity of source i in the time stage t;
ui0 – initial emission intensity of the i-th source.
The unit transfer matrix Ai(x,y) represents the contribution of the i-th source, referred to the unit emission intensity. All the matrices Ai(x,y) (i=1,...,N), for controlled sources are preprocessed by the respective forecasting model ([HKC04], [HKŻ94], [HNŻ00]). In a similar way, the background pollution level d0(x,y) is computed for uncontrolled, background emissions, including the inflow from the neighboring regions. The current emission intensity of the i-th source depends on the initial emission value – ui0 and efficiency of the abatement technology applied during time T, according to the formula (3):
) 1
0( sit i
it u e
u = − (3)
sit
e – efficiency of applied for source i emission reduction technology in moment t;
sit – index of applied technology for source i in moment t.
A cost of emission abatement in each source consists of two components: an investment cost and an operational cost. Both investment and operational costs depend on the specific abatement technology and on the parameters of the energy installation where this technology is to be utilized. Here a simplified approach is utilized, where the investment cost of the j-th abatement technology applied to the i-th emission source is calculated as annual cost, averaged over the entire amortization period. Thus, the total emission abatement cost per year, considered as a sum of reduction costs in the respective plants, is used to formulate the cost constraint (4):
282
∑ ∑
= == + ≤
N
i N
i
it t it s s i
it u f f C
c
1 1
2 1
0 ( ) , (4)
Ct - constraint on investment and operational costs for one year;
cit – total cost (investment and operational) for year t of source i;
1 sit
f 2
sit
f – averaged annual investment and operational cost of technology s applied to the i-th source in t;
Now one can formulate the following problem of allocation of emission reduction technologies to emission sources:
ALLOCATION PROBLEM (AP): Determine the set of emission reduction technologies allocated to emission sources: S={sit∈{1,..,N}: 1≤i≤N, 1≤t≤T} in such a way that the environmental cost function (1) is minimal, subjected to the total cost constraint (4).
3 Evolutionary algorithm
Solutions obtained in the subsequent iterations of the evolutionary algorithm are the population members. The main part of the solution is a vector of the length equal N with possible one of M different abatement technologies on each position. Each of N positions (emission source) has also two data fields for beginning and completion time of new investment. Time of beginning of new investment and the number of technology chosen for execution are generated by evolutionary operators. The time of completion of new technology is computed by the evaluation function using factors of financial means allocation. These factors are also modified by evolutionary operators and denote how financial means for new investments are divided among emission sources. It should be noticed that money for current exploitation is the most important and investments are made only if there is a financial surplus. Values of allocation factors are percents of this surplus allocated for investments to emission sources for one year. The fitness function (5) bases on the objective function (1) and a cost constraint (4) violation (a penalty function):
8
1max(0, 1 )
10000 )
( ∑ ∑
= =
−
⋅ +
= T
t
N
i cit Ct
d J
Q (5) and is a weighted sum of these two elements, with the parameters calculated on the basis of experiments. The cost constraint violation part is also responsible for calculating times of investment completion. It is assumed that new technology is ready to use in the next year, after all money for investment is granted.
4 Experimental results
The emission data concerns the industrial Upper Silesia Region, which is characterized by high concentration of heavy industry and the energy sector installations. In the test computations presented, 8 desulfurization technologies are taken into account. The technologies and the respective emission reduction efficiencies are as follows:
283
1) "do nothing" technology e=0.0; 2) low-sulfur fuel e≅0.30; 3) dry desulfurization method e≅0.35; 4) low-sulfur fuel + dry desulfurization method e≅0.545; 5) half-dry desulfurization method ; 6) low-sulfur fuel + half-dry desulfurization method
; 7) MOWAP method 75 .
≅0 e 825
.
≅0
e e≅0.85; 8) low-sulfur fuel + MOWAP method .
Simulations were conducted for prepared set of constraints (C
895 .
≅0 e
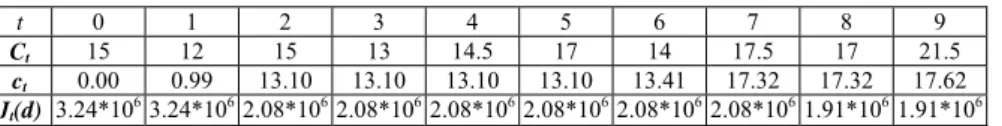
t). The results are presented in Table 1 and 2. Table 1 shows, in consecutive years, cost constraints imposed on emission sources, exploited parts of funds and obtained values of environmental damage function thanks to application of new desulfurization technologies. Table 2 shows the schedule of new technologies application. The technology number 1 is a base one (the highest pollution level) and it is assumed that it requires no investment cost. Due to cost constraints some emission sources are not modernized, it is denoted by a sign "–" on the tables.
The evolutionary method presented in this article has been successfully tested on several sets of cost constraints. Though evolutionary method is good, authors of this paper also conduct research to find simply heuristic method to solve this task. Heuristic method is expected to be faster then evolutionary method. Evolutionary computations for this kind of problem lasted about 5 hours on PENTIUM III 800 MHz computer with Linux operating system.
t 0 1 2 3 4 5 6 7 8 9
Ct 15 12 15 13 14.5 17 14 17.5 17 21.5 ct 0.00 0.99 13.10 13.10 13.10 13.10 13.41 17.32 17.32 17.62 Jt(d) 3.24*1063.24*1062.08*1062.08*1062.08*1062.08*1062.08*1062.08*1061.91*1061.91*106
Table 1: Values of imposed constraints (Ct) and obtained values (ct) of costs and environmental damage function (Jt(d)) in consecutive time stages.
Em. source 1 2 3 4 5 6 7 8 9 10 11 12 13 14 15 16 17 18 19 20 Technology 1 2 2 1 5 1 1 1 1 1 1 5 4 8 5 1 1 5 1 1 ts - 5 5 - 0 - - - 5 0 0 8 - - 0 - - te - 6 6 - 1 - - - 6 1 1 9 - - 1 - - Table 2: A schedule of moments of new investments corresponding to values shown in Table 1,
ts, te – moments of start and end of new investment.
Bibliography
[HK00] Holnicki, P.; Kałuszko, A.: Decision support method for cost-effective emission control on regional scale, Annals of Operations Research, 97, 2000; S. 249–262.
[HK04] Holnicki, P.; Kałuszko, A.: Decision support for optimal emission reduction, Management of Environmental Quality, 15, 2004; S. 250–257.
[HKC04] Haurie, A.; Kubler, J.; Clappier A.; van den Bergh, H.: A metamodeling approach for integrated assessment of air quality policies, Environmental Modeling and Assessment, 9, 2004; S. 1–12.
[HKŻ94] Holnicki, P.; Kałuszko, A.; Żochowski, A.: A microcomputer implementation of air quality forecasting system for urban scale, Microcomputer Applications, 13, 1994; S. 76–84.
[HNŻ00] Holnicki, P.; Nahorski, Z.; Żochowski, A.: Modeling of Environmental Processes (in Polish). WSISiZ Publ., Warszawa, 2000.
284