Schriften aus der Fakultät Wirtschaftsinformatik und
Angewandte Informatik der Otto-Friedrich-Universität Bamberg
36
Konstantin Hopf
Predictive Analytics for Energy Efficiency
and Energy Retailing
Schriften aus der Fakultät Wirtschaftsinformatik und Angewandte Informatik der Otto-Friedrich- Universität Bamberg
36
Contributions of the Faculty Information Systems and Applied Computer Sciences of the
Otto-Friedrich-University Bamberg
Schriften aus der Fakultät Wirtschaftsinformatik und Angewandte Informatik der Otto-Friedrich- Universität Bamberg
Band 36
Contributions of the Faculty Information Systems and Applied Computer Sciences of the
Otto-Friedrich-University Bamberg
Konstantin Hopf
Predictive Analytics for Energy Efficiency
and Energy Retailing
Dieses Werk ist als freie Onlineversion über den Publikationsserver (OPUS; http://www.
opus-bayern.de/uni-bamberg/) der Universität Bamberg erreichbar. Das Werk – ausge- nommen Cover, Zitate und Abbildungen – steht unter der CC-Lizenz CC-BY.
Lizenzvertrag: Creative Commons Namensnennung 4.0 http://creativecommons.org/licenses/by/4.0
Herstellung und Druck: docupoint, Magdeburg Umschlaggestaltung: University of Bamberg Press
© University of Bamberg Press, Bamberg 2019 http://www.uni-bamberg.de/ubp/
ISSN: 1867-7401
ISBN: 978-3-86309-668-7 (Druckausgabe)
Bibliographische Information der Deutschen Nationalbibliothek
Die Deutsche Nationalbibliothek verzeichnet diese Publikation in der Deutschen Nationalbibliographie; detaillierte bibliographische Informationen sind im Internet über http://dnb.d-nb.de/ abrufbar.
Diese Arbeit hat der Fakultät Wirtschaftsinformatik und Angewandte Informatik der Otto-Friedrich-Universität Bamberg als Dissertation vorgelegen.
1. Gutachter: Prof. Dr. Thorsten Staake 2. Gutachterin: Prof. Dr. Ute Schmid Tag der mündlichen Prüfung: 30.04.2019
Contents
Table of Contents i
Abstract xvii
Kurzzusammenfassung xxi
Acknowledgements xxv
1 Introduction and motivation 1
1.1 Ambient data as a new source for analytics . . . . 3
1.2 Research goal: Value creation from ambient data through ma- chine learning . . . . 7
1.3 Empirical research within the the context of energy efficiency and energy retailing . . . . 9
1.3.1 Electricity retail market: Current challenges and oppor- tunities . . . . 10
1.3.2 Case 1: Scalable energy efficiency campaigns . . . . 13
1.3.3 Case 2: Relationship marketing in energy retailing . . . . 14
1.4 Structure of this work and earlier publications . . . . 15
2 Related work and theoretical background 21
2.1 Value creation from big data . . . . 21
2.1.1 Data-driven decision making process . . . . 23
2.1.2 Predictive analytics in information systems research . . . 25
2.1.3 Frameworks and process models for big data analytics . . 27
2.1.4 Research gaps in information systems research . . . . 28
2.2 Household characterization based on electricity consumption data 29 2.2.1 Factors influencing residential electricity consumption . . 30
2.2.2 Non-Intrusive Load Monitoring (NILM) . . . . 30
2.2.3 Clustering of energy customers . . . . 30
2.2.4 Household classification . . . . 31
2.2.5 Research gaps in household classification . . . . 31
Contents
2.3 Relationship marketing . . . . 34
2.3.1 Information systems for customer relationship manage- ment . . . . 35
2.3.2 Predictive segmentation and customer scoring . . . . 36
2.3.3 Purchase intention and behavior . . . . 37
2.3.4 Research gaps in relationship marketing research . . . . . 38
3 Data sources in organizations and extraction of predictor variables 39
3.1 Theoretical background and research questions . . . . 41
3.1.1 Need for a systematic overview to available data sources 41 3.1.2 Algorithmic versus theory-based extraction of predictor variables (features) . . . . 43
3.2 Taxonomy of data sources available for predictive business ana- lytics . . . . 45
3.2.1 Internal business data . . . . 46
3.2.2 External data sources . . . . 48
3.2.3 Contribution of the taxonomy . . . . 50
3.2.4 Limitations and future research . . . . 50
3.3 Dimensionality reduction through empirical feature extraction . 51 3.3.1 Features from utility transaction data . . . . 52
3.3.2 Features from environmental data . . . . 64
3.3.3 Features from geographic information . . . . 66
3.3.4 Features from governmental statistical data . . . . 68
3.3.5 Contribution of empirical feature extraction to model building . . . . 71
3.4 Dimensionality reduction through automatic feature selection . . 74
3.4.1 Types of automatic feature selection approaches . . . . . 75
3.4.2 Collection of Feature Selection Method (FSM) in R . . . 76
3.5 Discussion and implications . . . . 80
4 Machine learning methods for predictive analytics 83
4.1 Overview to supervised machine learning algorithms . . . . 85
4.2 Classification performance evaluation . . . . 87
4.2.1 Metrics for dependent variables with multiple classes . . 88
4.2.2 Metrics for two-class problems . . . . 90
4.2.3 Reference statistics for interpretation of performance met- rics . . . . 92
4.2.4 Calculation of performance measures . . . . 92
4.2.5 Comparison of performance metrics . . . . 93
Contents 4.3 Description of selected supervised machine learning algorithms . 94
4.3.1 k Nearest Neighbors (kNN) . . . . 94
4.3.2 Na¨ıve Bayes . . . . 94
4.3.3 Support Vector Machine (SVM) . . . . 95
4.3.4 AdaBoost . . . . 95
4.3.5 Random Forest (RF) . . . . 95
4.3.6 Extreme Gradient Boosting (XGB) . . . . 96
4.4 Discussion and conclusion . . . . 99
5 Household classification for energy efficiency and personalized customer communication 101
5.1 Datasets with residential energy consumption, household loca- tion and survey data . . . . 105
5.1.1 Dataset A and B: Annual electricity consumption data . 107 5.1.2 Dataset C: Daily smart meter data . . . . 109
5.1.3 Dataset D: 15-min smart meter and survey dataset . . . 109
5.2 Household properties (dependent variables) . . . . 113
5.3 Performance of machine learning algorithms in smart meter house- hold classification . . . . 118
5.4 Benchmark of FSMs for smart meter household classification . . 120
5.4.1 Earlier studies comparing FSMs . . . . 121
5.4.2 Quality criteria for FSM performance . . . . 123
5.4.3 Accuracy improvement of FSMs in a minimal viable setup 124 5.4.4 Stability of feature selection . . . . 125
5.4.5 Correlation of algorithm runtime and accuracy improve- ment . . . . 127
5.5 Predictability of household characteristics based on different data granularities . . . . 128
5.5.1 Annual electricity consumption data with geographic and statistical data . . . . 128
5.5.2 Daily electricity consumption data . . . . 130
5.5.3 Smart meter data . . . . 132
5.5.4 Geographic transferability of models . . . . 134
5.6 Discussion and implications . . . . 137
5.6.1 Recognition of household characteristics based on elec- tricity consumption data . . . . 137
5.6.2 Limitations and future research . . . . 142
5.6.3 Practical implications: Model improvement beyond algo-
rithms tuning . . . . 142
Contents
6 Personalized home energy reports for user engagement and resi-
dential energy efficiency 145
6.1 Customer engagement through tailored energy feedback . . . . . 146
6.2 Development of a personalized e-mail energy report . . . . 148
6.3 Experimental and survey-based evaluation of the energy report . 150 6.3.1 Timeline of the study . . . . 150
6.3.2 Sample description . . . . 151
6.3.3 Customer survey . . . . 153
6.4 Analysis of the first experiment and results for the base energy report . . . . 154
6.4.1 Customer reactions to the energy report mailing . . . . . 154
6.4.2 Portal usage . . . . 154
6.4.3 Electricity consumption . . . . 158
6.4.4 Usability and user perception of the report . . . . 162
6.4.5 Customer satisfaction with the utility company . . . . . 164
6.4.6 Attitudes towards energy conservation . . . . 166
6.5 Analysis of the second experiment and contribution of household classification . . . . 167
6.5.1 Personalized feedback element for comparison with simi- lar households . . . . 168
6.5.2 Experiment setup . . . . 169
6.5.3 Experiment results . . . . 169
6.6 Discussion and implications . . . . 170
7 Supporting cross-selling marketing campaigns with predictive an- alytics 173
7.1 Fiber-to-the-Home (FTTH) as a relevant product for utility com- panies . . . . 175
7.2 Descriptive insights on the purchase intention of residential cus- tomers . . . . 176
7.3 Predictive analytics to identify customers with high interest in FTTH . . . . 179
7.3.1 Data and features . . . . 180
7.3.2 Supervised machine learning and performance evaluation 181 7.4 Contribution to the planning and execution of cross-selling mar- keting campaign . . . . 183
7.4.1 Customer scoring (operational decision support) . . . . . 183
7.4.2 Cost-benefit analysis (tactical decision support) . . . . . 184
Contents 7.4.3 Converting predicted purchase intentions into purchase
probabilities to estimate market size (strategic decision
support) . . . . 186
7.5 Conclusion and limitations . . . . 188
8 Summary and implications 191
8.1 Summary of the results . . . . 193
8.2 Implications for research and future work . . . . 198
8.2.1 Value creation through predictive analytics . . . . 198
8.2.2 Energy informatics to support energy efficiency . . . . . 199
8.2.3 Relationship marketing . . . . 201
8.2.4 Machine learning . . . . 201
8.3 Assumptions and limitations . . . . 202
8.4 Practical implications . . . . 203
8.4.1 Utilities can turn challenges into opportunities through data-driven innovations . . . . 203
8.4.2 Recommendations for introducing predictive analytics in firms . . . . 206
A Systematic literature analysis on predictive analytics 209
A.1 Data collection . . . . 209
A.2 Content analysis . . . . 210
B Conducted case studies in energy retail 217 C Survey instruments 219
C.1 Environmental attitude . . . . 219
C.2 Customer-based reputation of a firm . . . . 220
C.3 Purchase intention . . . . 221
C.4 Usability perception scale for energy feedback . . . . 223
Bibliography 225
Glossary 249
List of Figures
1.1 Characteristics of ambient data and classical business data; the goal of this work is to investigate how machine learning can be used to harness
ambient data in business applications
. . . . 5
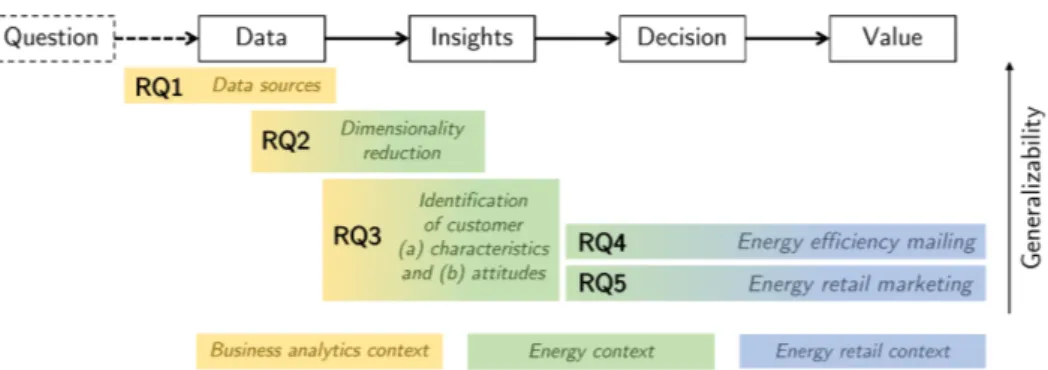
1.2 Research questions (RQs) covered in this dissertation and their position-ing in the data-driven decision making process
. . . . 8
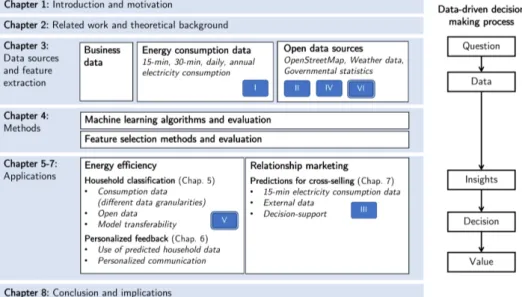
1.3 Structure of this dissertation and related publications along the data-driven decision making process
. . . . 15
2.1 Big data analytics and the data-driven decision making process. . . . 23
2.2 Total number of hits for the search terms related to predictive analytics(duplicate mentions possible, as papers were found through multiple
search terms)
. . . . 26
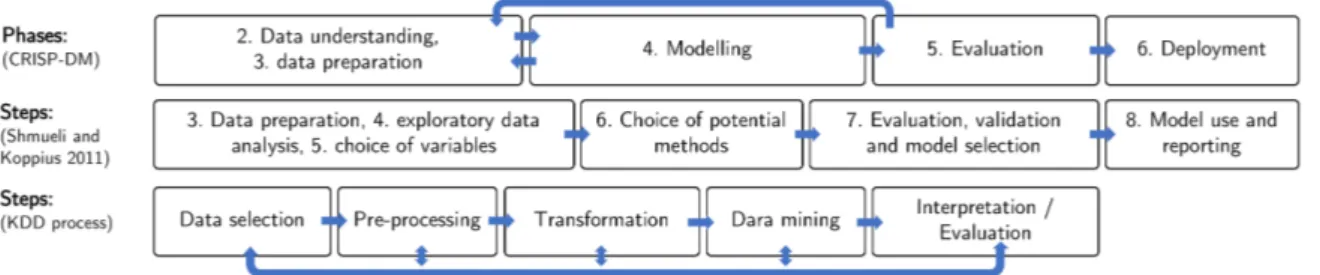
2.3 Frameworks and process models for data analytics. . . . 28
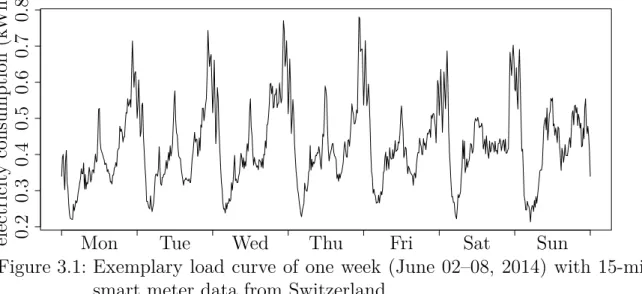
3.1 Exemplary load curve of one week (June 02–08, 2014) with 15-min smartmeter data from Switzerland
. . . . 55
3.2 Algorithm for identifying low and high consumption clusters. . . . . 60
3.3 Electricity consumption load trace for daily consumption values in a12-week period with occupancy any non-occupancy times
. . . . 62
3.4 Map visualizations of OSM-data in 300m×300m bounding-boxes aroundtwo customer address locations (the bounding-boxes are highlighted with
brighter colors)
. . . . 68
3.5 Theory and human expert knowledge based dimensionality reductionthrough feature extraction
. . . . 82
4.1 The predictive modeling and evaluation process. . . . 84
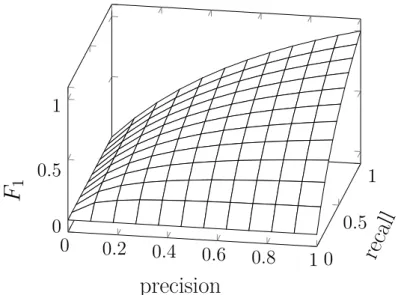
4.2 Illustration of the F1 classification quality measure in relation to preci-sion and recall
. . . . 91
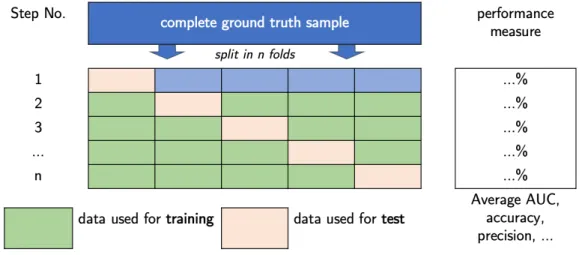
4.3 Illustration of the k-fold cross-validation. . . . 93
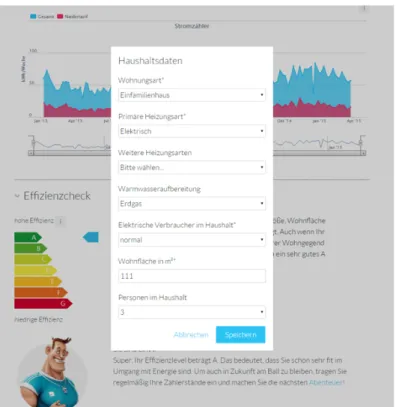
5.1 Illustration of the household classification approach used in this work. 104
5.2 Efficiency check in the energy efficiency web portals to acquire householdcharacteristics for classification (Source: BEN Energy)
. . . . 107
5.3 Classification accuracy for 19 household properties in dataset D basedon seven classifiers with standard parameters; Random Forest achieved
the best overall results
. . . . 119
List of Figures
5.4 Boxplots of classification accuracy of 209 different SVM parameter con- figurations for the 19 household properties in dataset D (the standard
configuration is highlighted in red)
. . . . 121
5.5 Performance results of different FSMs in average change in accuracycompared to no feature selection (using logistic regression as classifier)
126
5.6 Feature Selection Methods (FSMs) with classification performance im-provement in comparison with the stability (normalized by the logarithm
of the number of selected features)
. . . . 127
5.7 Classification performance (in MCC) for five household properties indataset A and B using consumption, governmental statistical, and geo-
graphic data in various combinations with the Random Forest classifier
129
5.8 Classification accuracy for 9 household properties in dataset C (plus oneproperty-combination) with six classifiers
. . . . 131
5.9 Illustration of the four considered cases to test the geographic transfer-ability of machine learning models
. . . . 135
6.1 Screenshot of the energy efficiency web portal (Source: BEN Energy). 148
6.2 Energy report variant sent in April 2017 (Design: BEN Energy). . . . 149
6.3 Timeline of the experiment. . . . 151
6.4 Number of registered customers on energy efficiency portal. . . . 152
6.5 Customer reactions to the energy report (e-mail open and click events)155
6.6 Portal user sessions in three week timespans after each energy reportmailing was sent and two timespans without a report for comparison
. 157
6.7 Changes in household details by users per month. . . . 157
6.8 Electricity consumption of both experiment groups with temperatureand dates of the energy report interventions
. . . . 159
6.9 Survey results for UPScale with results from previous studies, (* indi-cates transformed negative questions)
. . . . 163
6.10 Survey results for CBR-Short scale with benchmark values from otherindustry branches
. . . . 166
6.11 Variants of the social-normative feedback element with comparison ofthe energy consumption with similar households (Source: BEN Energy)
168
6.12 Reactions of both experiment groups to the third energy report e-mail170
7.1 Distribution of answers to purchase intention towards FTTH. . . . . 177
7.2 Method to predict purchasing probability for cross-selling products orservices using the data available to energy utility companies
. . . . 179
7.3 AUC results for different classifiers for the class “high PI” with 95%confidence intervals
. . . . 182
7.4 Algorithm selection in comparison with a random selection. . . . 184
7.5 Cost-benefit visualization for a marketing campaign. . . . 185
A.1 Identified articles for the considered search terms in journals over time212
List of Figures
A.2 Illustration of the codings into three paper types: predictive analyticsstudies (focus of this work), conceptual articles on predictive analytics
and studies not investigating the application of predictive analytics
. . 213
List of Tables
1.1 Research questions and chapters at a glance
. . . . 9
3.1 Taxonomy of internal and external data to categorize or identify data sources for analytics
. . . . 47
3.2 Features based on daily energy consumption time series data
. . . . . 57
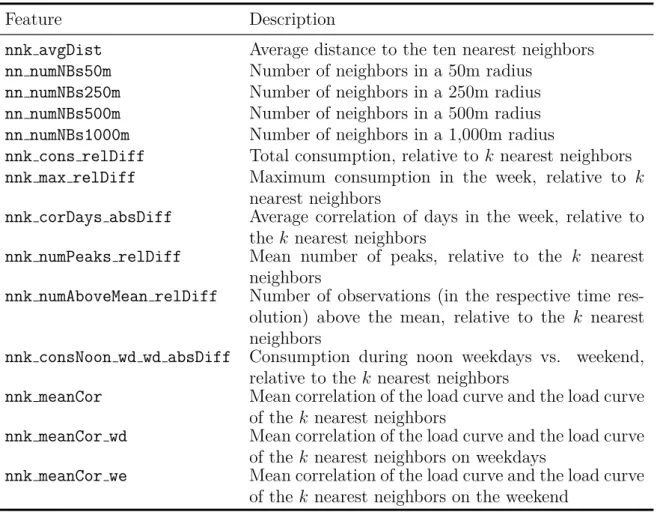
3.3 Neighborhood features based on smart meter electricity consumption data
. . . . 64
3.4 Statistics that have been identified in Hopf, Riechel, et al. (2017) as meaningful for predictive customer analytics (•= data available,∗= no or incomplete data for Germany, ?= no or incomplete data for Switzer- land)
. . . . 69
3.5 Identified filter methods for feature selection together with the software library and literature reference (if applicable)
. . . . 76
4.1 Confusion matrix for binary classification
. . . . 88
4.2 Comparison of classification performance metrics
. . . . 94
4.3 Parameters of the kNN algorithm
. . . . 95
4.4 Parameters of the SVM algorithm
. . . . 96
4.5 Parameters of the AdaBoost algorithm
. . . . 96
4.6 Parameters of the RF algorithm
. . . . 97
4.7 Parameters of the XGB algorithm
. . . . 97
5.1 Energy consumption datasets used in this dissertation
. . . . 106
5.2 Survey variables with respective scale type (N = numeric, C = categor- ical) asked in BEN Energy’s energy efficiency portals
. . . . 108
5.3 Questions and answer possibilities to the customer survey related to dataset D with answer types (N = numeric, C = categorical, T = free text, L = logical) and references to survey items of measurement instru- ments
. . . . 111
5.4 Household properties as dependent variables in predictive analytics: def- inition of the classes and descriptive statistics for the four datasets used in this work; when no statistics are listed, the variable is not existent in the dataset; the asterisk (*) marks that the property has been investi- gated in earlier studies
. . . . 115
5.5 Classification performance (Random Forest algorithm) for all propertiesand classes measured in Accuracy, MCC, and AUC on average based on
all 50 weeks of electricity consumption and weather data individually
. 133
List of Tables
5.6 Accuracy of models trained with annual electricity consumption data from households in Switzerland and Germany together with geographic
data and are applied to households in both countries
. . . . 136
5.7 Accuracy of models trained with 30-min electricity SMD from house-holds in Switzerland and Ireland and are applied to households in both
countries
. . . . 136
5.8 Studies predicting household characteristics with different electricityconsumption datasets and external data (the symbols are used in Ta-
ble 5.9)
. . . . 138
5.9 Household characteristics that could be predicted based on electricityconsumption data of different time series resolution in earlier studies
(symbols are listed in Table 5.8) and this work (marked with )
. . . . 140
6.1 Customer groups and sample sizes at the beginning of the study. . . 153
6.2 Customer reactions to three energy reports. . . . 156
6.3 Difference-in-Differences models explaining the daily electricity consump-tion of households in both experiment groups
. . . . 160
6.4 UPScale: Items and descriptive statistics obtained in the customer survey162
6.5 Selected items from CBR-Short Scale with descriptive statistics obtainedin the customer survey
. . . . 165
6.6 Items for attitudes towards energy conservation with descriptive statis-tics obtained in the customer survey
. . . . 167
6.7 Distribution of customers into groups for the second experiment. . . . 169
7.1 The groups for purchase intention towards Fiber-to-the-Home (FTTH)177
7.2 Selected features by the consistency feature selection method (Dash andHuan Liu 2003) in any of the weeks with Random Forest feature im- portance scores, obtained with the predictive model used in the case
study
. . . . 180
7.3 Classification results with data from different data sources. . . . 183
A.1 Journals and database fields that have been searched, together with thecorresponding databases
. . . . 211
A.2 Articles in the AIS basket of top journals for the search terms (one articlemay belong to multiple search terms)
. . . . 211
A.3 Identified articles for the considered search terms over time. . . . 211
A.4 Industrials contexts in predictive analytics studies with the frequency ofstudies in AIS basket of top journals (multiple assignments possible)
. 214
A.6 Data sources in predictive analytics studies with the frequency of studiesin AIS basket of top journals (multiple assignments possible)
. . . . . 215
A.8 Predictive modelling algorithms in reviewed studies in AIS basket of topjournals (multiple assignments possible)
. . . . 215
B.1 Overview to conducted case studies in this dissertation research project218
List of Tables
C.1 Items for the behavior based measurement instrument for attitudes to-wards energy conservation with German translations
. . . . 219
C.2 Selected items from CBR-Short Scale: Item and German translation. 220
C.3 Purchase intention scale used by H.-W. Kim et al. (2007) with Germantranslations
. . . . 221
C.4 Responses to the purchase intention scale of Juster (1966) with Germantranslation
. . . . 222
C.5 UPScale: Items and German translation. . . . 223
List of Abbreviations
AIS Association for Information Systems ANN Artificial Neural Network
AUC Area Under ROC Curve BRG Bias Random Guess
CBR Customer Based Reputation CPD Consumption Per Day
CRM Customer Relationship Manage- ment
CTA Call-to-Action
DiD Difference-in-Differences FTTH Fiber-to-the-Home FSM Feature Selection Method GPS Global Positioning System HT High Tariff (“Hochtarif”) IoT Internet of Things IS Information Systems IT Information Technology kNN k Nearest Neighbors
LDA Linear Discriminant Analysis ML Machine Learning
MCC Matthews Correlation Coefficient NILM Non-Intrusive Load Monitoring NPS Net Promoter Score
NT Low Tariff (“Niedertaif”) OLS Ordinary Least Squares OSM OpenStreetMap
PI Purchase Intention RF Random Forest RG Random Guess
ROC Receiver Operating Characteristic RQ Research Question
SMD Smart Meter Data SVM Support Vector Machine
VGI Volunteered Geographic Information XGB Extreme Gradient Boosting
Abstract
In the course of digitalization, large amounts of data are created. These are present in every single firm or they are freely available as public data online.
They can be used, for example, to implement new products and services, or to make existing processes more efficient. The data are of diverse nature and range from transaction data as a result of business processes (such as purchases in online shops, usage information from video or music-on-demand providers, app usage data), communication data (e.g., correspondence, chat protocols), to sensor data from industrial plants or smart home devices. Additionally, a large number of online data sources have been created, which can be used freely.
Examples are geographic information (e.g., from the freely editable map Open- StreetMap), weather data, and public statistics.
From a practical perspective, firms are searching for new business models and ways to commercially leverage the increasing amount of data. From a research perspective, a better understanding of the data value creation process is neces- sary, and success factors as well as obstacles to this process must be identified.
Better knowledge of this process will enable the creation of economic, environ- mental, and social value from the growing amount of data.
Current information systems literature points to the need for empirical re- search in this area. Additionally, a comprehensive explanation of how to suc- cessfully create value from available data is missing, thus far. Value does not arise automatically from the use of data. There is rather a complex process nec- essary in which insights are first gained from data, leading to better decisions that ultimately can create value. Machine learning (ML) techniques, a class of artificial intelligence methods that derive patterns from data, have the particular potential to prepare the large amount of data in a way that knowledge can be generated from it. The insights can then create value through better decisions.
In my dissertation, I focused on answering five central research questions re- garding predictive analytics along with the data value creation process. The resulting core contributions of my work, outlined below, help to achieve a better theoretical understanding of the value generation from data using ML methods.
First, based on a systematic literature analysis of information system research
journals, an overview of firm internal and external data sources for possible data
Abstract
analyses was created. This overview has been validated and expanded with the knowledge gathered in seven case studies (two of which are described in detail in this dissertation), and gives firms the opportunity to inventory their databases and identify data sources for analysis. Second, throughout eight examples of empirical feature extraction, the work demonstrates how human cognition, the- ory, and expert knowledge can help in the effective preparation of data for ML applications, despite the many automated ways to preprocess data for further analysis. The findings point out that experts are needed to set up and effec- tively combine automated data analysis techniques. These professionals must be trained and promoted. Third, current ML algorithms for classification and vari- able selection methods were empirically benchmarked using real data sets from energy retailing. In this dissertation, recommendations for the use of data analy- ses in utility companies are derived. Concretely, I tested how strong unfavorable factors of modeling (i.e., a lower degree of detail in the raw data, and different geographical locations of the training and test data) affect the predictive quality.
My investigation revealed, in particular, that despite these unfavorable factors negatively effect the predictive quality, the influence of the lower performance is ultimately not too strong as to impair the success of predictive systems. Finally, the successful use of the information gained through ML applications is shown through two main case studies in this dissertation. The step from insight to value is demonstrated using the examples of automated energy feedback and relationship marketing. The two case studies considered are based on real data from energy providers in Germany and Switzerland and cover all steps of the data value creation process.
The energy sector is an ideal field for the research carried out, as the demand for data-driven innovations is particularly high in that industry. Energy utilities must become more competitive in increasingly liberalized markets, but are man- dated to motivate their customers to consciously conserve energy. Additionally, they must increase the acceptance of sustainable—often more expensive—energy products and pioneer new fields of business in order to implement the transfor- mation of energy systems. On the contrary, energy utility companies have a large customer base and possess an increasing amount of data on their customers (e.g., from smart grids) that contain valuable insights.
In the first case study, the prediction of household characteristics related to
residential energy efficiency (e.g., type of heating, age of house, number of occu-
pants, children in the household) from energy consumption data together with
freely available data using ML methods was investigated. Knowledge of such
characteristics can be used to personalize energy efficiency campaigns and thus
make them more effective (e.g., through household specific savings recommen- dations, load estimation and shifting).
The second case study dealt with the recognition of customer attitudes and be- havior (e.g., attitudes towards energy efficiency, willingness to buy photovoltaic systems or new products from energy providers). The successful prediction of such information enables the development of new products and services in the energy sector as well as their targeted promotion to relevant customer segments.
The use of ML-based data analysis in energy retailing can thus improve energy
efficiency in the residential sector, increase customer value, and improve the
service quality. Therefore, the dissertation shows how economic, ecological, and
social value can be created from data and is a blueprint for other industries.
Kurzzusammenfassung
Im Zuge der Digitalisierung entstehen große Datenmengen. Diese sind in je- dem einzelnen Unternehmen pr¨ asent oder als ¨ offentliche Daten frei zug¨ anglich im Internet verf¨ ugbar. Sie k¨ onnen genutzt werden, um beispielsweise neue Pro- dukte und Dienstleistungen zu realisieren oder vorhandene Prozesse effizien- ter zu gestalten. Die Daten sind von unterschiedlichster Natur und reichen von Transaktionsdaten aus digitalen Gesch¨ aftsprozessen (wie Eink¨ aufe in Online- Shops, Nutzungsinformationen von Video- oder Musik-On-Demand-Anbietern, App-Nutzungsdaten), Kommunikationsdaten (z.B. Schriftverkehr, Chatproto- kolle) bis hin zu Sensordaten aus Industrieanlagen oder Smart-Home-Ger¨ aten.
Im Internet ist zudem eine große Anzahl von Datenquellen entstanden, welche frei nutzbar sind. Beispiele hierf¨ ur sind geographische Informationen (z.B. aus der frei editierbaren Landkarte OpenStreetMap), Wetterdaten und ¨ offentliche Statistikdaten.
Aus praktischer Sicht suchen Unternehmen nach neuen Gesch¨ aftsmodellen und Wegen, wie sie die steigende Menge an Daten kommerziell nutzen k¨ onnen. Aus dem Blickwinkel der Forschung ist es n¨ otig, den Daten-Wertsch¨ opfungsprozess besser zu verstehen und Erfolgsfaktoren sowie Hindernisse f¨ ur diesen Prozess zu identifizieren. Mit der besseren Kenntnis dieses Prozesses kann ¨ okonomischer,
¨
okologischer und sozialer Wert aus der wachsenden Menge an Daten geschaffen werden.
Der Bedarf an empirischer Forschung in diesem Bereich wird aus der j¨ ungsten
Informationssystemliteratur deutlich. Bisher fehlt n¨ amlich eine umfassende Er-
kl¨ arung, wie man aus den verf¨ ugbaren Daten erfolgreich Wert schaffen kann. Fest
steht, dass Wert nicht automatisch aus der bloßen Nutzung von Daten entsteht,
sondern ein komplexer Prozess zugrunde liegt, bei dem zun¨ achst Erkenntnisse
aus Daten gewonnen werden und infolgedessen sachkundigere Entscheidungen
m¨ oglich sind, die dann schließlich Wert schaffen k¨ onnen. Verfahren des maschi-
nellen Lernens (ML), eine Klasse von Methoden aus dem Bereich der k¨ unstlichen
Intelligenz die Muster aus Daten ableitet, haben besonderes Potential, die große
Menge an Daten so aufzubereiten, dass daraus Erkenntnisse entstehen, durch
welche bessere Entscheidungen Wert schaffen k¨ onnen.
Kurzzusammenfassung
In meiner Dissertation habe ich mich mit der Beantwortung von f¨ unf zentralen Forschungsfragen zu Predictive Analytics im Rahmen des Daten-Wertsch¨ opfungs- prozesses besch¨ aftigt. Die aus der Arbeit resultierenden Kernbeitr¨ age sind nach- folgend genannt und tragen zu einem besseren theoretischen Verst¨ andnis ¨ uber die Wertgenerierung aus Daten mit Hilfe von ML-Verfahren bei. Erstens wur- de, basierend auf einer systematischen Literaturrecherche in Zeitschriften der Informationssystemforschung, eine ¨ Ubersicht ¨ uber firmeninterne und externe Datenquellen f¨ ur m¨ ogliche Datenanalysen erstellt. Diese ¨ Ubersicht wurde mit den Erfahrungen von sieben Fallstudien (zwei davon sind in dieser Dissertati- on im Detail ausgef¨ uhrt) validiert sowie erweitert und gibt Unternehmen die M¨ oglichkeit, ihre Datenbest¨ ande zu inventarisieren oder Datenquellen f¨ ur die Analyse zu identifizieren. Zweitens stellt die Arbeit anhand von acht Beispielen dar, wie die kognitiven F¨ ahigkeiten des Menschen, Theorie und Expertenwissen helfen k¨ onnen, Daten effektiv f¨ ur ML-Anwendungen aufzubereiten, auch wenn zahlreiche automatische Verfahren existieren, um Daten f¨ ur die weitere Analyse vorzubereiten. Die Erkenntnisse unterstreichen, dass Experten ben¨ otigt werden, um automatische Datenanalyseverfahren aufzusetzen und effektiv zu kombinie- ren. Diese Fachkr¨ afte m¨ ussen ausgebildet und gef¨ ordert werden. Drittens wurden aktuelle ML-Algorithmen zur Klassifikation und Variablenselektionsmethoden mithilfe von realen Datens¨ atzen aus dem Energievertrieb empirisch verglichen.
In der Arbeit werden daraus Empfehlungen f¨ ur den Einsatz von Datenanaly- sen in Energieunternehmen abgeleitet. Hierbei wird insbesondere deutlich, dass sich eine geringere Detailtiefe in Rohdaten oder eine unterschiedliche geogra- phische Lokation der Trainings- und Testdaten zwar negativ auf die Vorher- sageg¨ ute auswirkt, der Einfluss jedoch nicht so stark ist, dass dieser am Ende den Erfolg von pr¨ adiktiven Systemen beeintr¨ achtigt. Schließlich wird der erfolg- reiche Einsatz der gewonnenen Informationen durch ML-Anwendungen anhand von zwei Fallstudien, welche in der Dissertation beschrieben werden, aufgezeigt und der Insight-to-Value Schritt an den Beispielen des automatisierten Ener- giefeedbacks und des Beziehungsmarketings aufgezeigt. Die beiden Fallstudien im Fokus dieser Dissertation basieren auf realen Daten von Energieanbietern aus Deutschland sowie der Schweiz und decken alle Prozessschritte des Daten- Wertsch¨ opfungsprozesses ab.
Die Energiebranche bietet sich f¨ ur die durchgef¨ uhrte Forschung an, da der Be-
darf an datengetriebenen Innovationen dort besonders hoch ist: Energieanbieter
m¨ ussen einerseits in zunehmend liberalisierten M¨ arkten wettbewerbsf¨ ahiger wer-
den, sind jedoch andererseits durch den Gesetzgeber angehalten, ihre Kunden f¨ ur
einem bewusst sparsamen Umgang mit Energie zu motivieren. Dar¨ uber hinaus
m¨ ussen sie die Akzeptanz von nachhaltigen—oft teureren—Energieprodukten
steigern und neue Gesch¨ aftsfelder erschließen, um die Transformation der Ener- giewirtschaft, welche sich aus der Energiewende ergibt, umsetzen zu k¨ onnen.
Andererseits verf¨ ugen Energieanbieter ¨ uber eine große Kundenbasis und haben Zugriff auf eine zunehmende Menge an Daten (z.B. aus intelligenten Stromnet- zen).
In der ersten Fallstudie, die in dieser Arbeit dargestellt wird, wurde die Erken- nung von Haushaltseigenschaften in Bezug auf die Energieeffizienz (z.B. Hei- zungstyp, Alter des Hauses, Anzahl der Bewohner, Kinder im Haushalt) aus Energieverbrauchsdaten zusammen mit frei verf¨ ugbaren Daten mit Hilfe von ML-Verfahren untersucht. Die Kenntnisse ¨ uber solche Merkmale lassen sich nut- zen, um Energieeffizienzkampagnen zu personalisieren und damit wirkungsvol- ler zu gestalten (z.B. durch haushaltsspezifische Sparempfehlungen, sowie Last- absch¨ atzung und -verschiebung).
Die zweite Fallstudie behandelte die Erkennung von Kundeneinstellungen und - verhalten (beispielsweise die Einstellung zu Energieeffizienz, die Kaufbereitschaft von Photovoltaikanlagen oder neuen Produkten von Energieanbietern). Mit Hilfe der erm¨ oglichten Vorhersagen k¨ onnen neue Produkte und Dienstleistungen im Energiebereich entwickelt sowie zielgerichteter vermarktet werden.
Durch den Einsatz von ML-basierten Datenanalysen im Energievertrieb kann
somit die Energieeffizienz im Privatsektor verbessert, der Kundenwert gestei-
gert und die Servicequalit¨ at verbessert werden. Die Dissertation zeigt damit
schlussendlich auf, wie ¨ okonomischer, ¨ okologischer und sozialer Wert aus Daten
generiert werden kann und ist damit eine Blaupause f¨ ur weitere Branchen.
Acknowledgements
This dissertation is a result of my work as a researcher at the Chair of Infor- mation Systems and Energy Efficient Systems at the University of Bamberg (Germany) in the period from 2015 to 2019 and my visiting stay at the Copen- hagen Business School (Denmark) in 2018. My work was enriched by projects and studies in the context of the Bits-to-Energy Lab, a joint research initiative of the ETH Zurich, the University of St. Gallen, and the University of Bamberg that also involved industry partners.
Foremost, I want to express my sincere gratitude to my doctoral advisor Thorsten Staake. He has provided me guidance, support, and honest feedback, ever since I started working as a research assistant in 2014 and wrote my Mas- ter thesis at his group. Thorsten inspired me to create new ideas and think out the box through his open mind which overarches many disciplines. Next, I want to thank Ioanna Constantiou. Far more than enabling my research stay at the Copenhagen Business School, she helped me to better understand the Information Systems research discipline and to more clearly identify the theo- retical contribution of my, so far, rather applied research. I also thank Mariya Sodenkamp, for being a mentor between 2014 and 2016.
Research is a collaborative effort. Therefore, I want to deeply thank my col- leagues and peers at the Bits-to-Energy-Lab. First of all, Ilya Kozlovekiy, Liliane Ableitner, and Andreas Weigert. It was a pleasure to work with you on several studies and research projects that covered significant parts of my work. Without our teamwork, the entire work would not have been half as exciting. Next, I would like to thank my colleagues and the cohort of PhD students at the Chair of Information Systems and Energy Efficient Systems at the University of Bam- berg for their friendly support and the nice work environment: Anna Kupfer, Sarah Appeldorn, J¨ urgen Wenig, Samuel Sch¨ ob, Sebastian G¨ unther, Viktoria Hirschfeld, and Carlo Stingl. Beyond the boundaries of our group in Bamberg, I would like to thank Verena Tiefenbeck for many interesting discussions and the exchange. It was also great opportunity to be in contact with the research groups around Elgar Fleisch at the Chair of Information Management at ETH Zurich and at the Chair of Operations Management at the University of St.
Gallen. All doctoral consortia in which I participated were advantageous.
Acknowledgements
Furthermore, I was fortunate to collaborate with excellent students on their Master thesis topics that we managed to continue. These research ideas have always been a source of inspiration, and we managed to translate some curious ideas into scientific contributions. So, many thanks to Michael Kormann, Sascha Riechel, Carlo Stingl and Felix Jungmann.
My work was only possible through the financial support of public funding bodies and industrial partners who shared much resources and provided practi- cal experience. My work was financially supported by the Swiss Federal Office of Energy (grant numbers SI/501053-01 and SI/501202-01), the Swiss Commission for Technology and Innovation (grant number 16702.2 PFEN-ES), and the Eu- ropean Commission and member countries (grant number E!9859). I thank the industry partners, especially the whole BEN Energy team for the amazing and fruitful cooperation, in particular, Tobias Graml, Jan Marckhoff, Claire-Michelle S´ evin, Matthias Dhum, Lutz Gegner, Sarvesh Dwivedi, and Simon Tietze. In re- gards to the utility companies, I particularly appreciate the cooperation with Ar- bon Energie AG, Werkbetriebe Frauenfeld and Centralschweizerische Kraftwerke AG.
Finally, I want to express my heartfelt thanks to my family and friends. Most
of all, I would like to thank my dear wife, Julia, who has taken on much to
support me in realizing my dreams, this dissertation in particular. She supports
me always and is my best advisor. I further thank my parents and brothers
for all the confidence and backing. I also thank my friends on whom I can
always rely, especially Martin Radenz, Christian Lang and Haley Culpepper for
feedback on this dissertation from an outsider’s perspective. Without all your
support, I would have never started and finished this endeavor. Thank you so
much for everything!
1 Introduction and motivation
Digitalization is advancing in commercial as well as private en-
Massive amounts of diverse data are createdthrough digitalization
vironments. Electronic devices in firms and at home are in- creasingly equipped with network connections and produce large amounts of data that contain valuable information. Information Technology (IT) and the Internet of Things will enable smart cities and make life in urban environments more efficient, sustain- able, and resilient (Brandt et al. 2018). The energy system will be soon connected through a smart grid to meet the requirements for a stable and sustainable energy supply (Ketter et al. 2018).
At home, sensors and automatic controls for lighting, household appliances, heating, and air conditioning will take over routine tasks. Digitalization thus generates data that are not only huge in numbers, but also diverse in nature (Hashem et al. 2016). It is a great challenge to process this data in a meaningful and value-adding way. To illustrate the magnitudes of data that are already being processed by
.Information Systems (IS) today, onecan take a look at large enterprises: Walmart, a retailing firm, is said to process 2.5 petabyte
1of data every hour (Marr 2017).
The above mentioned examples give an idea on how IT is be-
The data contain details on living conditions and behaviorcoming more embedded and omnipresent in our life. Sensors will be nearly everywhere and the acceptance of connected devices in broad areas of life will increase further, because interaction between humans and IT devices continuously improves and will run even more smoothly in the future. This development leads to the fact that detailed data about peoples’ living conditions, habits, and behavioral patterns are recorded. Therefore, individ- uals voluntarily disclose—wittingly or unwittingly—information
1One petabyte stands for 1015 bytes.
1 Introduction and motivation
that was previously difficult to collect while using smartphones, smart watches, voice controls, etc.
Newspapers and consultancies recon that data are the “new oil”, or the “new gold”, and describe thereby the prospects as- cribed to them. Though these analogies have weaknesses, oil was the business enabler for a century, and data have the poten-
Data have high strategic relevance for firms, but realizing value from raw data is difficult
tial to be it for the current one (The Economist 2017; Bergers and Meijerink 2017). Data are advantageous sources for business model innovations and the development of data-driven services.
According to a recent investigation by Hartmann et al. (2016), a majority of startups rely on business models that use data as resources. The relevance of big data for corporate strategy is well recognized from research (Constantiou and Kallinikos 2015; Yoo 2015; Kallinikos and Constantiou 2015). Moreover, the World Economic Forum (2011) describes personal data as a “new asset class” due to its economic value for firms and the global political agendas concern about the use of personal data
2.
The value of data—an intangible asset—is hard to estimate, considering the fact that a piece of data can be useless for one
ML can bridge the data-value gap
application, but highly relevant for another. However, methods of Machine Learning (ML) and predictive analytics are powerful tools for realizing value from data. This was shown in a num- ber of insightful studies. In the
banking industry, for example,credit card fraud can be detected from payment transaction data
Successful ML applications in the banking, aviation, tele- communication and retail industry
(Bhattacharyya et al. 2011). Martens et al. (2016) analyze simi- lar data to obtain the customer interest in financial products, and machine learning is successfully used for credit scoring (Kruppa et al. 2013). Shi et al. (2017) identify the source of incidents in the
aviationbusiness. In
retail, G. Cui, Wong, and Wan (2012) iden-tify high-value customers in marketing campaigns, Shrivastava and Jank (2015) predict customer spending during promotional events. In the
telecommunicationbusiness, interaction data of cell phone users are utilized to predict the customer’s insolvency risk (Daskalaki et al. 2003) or contract cancellation (Backiel et al. 2014; Braun and Schweidel 2011).
2The European Commission (2017) works on rules for a “European Data Economy” and the G20 countries works on a world-wide digital political agenda (OECD 2017).
1.1 Ambient data as a new source for analytics Despite its success, initial euphoria about rapid gains from ap-
This workexamines the reasonable use of ML on data available to organizations
plying ML to data has faded. Companies as well as researchers have realized that the simple application of algorithms to inter- nal business data does not necessarily bring sustainable value or competitive advantage. Reasons for this disenchantment are, among others, the awareness that ML is not a universal remedy for all problems, that the quality of predictions is sometimes not sufficient enough for real applications, that high quality data are needed for successful predictions, that detailed domain knowledge is required to understand the data, and that expert knowledge is needed in order to apply algorithms correctly and evaluate the results. To foster the meaningful use of ML on data that are available to organizations, which I refer to as
ambient data, thisdissertation answers five research questions along the data value creation process. Two case studies from the energy retailing in- dustry serve as empirical base for the investigation.
The remainder of this chapter first introduces ambient data
Following sections introduce the research topic and outline the content of this dissertationas a new source for analytics. Second, the research topic of this dissertation—the value creation from ambient data with the help of machine learning—is outlined and the research questions are presented at a glance. Thereafter, the two case studies from the energy retailing industry are presented which are adduced to answer the research questions. Finally, the structure of the dissertation is shown and the contents of the individual chapters briefly summarized.
1.1 Ambient data as a new source for analytics
Successful examples, in which the value-realization from data
Showcases of data analytics, so far, often rely only on structured and firm-internal datathrough ML is already showcased, are often limited to the use
of firm-internal business data. These data are typically avail-
able in structured formats (relational databases, spreadsheet files,
etc.), well embedded into business processes, and organized to
specifically support the business context. Characteristics of firm-
internal business data are listed in Figure 1.1 (right box). Busi-
ness processes that stem from the pre-digital era have most likely
1 Introduction and motivation
been supported by IS at some point. New business models were directly set up with respective IS support, for example, as an e- commerce platform. The data resulting from both types of busi-
Ambient data are often by-products business activities
ness processes are well-aligned with the business goals and stored in databases with structured formats. This makes the inclusion of internal business data in analytics relatively easy. Besides the well-structured internal business data, we are currently wit- nessing the emergence of several
.ambient datasources. These datasets are by-products of pursued business activities and of- ten not essential for the fulfillment of contracts. Nevertheless, they have high relevance for data-driven innovations when new insights are to be generated from data. Examples for ambient data are high-frequent transaction data (e.g.,
.smart meter datain the utility industry, payment transaction data, music streams listened, or purchase data from Internet of Things devices like the Amazon dash button
3), internal data on business processes (e.g., modification logs of files or database records), or communication data (e.g., call-center notes, e-mails).
I describe three reasons why organizations collect such ambient
Reasons why firms collect ambient data
data below, together with examples. This list of reasons is most likely not exhaustive:
I
Firms
start to collect datain the context of their existing product portfolio
to develop additional services or new busi- ness models. Home appliances, for instance, are increasinglyequipped with an internet connection and come with smart- phone apps that allow controlling the devices remotely, or connect them into the smart home environment. Data- logging in industrial machinery or vehicles helps to collect data for predictive maintenance and services around physi- cal products. With additional data, heating manufacturers
3The Amazon dash button is a small WiFi connected device to quickly or- der products. It can be, for instance, placed next to the washing machine to re-order washing powder. With such a device, orders are recorded not only when the customer remembers to buy a consumer good, but also when the good is consumed. This timestamp may contain much informa- tion on the customers’ behaviors and living situations, considering the ordered good.
1.1 Ambient data as a new source for analytics
Figure 1.1: Characteristics of ambient data and classical business data; the goal of this work is to investigate how ma- chine learning can be used to harness ambient data in business applications
are not only able to sell a heating installation, but the ser- vice of having a warm home. Truck manufacturers can not only sell lorries, but the guarantee of goods being trans- ported from one location to another.
I
Data have already been incurring through business pro- cesses and can be used for
different purposes. Communi-cation data are stored in mail servers, communication logs (e.g., in messengers, e-mails, call-center notes), and trans- action data exist in several databases (e.g., time stamps of order placements or payment transactions).
I
Organizations are mandated to collect data because of
legal requirements. This is, for instance, the case in the utility in-dustry where smart meters for electricity must be installed.
Another example is the requirement for workers to “clock in” that became necessary because of minimum wage law.
The use of data that firms are obligated to collect, or have collected for various reasons in the past is often dedicated to a purpose. In the case of personal data, the consent of the data subject must be collected to meet data protection regulations.
This consent should be feasible to obtain when the data analysis
also benefits the data subject.
1 Introduction and motivation
In addition to ambient data accumulated
withinfirms, there
Ambient data also include public or open data sources
are multiple origins of such publicly available data. Governments, for example, publish public sector information (e.g., weather data, public statistics, satellite images). In addition, many websites ex- ist that contain publicly accessible content and users create web portals with large amounts of crowd-sourced data—often hav- ing geographic locations associated. These data are known as
Open and public data have often a geographic reference
Volunteered Geographic Information (VGI) and offer informa- tion on various subjects, even for some on which data was never collected before (Goodchild 2007; Sester et al. 2014). Geographic data contain information on the living conditions, gentrification, etc. Examples for such VGI initiatives are OpenStreetMap
4, Geo- caching
5, and Runtastic
6.
Ambient data offer great opportunities for firms to create new
Ambient data come with opportunities and challenges
data-driven innovations. Nevertheless, they have several charac- teristics that make them distinct from (classical) business data.
These characteristics are illustrated in Figure 1.1. First, the in- formation is represented in unstructured or weakly structured formats (e.g., text, log messages, time series data). When it is stored in a structured format, the representation is often insuffi- cient for the use in contexts that are different from those for which the data were initially collected. Second, the data contain
latentThe data contain latent information on behavior, living conditions, etc.
information, for instance, on the behavior, living conditions and
socio-demographic characteristics of customers. This makes the data highly interesting. Third, it contains “noise”, irrelevant or missing data points, requiring advanced data processing tech- niques to prepare the data for further analyses. Fourth, the data often have only a weak reference to business entities. This means that the geographic location must be used to connect public data to customer entries in corporate databases, or date and time must be used to connect calendar data or environmental observations.
In contrast, data concerning customers can be attributed via a unique customer number.
4Free world map that is editable by everybody, available at http://www.
opentreetmap.org.
5Outdoor game where players seek and hide containers at different geo- graphic locations using Global Positioning System (GPS) devices.
6GPS fitness tracking app that allows to upload and ahare running tracks.
1.2 Research goal: Value creation from ambient data through machine learning
1.2 Research goal: Value creation from ambient data through machine
learning
Several research efforts on how the value from data can be re-
This work supports the so-far rather conceptual research on big-data value-creation with empirical findingsalized have already been undertaken in IS research, as G¨ unther et al. (2017) observe in a comprehensive literature review. The authors come—in accordance with Markus (2017)—to the con- clusion that research on this topic has been mostly conceptual, so far. They call for more empirical research regarding the value- creation from data. I follow this call in my dissertation and explore,
how machine learning can be used to harness ambient data in business applications and thus, create new insights from data. These insights can be used to realize value from datasets.The complex process to create value from data was concep- tualized and divided into several stages. Sharma et al. (2014) consider the
data to insight, the insight to decision, and the de- cision to valuestage. In other works, this resulting process is also called “information value chain” (Abbasi et al. 2016; Kout-
soukis and Mitra 2003). Thiess and M¨ uller (2018) argue that the
Data-driven decision making process as outline of this dissertation“data-driven decison making“ process should start with a ques- tion and expand the information value chain by the stage
question to data. Using this process model (illustrated in the top part ofFigure 1.2), the complex issue to investigate the value creation from data can be broken down in a research agenda.
I formulate five Research Questions (RQs), adhering to this
Five Research Question (RQ)process, and use the stages as a structure for my dissertation.
The RQs are listed in Table 1.1 to give an overview to the work.
A detailed motivation of each RQ, the underlying challenge and their relation to literature are described in the introductory part of the respective chapters as described below.
Chapter 3 focuses on available data sources for business analyt-
ics and answers RQ 1 in its first part. In the second part, prepa-
ration of raw data to usable data points (features) is described
and advantages as well as pitfalls of automatic and theory-driven
feature extraction is compared (RQ 2). Chapter 5 describes avail-
able datasets for both case studies and answers RQ 3. The last
1 Introduction and motivation
Figure 1.2: Research questions (RQs) covered in this dissertation and their positioning in the data-driven decision mak- ing process
two application-related RQs are answered in chapter 6 and 7 re- spectively. The contents of these and the remaining chapters are summarized in section 1.4.
Figure 1.2 illustrates to which step of the data-driven decision
making process the RQs belong, and to which context the find-
ings mainly contribute. The core results of my research for each
step of the data-driven decision making process are summarized
in section 8.1 on page 193. The following section introduces the
empirical context of energy efficiency and energy retailing, and
describes two case studies that are the base of the empirical in-
vestigation pursued in this thesis.
1.2 Empirical research in energy efficiency and energy retailing
Table 1.1: Research questions and chapters at a glance
Research question (RQ) Chapter
RQ1 Which data sources are considered in predictive analyt- ics IS research studies, which typically exist in firms or are publicly available, and what are characteristics of the data sources?
3
RQ2 Does theory, expert knowledge and human cognition no- tably help to reduce data dimensionality, although sev- eral computational methods exist for this task?
3
RQ3 How well can (a) customer characteristics and (b) in- tentions be revealed from ambient data, in the context of energy retail, using state-of-the-art ML methods?
5
RQ4 Which added value can be realized from predicted cus- tomer characteristics on the example of personalized en- ergy feedback?
6
RQ5 Which added value can be realized from predicted cus- tomer intentions on the example of relationship market- ing?
7
1.3 Empirical research within the the context of energy efficiency and energy retailing
The research conducted in this dissertation uses energy retailers
Case studies from energy retailing in Germany and Switzerlandin Switzerland and Germany as empirical context. This estab- lished industry is as relevant as ever, given that it provides power to other companies and individuals, without which many activi- ties of our modern society would not be viable. Energy retailers posses manifold ambient data sources (like electricity smart meter data), and can use public data (like weather data or geographic information) together with their owned data.
Through the energy context of this dissertation, I position my
Green IS and energy informatics researchresearch in the tradition of
Green IS, following Melville (2010)and R. T. Watson, Boudreau, et al. (2010), as well as in the field of
energy informatics(Goebel et al. 2014; Gholami et al.
2016; Ketter et al. 2018). Thereby, I investigate how IS can
help to obtain new insights on energy consumers that can be
1 Introduction and motivation
used to promote energy conservation in the residential sector, and to disseminate sustainable energy technology among private customers (through the identification of market potentials).
In this section, I first give an overview to the electricity market, outline current challenges in electricity retail and describe how data-driven innovation can help firms to cope with the challenges.
Second, I introduce the two case studies that are used to answer RQ 4 in chapter 6 and RQ 5 in chapter 7.
1.3.1 Electricity retail market: Current challenges and opportunities
Electricity is a commodity of our everyday life, but it is a good that can not be stored, like food or other tangible goods. In fact, the generation of electricity and its consumption must be synchronized. Multiple players ensure that electricity—meaning both: power (measured in Watt) and amount of energy (power over time, usually measured in kWh)—is delivered across the production and supply chain to private customers.
In
monopolymarket settings (e.g., Switzerland currently), one
Depending on the sales region, utilities act in monopoly and liberalized markets
regional player controls the whole centralized generation of elec- tricity (e.g., in coal-fired, nuclear or water power plants), the distribution of electricity via the grid network, and the delivery to industry or private customers with all electricity procurement and billing. In
liberalizedmarkets (such as the EU, US, Australia, Japan and Singapore) grid operation is separated from electric- ity trading. This enables competition between utility companies.
The process of deregulating the electricity market has taken place in the mentioned countries from 1990 on. It led to the fact that many utility companies that possessed a monopoly market po- sition before needed to split up into grid operation and energy trading firms. Private customers were finally able to switch their electricity supplier without changing the physical connection to the grid, as it is for example the case in some telecommunication industries worldwide.
Both market settings are affected these days by groundbreak-
Severe challenges exist in both markets
ing market transitions, changing the way energy will be produced
and used in the future. These market transitions in the electric
1.3 Empirical research in energy efficiency and energy retailing utility industry become visible considering the energy produc-
tion, grid operation and energy retailers perspective, whereas I focus here on the energy retailers’ perspective. Energy retailers in
Europe operate in a market that is not growing, but competitive.
Highcompetition on EU’s energy retailing market
The share of wallet for housing, water and energy remains nearly constant during the last 20 years at 20-25% (Eurostat 2017). This market cannot be expected to rise strongly in the future, as en- ergy efficiency will be increased and thus less energy is demanded.
Moreover, high churn rates in the energy retailing industry exist, for example in Germany 6.4% in 2015 (BNetzA 2016, p. 184), or in Norway 12.7% in 2014 (NordREG 2017). In countries with a market that is still characterized by regional monopolies, upcom-
ing market liberalizations is a specter for utility companies (e.g.,
Energy efficiency regulations reinforces burdens on energy suppliersin Switzerland the market liberalization was postponed multiple times) and may obviously cause radical changes in their business (Markard and Truffer 2006). In addition, utilities are mandated to implement energy efficiency programs and regulations in the residential sector. The policies range from incentives for efficient behavior and subsidies for energy-efficient construction (BMUB 2014) to stronger regulatory instruments, like decoupling.
7Along with this development, the European Energy Efficiency Direc- tive forces energy retailers to achieve 1.5% energy savings per year through the implementation of efficiency measures in the residential sector (EU 2012).
Besides the mentioned challenges that utility companies are
still aware of, there are some new players potentially entering
New players in the energy market emergethe electricity retail market, that have the capability to funda- mentally change the game for many utility companies and call the existence of classical energy retailers in question. For example, Drift
8, a community-based start-up providing sustainable energy
7Decoupling is an instrument of utility regulation (in place in some U.S.
states), where a utility’s profits are disassociated from energy commodity sales. Instead, the returns are aligned with meeting previously defined revenue targets and are adjusted at the end of a previously defined period (Lazar et al. 2016; Eto et al. 1997). With this approach, policy makers try to enforce, for example, energy efficiency among energy consumers, or distributed energy generation.
8https://www.joindrift.com/, last accessed 10.09.2018
1 Introduction and motivation
to end-customers in New York City. It uses algorithmic trading of electric energy between producers and end-consumers. In 2017, this platform traded 517,140kWh and saved their customers, by their own account, approximately $26,000 (which equals to 5 ct per kWh). Such data and community driven organization can
Online platforms ans smart home vendors enter the energy market
make traditional energy retailers obsolete. Additionally, a cou- ple of smart home energy management systems have been de- veloped. The most prominent example is the smart thermostat
“Nest”, a start-up recently acquired by Google. The smart ther- mostat controls the heating by learning from the behavior of its user. Substantially integrated in a smart energy grid, this may have significant influence on the way energy is consumed in pri- vate homes. Owed to the demand of residential customers for autarky, some experiments are made with micro-grids combining local energy producers and consumers to self-sufficient units that may have only a connection to the national grid as a fallback- option. Finally, carmakers, governments, and firms are search- ing for business models to implement electric vehicle charging infrastructure. This may also have a significant impact on the
Established utilities experiment with new business models
electricity market, since joint-ventures of these three parties are likely to become substantial players. A few energy providers are experimenting with new business models. Some offer energy con- sulting, thermography services, services around electric mobility, products in the smart home market, or fibre-optic internet access.
Others enter the market for photovoltaics or heat pumps. These examples are initiatives of some energy suppliers. No superior strategy has yet emerged.
For all these new offers, firms rely on detailed knowledge about
Detailed customer knowledge is essential for new energy products and services