The neuronal substrates of reinforcement and punishment in Drosophila melanogaster
DISSERTATION ZUR ERLANGUNG DES
DOKTORGRADES DER NATURWISSENSCHAFTEN (DR. RER.NAT.) DER FAKULTÄT FÜR BIOLOGIE UND VORKLINISCHE MEDIZIN
DER UNIVERSITÄT REGENSBURG
vorgelegt von Christian, Rohrsen
aus
Algeciras, Spanien
im Jahr
2019
Das Promotionsgesuch wurde eingereicht am:
01.03.2019
Die Arbeit wurde angeleitet von:
Prof. Dr. Björn Brembs
Unterschrift:
Christian Rohrsen
Table of contents
Table of contents ... 2
Abstract ... 4
1 Introduction ... 6
1.1 Neural plasticity... 6
1.2 Reward and dopamine ... 6
1.3 Reward Prediction Error (RPE) ... 8
1.4 Pavlovian/Classical and Operant/Instrumental conditioning ... 9
1.5 Pure operant learning ... 11
1.6 Drosophila as a laboratory model: optogenetics ... 12
1.7 Aim of the study ... 13
2 Methods ... 15
2.1 Fly genetics ... 15
2.2 Fly care and reagents... 15
2.3 T-maze ... 16
2.4 Y-mazes ... 17
2.5 Joystick ... 19
2.6 Data analysis ... 20
2.7 Neuronal clusters valence estimation ... 22
2.8 Anatomical characterization ... 22
3 Results ... 23
3.1 Driver lines expression analysis ... 23
3.2 T-maze screen with red light ... 24
3.3 T-maze screen with yellow light ... 25
3.3.1 Negative-effects screen simulation ... 27
3.4 Y-mazes Screen ... 27
3.5 Joystick screen ... 29
3.6 Context-dependency: Effect on the mean and variance ... 30
3.7 Context-independent reinforcers ... 31
3.8 Estimation of the valence of dopaminergic clusters ... 32
3.9 Anatomical characterization of the context-independent reinforcers .. 34
3.10 Optogenetic inhibition of dopamine neurons ... 35
4 Discussion ... 36
4.1 The neural circuits underlying classical and operant conditioning ... 36
4.1.1 The role of the MB ... 36
4.1.2 Reinforcer versus Unconditioned stimulus ... 36
4.2 Reinforcement substrates in Drosophila melanogaster ... 38
4.3 Centralized versus distributed behavioral control ... 41
4.4 Operant activity versus conditioning ... 44
4.5 Evolutionary effects of dopamine in valence and locomotion/arousal 45 4.6 Technical constraints and outlook... 47
4.6.1 Optogenetics ... 47
4.6.2 Experimental design and analysis ... 48
4.6.3 Outlook ... 50
5 Conclusion ... 51
6 Bibliography ... 52
7 Attachments ... 64
7.1 Figures ... 64
7.2 Tables ... 67
8 List of figures ... 70
9 List of tables ... 71
10 Acknowledgements ... 72
11 Eidesstattliche Erklärung ... 74
Abstract
Actions are followed by consequences, to which values are assigned. These subjective values shape our future actions in what we colloquially call “learning by doing”.
But how does the assignment of values to behavioral consequences occur in the brain? In mammals as well as in three different superphyla within protostomes (Nematoda, Platyhelminthes and Mollusca) this is mediated by dopamine. However, little is known about the neural basis of value assignment to behaviors in the Arthropoda. In order to address which neurons convey punishment and reinforcement in insects, we performed four different experiments in which flies (Drosophila melanogaster) could control the on/off state of different subsets of dopaminergic neurons. We found that the effects of these neurons across operant (feedback) conditioning have no relation to their role observed in previously well studied pavlovian (feedforward) conditioning. These results suggest fundamentally different neuronal circuits dedicated to operant and pavlovian learning processes. The reinforcing value of most of the tested neurons is context dependent and differs among the tested operant paradigms. However, there are two exceptions: two different cell clusters projecting to different neuropils in the central complex (CX) and accessory regions, a brain area involved in multisensory integration and action selection, seem to be responsible for the reinforcement of motor commands in a context-independent way. These findings support a conserved mechanism of dopaminergic reinforcement in higher order motor centers across phyla.
Introduction 6
1 Introduction
1.1 Neural plasticity
Homeostatic regulation in the brain allows adaptation to a changing environment, which is essential for survival. Past experiences are integrated into neural processing and decisions are taken according to the instantaneous environmental and internal context (Devan et al., 2018; Margulies et al., 2005; Rescorla & Wagner, 1972.; Solanki et al., 2015).
Decisions are probabilistically influenced by evidence accumulation, which in rodents is encoded in dopaminergic neurons and dorsal striatum (Graybiel, 2016; Lak et al., 2016;
Yartsev et al., 2018) whereas in flies the αβ lobes in the mushroom bodies (MB) integrate evidence over time for olfactory discrimination (Groschner et al., 2018). When an individual interacts within its habitat, it can learn about environmental contingencies as well as from the outcome of its actions. These learned associations are stored as probabilities which are continuously updated by new information (Fiorillo et al., 2003; Nassar et al., 2010; Zhou et al., 2018).
Formed associations are the scaffold for creating a model representation of the surrounding environment to be able to predict from past events and assess the changing conditions for its own adaptation (Cognigni et al., 2018; Devan et al., 2018; Heisenberg, 2015; Li, 2014; Margulies et al., 2005; Menzel et al., 2007; Seidler et al., 2013). Error discrimination allows an individual to know when behavior optimization is under its own control (Inoue & Kitazawa, 2018; Nassar et al., 2010; Seidler et al., 2013; Wolf &
Heisenberg, 1991; Zhou et al., 2018). That means that the brain actively evaluates the confidence in the formed associations and distinguishes whether unexpected discrepancies are due to its own motor coordination or due to environmental stochasticity. Confidence is an estimation of the uncertainty of the formed associations and in mammals it is is encoded by several neurotransmitters throughout the brain: dopamine, serotonin, noradrenaline and acetylcholine (Fiorillo et al., 2003; Yu & Dayan, 2005). The ability to recall past experiences is essential for organisms to take proper decisions. The brain has evolved to dynamically update value to actions and stimuli that affect fitness (Graybiel, 2016; Paton & Louie, 2012).
This valuation is the teaching signal that leads to learning by maximizing reward and minimizing punishment.
1.2 Reward and dopamine
From the ancient Greek through the Middle Ages to modern philosophy, the meaning of reward and its biological relevance has attracted a lot of interest. These reflections were
7 Introduction not based on brain physiology but mostly limited to observations and behavior (Marks, 2011).
There are two main paradigms for studying the physiology of hedonia: self- stimulation and conditioned place preference. The self-stimulation paradigm was developed by Olds and Milner in 1954 (Olds & Milner, 1954), and the idea behind this paradigm is that animals control the presentation of the stimulus with their own behavior. In that particular case, rodents could press a lever that was connected to a stimulation electrode placed in a certain brain region. Olds and Milner found by serendipity regions in the septal area which rodents would stimulate to the point of replacing other natural rewards like food consumption. The lateral hypothalamus, the median forebrain bundle and the dopaminergic mesolimbic system yielded the highest lever pressing rates (Paton & Louie, 2012; Wise, 2002). In conditioned place preference paradigms animals are previously conditioned with an appetitive/aversive stimulus to avoid/approach a certain place and it generally requires less training in rodents (Prus et al., 2009; Simon et al., 2009).
Although dopamine was traditionally considered to be the hedonic neurotransmitter, its function is much more varied. Self-stimulation experiments and locomotor activity measurements during differential activation of neurons expressing D1- and D2 dopaminergic receptors indicate that hedonic feelings share common dopaminergic and basal ganglia circuitry with the control of motor activity (Kravitz et al., 2012; Kravitz & Kreitzer, 2012). The basal ganglia are an essential center for motor control where the direct and indirect pathways have been traditionally seen as opposing forces for gating voluntary and involuntary movements. The direct pathway, mediated by dopaminergic receptors of type D1, increases movement and mediates positive reinforcement and reward. On the other hand, the indirect pathway, mediated by type D2 receptors, decreases movement and mediates punishment and aversion (Kravitz et al., 2012; Kravitz & Kreitzer, 2012; Paton &
Louie, 2012; Saunders et al., 2018; Wise, 2002).
Dopaminergic neurons in the fruit fly are also responsible for heterogeneous functions, including reward in different classical conditioning assays (Aso et al., 2010, 2012;
C. Liu et al., 2012; Vogt et al., 2016). Other tasks involve locomotion, sleep/arousal regulation, encoding of energetic state, novelty, hunger, thirst, electric shock, etc., and induce learning, memory and forgetting (Aso & Rubin, 2016; Barron et al., 2010; Berry et al., 2015; Cognigni et al., 2018; Cohn et al., 2015; Hattori et al., 2017; Hu et al., 2018; Krashes et al., 2009; Lin et al., 2014; Owald, Felsenberg, et al., 2015; Perry & Barron, 2013;
Riemensperger et al., 2011; Sitaraman et al., 2015; Tschida & Bhandawat, 2015).
Introduction 8
1.3 Reward Prediction Error (RPE)
Past experiences confer an animal the ability to predict rewards in order to anticipate its behavior. Wolfram Schultz and colleagues observed that the firing activity in dopaminergic neurons of the ventral tegmental area (VTA) and the substantia nigra pars compacta was proportional to unexpected rewards (Keiflin & Janak, 2015; Ljungberg et al., 1992; Montague et al., 1996; Schultz, 2016; Schultz et al., 1993, 1997). These neurons encode the difference between the predicted and the obtained reward, known as reward prediction error (RPE), which resembles the proposed teaching signals from older reinforcement learning models (Bush & Mosteller, 1951; Rescorla & Wagner, 1972.; Sutton
& Barto, 1981; Pearce & Hall, 1980). RPE is also encoded in the anterior cingulate cortex , amygdala, globus pallidus and caudate nucleus (Belova et al., 2007; Ding & Gold, 2010;
Hong & Hikosaka, 2008; Seo & Lee, 2007), whereas a region closely interconnected with the VTA, the habenula (Hb), signals punishment prediction error (Kumar et al., 2018; Tian &
Uchida, 2015). Interestingly, the Hb is one of the main centers encoding relief and RPE in zebrafish, as in mammals, it works tightly with the dopaminergic system to build RPE (Li, 2014). Along with other vertebrates, RPE neurons in Drosophila are also dopaminergic (Cohn et al., 2015; Felsenberg et al., 2017; Galili, 2014; Keiflin & Janak, 2015; König et al., 2018; Riemensperger et al., 2005) whereas in the honey bee, the octopaminergic VUMmx1 has shown dynamic reward-predictive firing properties (Perry & Barron, 2013).
The relevance of timing is openly reflected by the RPE, and explains phenomena like punishment relief signaling, where a stimulus that occurs at the end of punishment can be appetitive (Gerber et al., 2014; König et al., 2018; Tanimoto et al., 2004). Trace and relief conditioning studies in Drosophila point to a widespread coding of salient stimuli (Aso &
Rubin, 2016; Hattori et al., 2017; Heisenberg, 2015; Hige, Aso, Modi, et al., 2015; Hige, Aso, Rubin, et al., 2015; Konorski, 1948; Vogt et al., 2015; Zieliński, 2006). In mammals, the amygdala and the medial prefrontal cortex might use their interconnection with the VTA to encode absolute prediction errors or saliency (Mackintosh, 1975; Nasser et al., 2017; Pearce
& Hall, 1980).
RPE underlies an essential neuronal correlate of learning: being able to predict indicates that associative learning has occurred before. The ubiquitous RPE correlates throughout the brain indicate that the brain is a huge associative machine and emphasizes the relevance of associative learning as a universal and essential mechanism for survival.
RPE is necessary for memory reevaluation and reconsolidation by comparing previous associations with current ones (Cognigni et al., 2018; Donahoe & Burgos, 2000; Felsenberg et al., 2017).
9 Introduction There are two main types of learning: associative and non-associative. Associative learning is the process where relationships between events are captured and embodied in synaptic plasticity. Associative learning can be further subdivided in: classical/pavlovian- and operant/instrumental conditioning.
1.4 Pavlovian/Classical and Operant/Instrumental conditioning
Classical conditioning was firstly described by Ivan Pavlov (I. P. Pavlov, 1928; P. I.
Pavlov, 2010). In his experiments he bestowed dogs with food preceded by a bell tone. After learning, the dogs started salivating upon the preceding bell tone even when no food was presented, thus anticipating the food reward. Classical conditioning describes the process where an organism captures the relationship between two external stimuli that are contingent on each other. The conditioned stimulus (CS), in this case the bell tone, whose meaning is neutral to the individual, acquires after co-presentation the value of the unconditioned stimulus (US), in this case the food reward. Hence, when an US is presented frequently enough with a CS, the subject elicits a conditioned response (CR) upon CS occurrence.
Classical conditioning consists of a feedforward process where the contingent sensory stimuli lead to a behavioral response. During operant conditioning the occurrence of behavioral and sensory events are reversed, initiating behavior bias the incoming sensory stimuli. Hence, operant learning is conceptually different in that behavioral outcomes serve as a basis to modify behavior which implies that the subject actively controls the sensory feedback, allowing to direct its cognitive resources (e.g. attention) to it (Brembs &
Heisenberg, 2000; Brembs, 2008; Brembs, 2000, 2009; Heisenberg & Wolf, 1993; Wolf &
Heisenberg, 1991).
Alexander Bain (1865) claimed that in our constant search for pleasure, certain spontaneous behaviors would increase their frequency. Herbert Spencer and James Mark Baldwin would develop the idea of reward-based learning until Thorndike, who showed empirical studies of trial-and-error learning in animals (1898), introduced the law of effect in 1911 (Marks, 2011). Thorndike applied the word instrumental because behavior would be instrumental to achieve rewards, whereas Skinner (1938) would deploy the term operant because behavior would operate on the environment. Contrary to many behaviorists who would try to reconcile both associative learning types in a unifying principle, Skinner made a sharp distinction between operant (emitted) behaviors and respondent (elicited) behaviors (Marks, 2011). Skinner emphasized that operant conditioning strengthened responses and not stimulus-response bonds, which was ambiguously explained by the law of effect (Marks, 2011).
Introduction 10 Innumerable studies have behaviorally characterized operant and classical associative memories in the fruit fly. The neural substrates of classical conditioning have been extensively unraveled, pointing to the MB as the main center for classical conditioning (Aso et al., 2012; Aso, Hattori, et al., 2014; Aso, Sitaraman, et al., 2014; de Belle &
Heisenberg, 1994; Claridge-Chang et al., 2009; Kirkhart & Scott, 2015; Lin et al., 2014; C.
Liu et al., 2012; L. Liu et al., 1999; Mao & Davis, 2009; Margulies et al., 2005; Musso et al., 2015; Perisse et al., 2013; Pidoux et al., 2018a; Schwaerzel et al., 2003; Vogt et al., 2014;
Waddell, 2013). In the operant counterpart, an extensive behavioral characterization of the different components of operant conditioning has laid the groundwork to address the neuronal mechanisms (Brembs, 2000, 2009a, 2009b; Heisenberg, 2015; Heisenberg & Wolf, 1993; Wolf & Heisenberg, 1991). The MB gate the progression from goal directed to habitual behaviors (Brembs, 2009a, 2009b) whereas in mammals this is accompanied by the activity transition from the dorsomedial to the dorsolateral striatum (Fino et al., 2018; Graybiel, 2016;
Graybiel & Grafton, 2015; Thorn et al., 2010). However, the study of the neural correlates of operant behavior in Drosophila has been mostly limited to the mechanisms of sensorimotor transduction, recognizing the circuits eliciting behaviors (Cande et al., 2018; Giraldo et al., 2018; Lindsay et al., 2017; Namiki et al., 2018; Namiki & Kanzaki, 2018; O’Sullivan et al., 2018; von Philipsborn et al., 2011; Robie et al., 2017). The genetic components of operant learning in the fruit fly have been only partially identified, with a particular focus on dFoxP and PKC (Brembs & Plendl, 2008; Colomb & Brembs, 2016; Kottler et al., 2019; Mendoza et al., 2014). However, not that much is known about how punishment and reinforcement signaling converge to influence action selection.
Vocal learning is a well-known operant learning process in juvenile songbirds where the learn to coordinate vocal cords and muscles to imitate the adult song. Pharmacological and lesion experiments together with anatomical findings have characterized the brain regions involved in vocal learning. The cerebellum carries out a supervised error-based learning whereas the striatum involves the reinforcement system. These two regions interact with thalamocortical loops and brainstem circuits to coordinate proper motor output. This mechanism applies to other motor tasks and shows close resemblance to what is observed in other vertebrates (Jarvis, 2007; Manto et al., 2012; Pidoux et al., 2018b; Seidler et al., 2013).
In Aplysia, the biting behavior has been used as a model for the comparison of classical and operant conditioning mechanisms. Pairing tactile stimulation of the lips (US) with seaweed (US) leads to an increased biting frequency (CR). Concomitantly, the stimulation of the anterior branch of the esophageal nerve (En2) after every bite induced a sustained biting increase. Interestingly, En2 releases dopamine in the neuron B51 to induce
11 Introduction differential biophysical changes for both, operant and classical procedures (Bédécarrats et al., 2013; Brembs et al., 2002; Lorenzetti et al., 2006; Nargeot et al., 2009). In the zebrafish Danio rerio there is not much known yet but calcium imaging experiments during operant learning suggested that the lateral Hb and the pallium in the forebrain code for pain relief and prediction error (Li, 2014).
Reinforcement is essential for learning by narrowing the behavioral options to the more adaptive ones. In a changing environment this can be sometimes detrimental and the brain has therefore developed a strategy of increasing behavioral variability (Brembs, 2000;
Wolf & Heisenberg, 1991). Comparing the consequences of different behaviors allows the brain to infer and discriminate the contingencies better. Thus, exploration of a wider behavioral space tends to form a more accurate internal representation and better generalization (Dhawale et al., 2017; Grunow & Neuringer, 2002; Hansson & Neuringer, 2018; Perry et al., 2010). Exploration can be reinforced and used as a reinforcer and curiosity might be a natural mechanism to drive exploration (Grunow & Neuringer, 2002;
Hansson & Neuringer, 2018; Marks, 2011; Neuringer & Huntley, 1992).
1.5 Pure operant learning
Since its implementation by Olds and Milner (Olds & Milner, 1954), lever pressing experiments have been very popular for studying operant learning in rodents. However, these experiments contain a mixture of learning types, where not only the action of lever pressing is contingent on reward (“pure operant”), but also the physical event and associated cues accompanying the instrument (e.g. the lever going down, or apparatus noise, that might work as a CS). In an individual internal model, the paired bond might not necessarily be between behavior-reward but with the descending lever-reward, since a descending lever might be a better predictor of reward. Elegant experiments in fruit flies sharply dissected an operant paradigm in two different learning processes: world- and self-learning. The former referring to the bonds between sensory stimuli with the paired reward and the latter referring to the coincidence detection of ongoing motor programs and reinforcement (Brembs, 2000, 2011). In these fly experiments, during composite training which resembles lever pressing experiments, only CS-US is memorized by the fly in detriment of the behavior-reinforcement (B-R) bond. Further experiments showed that behavioral consequences are easier to retain when no other external cues are present. On the contrary, the CS-US memory is stronger when flies control the presentation with their behavior. This reveals an asymmetry where world-learning is facilitated by behavioral control of the environment whereas the presence of contingent sensory cues impair self-learning. Thus, lever pressing experiments resemble composite experiments where the CS-US association prevails over the B-R bond simulating
Introduction 12 rather classical conditioning experiments. Disregarding this relevant facts has often led to operant paradigms that are vaguely measuring B-R associations. (Brembs, 2000, 2011;
Heisenberg & Wolf, 1993; Wolf & Heisenberg, 1991).
1.6 Drosophila as a laboratory model: optogenetics
About three fourths of human disease associated genes can be found in the fruit fly, making Drosophila a suitable model to study (Chien et al., 2002; Fortini et al., 2000; Pandey
& Nichols, 2011). The relatively simple nervous system of this insect allows us to understand in more detail how specific circuits achieve certain tasks. In addition, short life cycle and the relatively easy maintenance make this model attractive for research.
The introduction of the P-element-mediated gene transfer allowed the development of a vast set of genetic tools, permitting sophisticated experimental manipulations in Drosophila melanogaster (O’Kane & Gehring, 1987; Rubin & Spradling, 1983). In the last years, CRISPR/cas9 has become a major cloning strategy (Bassett & Liu, 2014).
The GAL4-UAS system was cloned from the yeast into Drosophila melanogaster, allowing the spatial control of the transcription of desired genes. In this method GAL4, a transcriptional activator, can be be expressed under different promoters and enhancers to yield a specific expression pattern. The Gal4-protein binds specifically to the Upstream Activation Sequence (UAS), which regulates the expression of an effector protein (Brand &
Perrimon, 1993). Further variants of this system like split-G4s, MARCM and flip out techniques provided an even more accurate expression profiles (Luan et al., 2006; Pfeiffer et al., 2010; Xie et al., 2018). Many effectors have been developed to manipulate neuronal activity through temperature (Hamada et al., 2008; McKemy et al., 2002; Peier et al., 2002), drug administration (Sternson & Roth, 2014) or light (Boyden et al., 2005; Nagel et al., 2002, 2003). The latter technique, known as optogenetics, is the method chosen for this study due to its temporal resolution and decreased side effects.
Channelrhodopsins are light gated channels that were discovered in green algae in Regensburg in 2002 (Nagel et al., 2002, 2003), which were consequently further developed as a neuronal activation tool (Boyden et al., 2005). Since their discovery, the biophysical properties of these channels have been optimized according to the purposes of the scientific community. Channelrhodopsins consist of a protein channel core with its C-terminal covalently bonded with all-trans-retinal (ATR), a chromophore (Kato et al., 2012). When light hits on the chromophore, it leads to 13-cis-retinal, that induces a conformational change of the channel, making it permeable to cations, specially calcium.
13 Introduction Neuronal activity recording and imaging adds supplemental versatility for fly research, as well as anatomical tracing techniques like electronic microscope reconstruction and synaptically targeted GFP reconstitution across synaptic partners (GRASP) (Feinberg et al., 2008; Macpherson et al., 2015; Owald, Lin, et al., 2015). Concomitantly, recent technological advancements and a more openly shared distribution of resources have allowed higher quality research with more sophisticated analysis algorithms and high throughput experiments.
1.7 Aim of the study
The scope of this study was to find neuronal substrates for operant reinforcement (fig. 1). Subpopulations of dopaminergic neurons were screened for their reinforcing properties in four different operant paradigms. All experiments resembled self-stimulation paradigms where naive flies were in control of the neuronal activation by light.
We focus on dopaminergic neurons for several reasons:
• Evolutionary: in mammals the dopaminergic mesencephalic nuclei projecting to the basal ganglia and medial prefrontal cortex encode the teaching signals (Montague et al., 1996; Olds & Milner, 1954; Schultz et al., 1997). In birds, as in mammals, the basal ganglia encode the reinforcing signals, indicating that dopamine might be involved (Pidoux et al., 2018b). In Aplysia, dopamine is the learning signal involved in classical and operant conditioning (Brembs et al., 2002; Lorenzetti et al., 2006). In nematoda, platyhelminthes and crustaceans dopamine is involved in conditioning (Barron et al., 2010; Datta et al., 2018). In Drosophila dopamine substitutes the US and contains projections to important premotor areas like the central complex (CX) and the lateral accessory lobe (LAL) (Aso et al., 2010, 2012; C. Liu et al., 2012;
White et al., 2010).
• Technical: the availability of a vast number of dopaminergic promoters for driving the expression in specific neuronal subsets, as well as the volume of literature on the effects of dopaminergic manipulation gives an excellent and extensive background framework to this study.
Introduction 14
Figure 1. Circuit schematics from classical conditioning vs operant behavior. A: In olfactory classical conditioning the kenyon cells (KC) receive and convey olfactory input whereas dopaminergic neurons (DANs) provide contextual information and serve as an US. DANs consequently modify KC-MB output neurons synaptic strengths to trigger the behavioral output. B: Hypothetical learning mechanism for behavior: DANs projecting to a region where motor programs are selected, change synaptic strengths to increase/decrease a certain behavior (active neurons are shown in red).
15 Methods
2 Methods
2.1 Fly genetics
In our experiments we avoided additional contingencies other than that of the reinforcement with the fly behavior: to avoid visual cues from the stimulating light that would interfere with our reinforcement scores, we genetically blinded flies with a mutated no receptor potential A gene (norpAP24). norpA encodes for phosphatidylinositol-specific phospholipase C that is involved in several sensory pathways, which mutation can impair vision completely (Hardie et al., 2003; McKay et al., 1995; Pearn et al., 1996; Shen et al., 2011). In addition, norpAP24 decrease olfactory discrimination (Riesgo-Escovar et al., 1995) and impair temperature discrimination at temperatures between 18°C and 26°C (Collins et al., 2004; Glaser & Stanewsky, 2005; Shen et al., 2011). This overall reduced sensory sensitivity is optimal to avoid the world-learning effects and to strictly measure self-learning, the “pure” operant learning component.
CsChrimson was the effector chosen for neuronal activation (Klapoetke et al., 2014), whereas GtACR1 and GtACR2 were deployed for inhibition experiments (Mohammad et al., 2017). Phasic stimulation activates neurons more effectively than tonic stimulation (Inagaki et al., 2014), therefore the light stimulation was pulsed.
2.2 Fly care and reagents
Males containing a dopaminergic GAL4 (table S2) driver line were crossed to norpAP24;20xUAS-CsChrimson virgin flies and kept them in standard cornmeal and molasses food media in darkness at 25°C and 70% humidity for egg laying. One to six days after hatching, groups of approx. 30 male offsprings were put in small glass vials with all-trans- retinal (ATR) supplementation for two days before testing. In mammals, retinal precursors are naturally produced in the brain whereas this is not the case in insects. Therefore, fly food is supplemented with ATR for the deployment of optogenetics. The ATR supplementation was accomplished by applying 15µl of 200mM ATR dissolved in ethanol to the food surface for intake. All the flies were fed with ATR to yield a functional light-gated channel (unless otherwise specified). In mammals, retinal precursors are naturally produced in the brain whereas this is not the case in insects. Therefore, fly food is supplemented with ATR for the deployment of optogenetics.
For each setup a previous test with a negative and a positive control was performed to confirm that the setup was working properly. Concomitantly, a positive control was always tested during the screen to check that the setup was working reliably across periods of days.
Methods 16 Light parameters were calibrated until the positive control showed a robust effect size relative to the negative control.
norpAP24;20xUAS-CsChrimson and norpAP24;Gr28bd+TrpA1>Chrimson were the negative and positive controls, respectively. Only in the red lit T-maze a different positive control was deployed, norpAP24;Gr66a>Chrimson, which expresses CsChrimson in bitter taste neurons and its activation has been shown to be aversive (Aso, Sitaraman, et al., 2014). The combination of Gr28bd with TrpA1 drivers showed stronger phenotypes than Gr66a in our experiments and therefore was used for further screens. Whereas Gr28bd expresses in the hot cells in the arista of the antennae, TrpA1 expresses in the heat sensitive neurons in the inner brain AC neurons (Galili et al., 2014; Geffeney, 2017).
Light was measured with a lux meter (table S1) which was calibrated and transformed from lux into µW/mm² with the following scripts:
https://github.com/chiser/light_conversion/blob/master/lux2watts.R (fig. S1). To confirm that the light spectrum specified in the light source data sheet matched the real light spectrum, the stimulation light was with the spectrometer (table S1). This was necessary because materials such as light guides or T-maze tubes might modify the light spectrum when the light travels across them. A list of the lines used in this study is available in table S2.
2.3 T-maze
The T-maze was composed of a core and three insertable tubes. The core contained an elevator for transfering the flies from the entrance tube to the choice tubes, where they had two options: approach the dark arm or the arm with the optogenetically stimulating light (fig. 2). LEDs were adjusted for the light stimulation with a frequency generator and a power supply (table S1). LEDs were glued to a cooling plate to avoid overheating.
Whereas CsChrimson is sensitive to yellow and red light, GtACR1 and GtACR2 are both sensitive to blue and green light. Two activation screens, one with red- and another with yellow light, were performed (fig. 2). One additional experiment was performed with blue light to inhibit neurons that showed robust reinforcement across all paradigms. The light intensities were 1600 lux, 1000 lux and 2500 lux for the red- (660nm), yellow- (590nm) and blue (480nm) lit T-maze experiments respectively. The rest of the parameters were the same for the three T-maze experiments: 10ms pulse width, 20Hz stimulation frequency and 9.9ms cycle duration with 1ms delay.
17 Methods
Figure 2. T-maze schematics. A: Thirty or more flies were introduced in the entrance arm for the experiment. By tapping the T-maze, flies were introduced into the elevator, which then was shifted to a middle point for 30 seconds for the adaptation of the flies. B: The elevator was then pushed all the way down, letting the flies move freely within the choice arms. After one minute, flies in each arm were tallied under CO².
The same groups of flies were tested in two consecutive days for the screen with red light as well as in the inhibition experiments with GtACRs. Since the counting was done under CO², and CO² exposure is detrimental for the flies, a day for recovery was left before the second experiment (Barron, 2000; MacAlpine et al., 2011; Perron et al., 1972).
Experiments with the yellow light were conducted without repetition and blindly by two experimenters in parallel, to obtain an estimation of the handling variability.
2.4 Y-mazes
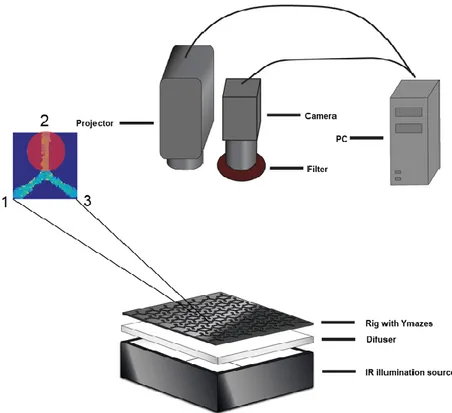
The setup consisted of a behavioral box with a rig (30x35cm) with 120 Y-mazes. The rig was backlit with an IR LEDs panel (table S1) and a diffuser to scatter light homogeneously (as in Buchanan et al., 2015; Werkhoven et al., 2019). In each Y-maze, a single fly could freely explore the three arms, one of which was illuminated with the optogenetically stimulating light (fig. 3).
The positive control showed the strongest phenotypes at 80% and 100% of the maximum projector light intensity, therefore the light intensity was set to its maximum. Light was set at [1 0 0] (RGB code) and its spectrum ranged from 570nm to 720nm with a peak at 595nm. Light stimulation frequency was set at that of the projector (75Hz), and sampling
Methods 18 frequency was set to 37.5 Hz, half of the refresh rate of the projector (table S1), to avoid light display inaccuracies. The duty cycle was 50%.
Figure 3. Y-mazes setup schematic. The behavioral box below with a zoomed-in view of a single Y-maze. The enlarged Y-maze contains the arm number as well as a red dot to simulate the stimulation light. A PC processed the camera recording online and commanded the projector for closed-loop feedback. The experiment protocol consisted of a total of 60 minutes test where each of the arms was reinforced for 20 minutes by displaying light on the arms whenever the fly entered the given arm.
Fly behavior was recorded with a digital camera and further processed with background subtraction in Matlab (Mathworks) to obtain simultaneous tracking of the 120 flies. A 850nm long pass filter (table S1) was placed in front of the camera to avoid interference of the stimulating light in the tracking.
All the Matlab scripts were run under the Matlab 2015a version in Windows 7. The projector stimulation patterns were designed with Psychtoolbox-3 toolbox (http://psychtoolbox.org/) with its third-party dependencies and an Nvidia graphic card.
Closed loop stimulation with the projector demand enough spatial resolution to display light in specific Y-maze arms. This required the pixels of the projector to match those on the camera, for which the projector displayed a black and white pattern on a white surface that was consequently captured by the camera. By knowing the coordinates of the projected patterns and recording these patterns with the camera, the corresponding camera- projector pixels were registered. For every calibration procedure, at least an R²=0.9998 in the projector-camera pixels correlation was accomplished (approx. pixel precision).
19 Methods
Acquisition software scripts & parts list: https://github.com/chiser/autoTrackerV2-old-version- Registration scripts: https://github.com/chiser/Registration-Camera-Projector.
Y-mazes video example: https://www.youtube.com/watch?v=S8uVpEOMojU.
2.5 Joystick
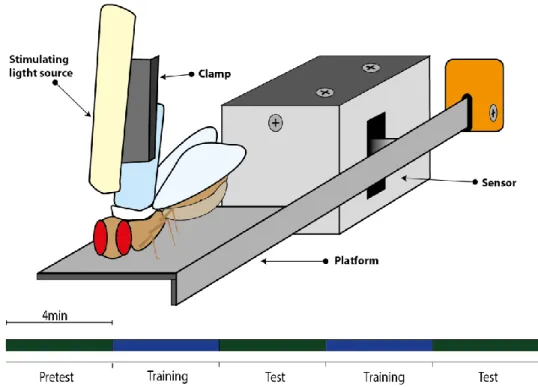
Tethered flies are positioned on a flexible platform that measures their leg postural lateral force (fig. 4). For the tethering, a piece of 0.7mm diameter fishing line (table S1) is glued on the dorsal side of the thorax, which is used to fix the fly to a clamp. A light guide attached to the clamp collects and directs the stimulating light to the fly head. The fly is carefully positioned with micromanipulators on the platform and inspected for proper motor activity. A photoelectric barrier detects the platform position and sends an analog signal (-5 to +5V) to the Analog-Digital converter.
Figure 4. Joystick schematics. In a spaced training protocol, we alternate open- (green) and closed loop (blue) four-minute periods. In the closed loop/reinforcement period flies are trained by turning on the stimulating light when the fly pushes the platform to a specified side. The experiment protocol lasts for 20 min with alternating 4 min segments of Pretest, Training, Test, Training, Test as shown in the figure. The reinforced side (right/left) was alternated at each consecutive experiment.
The closed loop stimulation is gated by a microcontroller (Arduino Uno). Light guides are glued to the LEDs on one end and straight fixed next to the clamp directed to the fly head. The stimulating light intensity was 400 lux, 20 Hz, 50 ms pulse width and no cycle delay. The data acquisition software is custom written in Visual Basics (Microsoft) with a 20
Methods 20 Hz sampling rate. As in the T-maze with yellow light, the fly line identity was blinded to experimenters to avoid ad hoc bias. The experiment was conducted by two experimenters in parallel.
Joystick example video: https://www.youtube.com/watch?v=z2uOIVYrC0o.
The instructions sheet with the software scripts by Johann Schmid (modified from Mariath, 1985; Wolf et al., 1992): https://github.com/chiser/Joystick-acquisition-software.
2.6 Data analysis
Since the raw data format was different for each experiment, data was differently analyzed to obtain a score that allows comparison across setups. Hence, every score ranges from -1 to +1, where negative scores indicate light avoidance, positive scores approach, and close to zero scores indicate no preference for the light. For the T-maze we calculated a preference index:
𝑃𝐼 =𝑥 − 𝑦 𝑥 + 𝑦
(1)
where are the number of flies in the light and the number of flies in the dark. The flies that did not make any choice and stayed in the middle were not considered in the formula for two main reasons: locomotor deficits would impair the flies approaching any of the arms and thus not show their preference and It is questionable whether the light intensity in the middle is over the activation threshold for CsChrimson. From the single experiment PIs we calculated an arithmetic mean and a weighted mean:
𝑃𝐼̅̅̅ =∑𝑛𝑖=1𝑃𝐼𝑖 𝑛
(2)
𝑤𝑒𝑖𝑔ℎ𝑡𝑒𝑑𝑃𝐼̅̅̅ =∑𝑛𝑖=1𝛽𝑖𝑃𝐼𝑖
𝑛 (3)
Where is the total number of experiments and denotes a weight proportional to the number of flies that took part in the experiment (normalized to yield a mean of 1). For the Y-mazes we had different time-stamped measures: speed, arm location and arm entry for which ratios were calculated. Only flies with at least 14 turns/arm changes were used for the analysis and speed was downsampled through window average to 3.75Hz to reduce noise.
𝑆𝑝𝑒𝑒𝑑 𝑟𝑎𝑡𝑖𝑜 =𝑥 − 𝑦 𝑥 + 𝑦
(4)
𝑂𝑐𝑐𝑢𝑝𝑎𝑛𝑐𝑦 𝑟𝑎𝑡𝑖𝑜 =𝑥 − 𝑦 𝑥 + 𝑦
(5)
21 Methods
𝐸𝑛𝑡𝑟𝑖𝑒𝑠 𝑟𝑎𝑡𝑖𝑜 =𝑥 − 𝑦 𝑥 + 𝑦
(6)
where refers to mean speed, time spent, and number of entries in the lit arm for the three equations respectively whereas refers to the mean of the mentioned parameters in the dark arms, respectively. For the Joystick we calculated the PI for each of the experiment periods by:
𝑃𝐼 =𝑥 − 𝑦 𝑥 + 𝑦
(7)
where is the number of data points in the lit side and the number of data points in the dark side. We averaged all of the Reinforced periods PIs and subtracted pretest PI, to normalize for the intrinsic bias. In addition, we measured the platform wiggle as a proxy for locomotor activity:
𝑤𝑖𝑔𝑔𝑙𝑒 = ∑ | 𝑑𝑥 𝑑(𝑡 − 20)|
𝑁
𝑛=1
(8)
where is the time-stamped platform position and the time stamps. The time series was differentiated with a lag of 20 to capture the wiggle at a slower time scale that corresponded more closely to the fly behavior. We subtracted the wiggle scores during lights off to when lights were on, obtaining a ratio that is positive when flies move more during neuronal activation, and vice versa.
Power analysis was only performed for the T-maze with yellow light and the Joystick screens to predetermine the sample size. We performed a one-tailed t-test for the positive against the negative control, where the power was set to 80% and the significance to 0.05.
The estimated number of experiments for the T-maze was eight, however, since we expected smaller effect sizes for our experimental lines, we decided to do 12 experiments per line. For the Joystick the power analysis resulted in 15 experiments, and due to the time limit constraints, we kept it at 15 experiments for each line.
Most of the analysis and plotting was done in R version 3.4.2 (https://www.R-project.org) except for the analysis for the Y-mazes that was done in Matlab 2015a (Mathworks).
Analysis scripts URLs:
- Power analysis: https://github.com/chiser/power-analysis
- Y-mazes: https://github.com/chiser/matlab-analysis-on-operant-reinforcement - Joystick: https://github.com/chiser/screen-analysis-for-yellow-Tmaze-and-Joystick.
Methods 22
- T-maze: https://github.com/chiser/T-maze-drosophila/tree/master/Tmaze Tmazeplottingrepetitions.r was used for the screen with red light.
Tmazeplotting.r was used for the screen with yellow light.
All data acquisition software and analysis scripts are available at https://github.com/chiser.
All raw data can be found at https://doi.org/10.7910/DVN/RETZPG.
2.7 Neuronal clusters valence estimation
Linear models were performed to solve a system of equations with one equation per tested line. Neuronal clusters valence were the unknown variables which were weighted by the corresponding expression level from the given line, whereas the behavioral score is the response variable. Different model combinations were tested: bayesian versus frequentist, linear versus nonlinear, with- versus without interactions. Whereas in linear models the effect is proportional to the expression level, in nonlinear models we fitted nonlinear basis functions to the relation expression-effect.
Complex models tend in general to overfit the data, hence goodness of fit that takes model complexity into account, like Akaike Information Criteria (AIC), Deviance Information Criteria (DIC) and Bayesian Information Criteria (BIC) were chosen. Bayesian methods were prioritized due to their robustness to overfitting.
Analysis scripts can be found in:https://github.com/chiser/estimating-dopaminergic-clusters- valences/blob/master/modelling_scores.Rmd.
2.8 Anatomical characterization
GAL4 lines were crossed with w-;6xUAS-20xGFP flies. Fly brains were fixed in 4%
paraformaldehyde for 2hs at 4°C, placed on microscope slides and mounted with antifade mounting medium (VectashieldⓇ). Image acquisition was performed with a Leica SP8 confocal microscope. Images were scanned at a frame size of 1024x1024 pixels with a 40x oil immersion objective. Confocal stacks were viewed and analyzed using the ImageJ software. Only general adjustments to contrast and brightness were made. Anatomical identification was accomplished with the help of the Virtual Fly Brain website (www.virtualflybrain.org).
23 Results
3 Results
3.1 Driver lines expression analysis
Since the GAL4s were obtained from different studies, some focusing on classical learning (Aso et al., 2010, 2012; Aso, Hattori, et al., 2014; Aso, Sitaraman, et al., 2014; C.
Liu et al., 2012) and some on sleep/arousal (Galili et al., 2014; Q. Liu et al., 2012; Pathak et al., 2015), two different expression tables were generated. The former contains driver lines with their soma at the paired anterior medial cluster (PAM) and paired posterior lateral 1 &
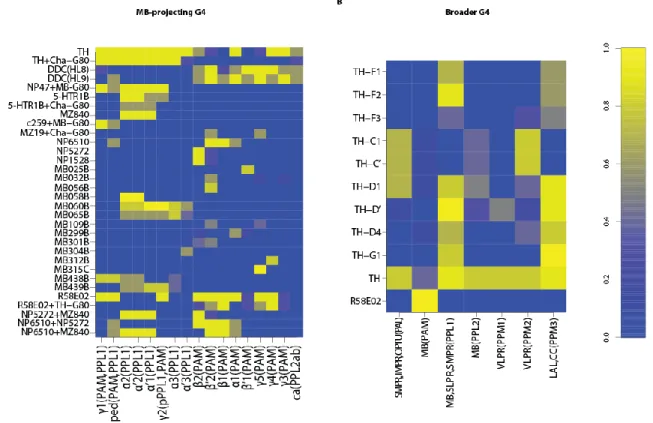
2ab clusters (PPL1 and PPL2ab) projecting to the MB compartments (fig. 5A), whereas the latter contains dopaminergic lines with broader projection sites (fig. 5B).
Figure 5. Dopaminergic driver lines expression pattern. On the Y-axis are the driver line names and on the X- axis each of the targeted neuronal clusters can be found. DANs are depicted by their projection sites and their cell body location (within brackets). Colorbar at the right-hand side shows normalized expression intensity from zero to one. A: Driver lines obtained from Aso et al. 2010, Aso et al. 2012, Aso et al. 2014 with their corresponding expression pattern. B: Driver lines from Liu et al. 2012. The expression pattern was estimated from the following studies: Liu 2012, Galili 2014 thesis, Pathak 2015.
Bearing in mind that protocol variations for immunohistochemistry yield different expression patterns, a summary of several studies was produced to find a consensus for the expression values for the broader expressing driver lines (fig. 5B). For a more detailed description of the generation of these driver lines see Supplemental Information in Liu 2012.
Results 24
3.2 T-maze screen with red light
As explained in the methods section, a pilot experiment was performed where the positive control, norpAP24;Gr66a>Chrimson, was tested with and without ATR supplementation. As expected, the negative PI scores indicate light avoidance of the positive control and therefore indicate that the setup is functioning as expected (fig. 6).
Although we reared between 30 and 40 flies in each experimental glass, due to the handling some of the flies would not survive or would escape the test. Hence, there was a fluctuating number of flies taking part in each experiment. To test whether different numbers of flies affect the PI, a weighted PI, where the contribution to the final score was directly proportional to the number of flies that took part of the experiment, was calculated. A sharp correlation between weighted and unweighted PI analysis (r=0.99; adj. R²=0.95; p=2.43-15) indicated that weighting the PI made no difference to the result. The standard PI was chosen for further analysis, favoring simplicity since this is not detrimental.
Figure 6. T-maze screen. Barplots depict each driver line means for each behavioral score in descending order with error bars depicting the standard error of the mean (SEM). Positive controls fed with and without ATR are coloured in dark- and light blue respectively. Number of experiments for each line is shown above each driver line label in the X-axis. Driver line fonts are color coded according to classical learning phenotypes as shown in the legend above. All lines contained a norpAP24 mutation which is omitted in the X-axis for simplicity.
25 Results The T-maze experiment with red light was performed twice for each group of flies to observe choice consistency between both tests (fig. 6). If flies chose differently every time they are exposed to the T-maze, one would not expect to find any correlation between first and second experiment. However, if flies developed a fixed preference for a certain neuronal activation, the first and second set of experiments should yield similar results. Two different analyses were performed on the correlations between the two tests: one across the means for each driver line, and another correlation retaining the identity of each single experiment.
For the former we found a correlation (r=0.55; adj. R² =0.55; p= 3.1-5), which indicates that the effects are consistent at the population level. However, for the latter there was no correlation (adj. R² = 0.02), suggesting that the effects are rather probabilistic and therefore difficult to observe in single experiments due to high decision variability.
To have an estimation of the effect of genetic background in our paradigm, the negative controls were bred in different stocks for several generations during approximately one year. Very soon after separating stocks, the fly genetic background tends to accumulate modifications that lead to divergence (Colomb & Brembs, 2014). A pilot experiment showed no effect of the genetic background in this assay. More details from these experiments are found in http://lab.brembs.net/2015/11/lab-report-optogenetics-a-screening-with-the- channelrhodopsin-chrimson/.
3.3 T-maze screen with yellow light
Since the wavelengths corresponding to yellow light activate CsChrimson more effectively, an additional T-maze screen was performed with yellow light (Klapoetke et al., 2014). The effect of octopaminergic neurons in approach/avoidance assays is dependent on stimulation parameters like frequency and intensity (Gerbera, 2018). Hence, differences between this screen and the red-lit T-maze experiments shown in the previous section might indicate if the same neurons can encode different information under different activation characteristics (fig. 7, table S3). As in the T-maze with red light, the positive control, in this case norpAP24;Gr28bd+TrpA1>Chrimson, showed a strong light avoidance, as expected, in the pilot experiments (results in http://lab.brembs.net/2018/06/tmaze-experiments-initial- results/).
Are the PIs of different lines influenced by their basal locomotor differences? This is relevant because different genetic backgrounds affecting locomotion might also influence the performance in a spatial task like this one. Movement is a necessary requirement for the flies to show their preference in the T-maze and moving less might for instance lead to more/less extreme scores. Since the starting point is the elevator, the amount of flies in the elevator at the end of the experiment was considered as a proxy for locomotor deficits. No correlation
Results 26 was found between the measured PIs and the number of flies in the elevator at the end of the experiment (adj. R²= -0.038), suggesting that basal locomotion does not influence T- maze scores.
Figure 7. T-maze screen with red light. Barplots depict each driver line means for each behavioral score in descending order with error bars depicting the standard error of the mean (SEM). Positive control is coloured in blue. Number of experiments for each line is shown above each driver line label in the X-axis. Driver line fonts are color coded according to classical learning phenotypes as shown in the legend above. All lines contained a norpAP24 mutation which is omitted in the X-axis for simplicity.
Since the yellow-lit T-maze screen was performed in parallel by two different experimenters, it was interesting to see if there is consistent effect across experimenters. A correlation analysis showed no significance (adj. R² = 0.0086; p= 0.292 for linear correlation, and p=0.546 for Spearman´s rank correlation), indicating that overall, the yellow light creates no consistent effect on neuronal activation. To address whether the lack of consistency is due to the absence of effect size or due to a context-dependent effect further analysis was performed in sections 3.3.1 and 3.6.
27 Results
3.3.1 Negative-effects screen simulation
T-maze experiments with negative controls were pooled (blind flies, either with only effector or only with any GAL4 driver), summing up to a total of 49 experiments. The overall PI was not different from zero (fig. S2A). By sampling 12 times with repetitions from the experimental pool we can compare the obtained PI distribution to that of our T-maze experiments. The sampling with repetitions seems to be reasonable because of its unlikelihood in a real population of changes in the probability of an event after the occurrence. Fig. S2B shows the result of 32 bags of 12 samples, simulating the yellow light T-maze screen. Sampling from this null-effect fly line yield scores closer to zero, compared to the yellow lit T-maze screen (fig. 6B; fig. S2B). The presence of more extreme PIs in fig. 7 out of the range of the null effect lines suggests that neuronal manipulations in the yellow-lit T-maze certainly modify the choice biases.
3.4 Y-mazes Screen
This high throughput setup allowed to measure many single flies and to test more lines than in other setups. As explained in methods, it consists of a rig with Y-shaped mazes where single flies can choose to be in any of the three arms, one of which is illuminated with red light for optogenetic activation. As for the previous screen, the positive controls showed strong avoidance of the light (Werkhoven et al., 2019). The occupancy rates from this screen are shown in fig. 11.
Arm entries might be a favorable measure for valence because it is locomotion- independent and shows an active decision to self-stimulate. An initial experiment with non- blinded flies revealed occupancy-entries positive correlation whereas the addition of norpAP24 particularly obscured the entries effects, indicating that flies rely on their vision to navigate through the maze (Werkhoven et al., 2019). Furthermore, arm entries rate did not show any correlation to occupancy rate in the performed screen (adj. R² = 0.07; p=0.046), nor to speed (adj. R² = 0.052; p= 0.082) neither at the population level nor at the single lines (fig. S3). Although the presence of norpAP24 was a major hindrance for the flies to navigate, the positive correlation of entries and occupancy in seeing flies indicates that occupancy rates are a good proxy for valence. Moreover, occupancy rate is more similar to T-maze PI, where its locomotory effects cannot be separated from its valence.
Results 28
Figure 8. Results from the operant behavior screens. Barplots depict each driver line means for each behavioral scores in descending order with error bars depicting the standard error of the mean (SEM). Positive controls fed with and without ATR are coloured in dark- and light blue respectively. Number of experiments for each line is shown above each driver line label in the X-axis. Driver line fonts are color coded according to classical learning phenotypes as shown in the legend above. All lines contained a norpAP24 mutation which is omitted in the X-axis for simplicity.
A tight inverse correlation between occupancy and speed rates (r=-1.57, adj. R² = 0.94, p= < 2.2-16) indicate that flies that avoided the lit arm also tend to run faster in this arm and vice versa. To investigate whether neuronal activation directly induced effects in walking speed, yoked experiments were carried out. Yoked experiments consist of a paired experiment where one individual controls its own feedback as well as that for the paired individual. This allows the former individual to learn from behavioral outcomes whereas this is not possible for the latter individual. Thus, half of the flies were tested with one of the arms lit, whereas the other half of the flies received light stimulation according to the ubication of the paired fly rather than based on their own ubication. These results unambiguously reveal that neuronal activation changes walking speed (fig. S4). In summary, neuronal activation induces changes in occupancy and speed. Running more in a specific Y-maze arm might lead to leaving that arm sooner, thus affecting occupancy scores. However, experiments in
29 Results non-blinded positive controls reveal that neuronal activation has a valence effect that is independent of locomotion.
3.5 Joystick screen
In contrast to the previous paradigms, in the Joystick flies are tethered, which might facilitate the measure of a locomotion-independent valence (fig. 9). To avoid handling biases we corrected the training PI by subtracting the pretest PI from it (as explained in Methods).
Reinforcement PIs with and without pretest normalization were only slightly correlated (adj.
R²=0.10; p=0.059), indicating that pretest biases have a strong effect in reinforcement scores.
Figure 9. Results from the Joystick screen. Barplots depict each driver line means for each behavioral score in descending order with error bars depicting the standard error of the mean (SEM). Positive control is coloured in blue. Number of experiments for each line is shown above each driver line label in the X-axis. Driver line fonts are color coded according to classical learning phenotypes as shown in the legend above. All lines contained a norpAP24 mutation which is omitted in the X-axis for simplicity.
For assessing the correlation between locomotion and valence, as it was done for previous setups, a correlation analysis between wiggle and reinforcement scores was carried out. Contrary to the Y-mazes, there was no correlation locomotion-valence and hence it is a paradigm suitable for segregating these two features (wiggle versus normalized reinforcement adj. R²=0.01; p=0.27).
Results 30
3.6 Context-dependency: Effect on the mean and variance
All the results from the performed screens were uncorrelated (fig. 10; table S3 for statistics). The reason behind this could be: either these neurons do not encode for reinforcement, or the reinforcement is context-dependent and thus, effects vary across setups. To address this, we analyzed how much these phenotypes deviate from zero for each line and compared them to the negative controls.
Figure 10. Double comparison between operant behavior paradigm scores. A-F: Eight combinations of biplots projecting two behavioral axes. Axes ranges were truncated to -0.4 to +0.4 for visualization purposes.
Legend on the right, with colours indicating classical learning phenotypes and a corresponding symbol for each driver line. Only lines that were tested in both paradigms are shown in the graphs.
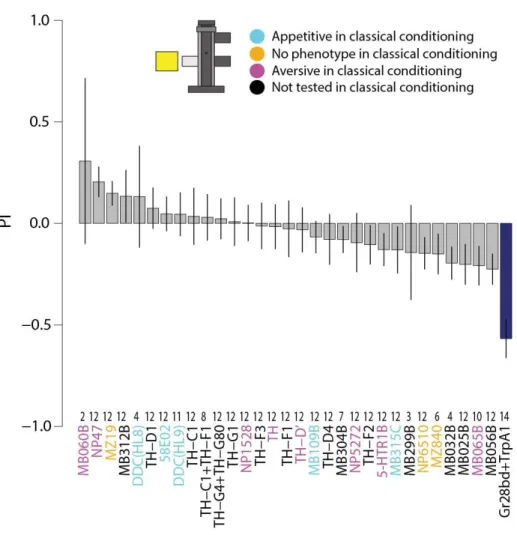
If the neuronal manipulation has no effect, one would expect close to zero variance across experiments for all the lines tested. This variance will only be dependent on the noise, which should in principle affect all lines to the same degree. However, if the manipulation has an effect, we would expect an increment of this value proportional to its
31 Results effect size. Interestingly, our negative control, TH-G4+TH-G80, never showed extreme phenotypes in any of the four screens performed, contrary to the two positive controls, Gr28bd+TrpA1 and Gr66a (fig. 11).
Since context-dependent behavior shows variable phenotype, activation of these neuronal populations might not shift overall means but variance across paradigms. Hence, we expect the lines with higher scores in fig. 11 to be the more influenced by the situation.
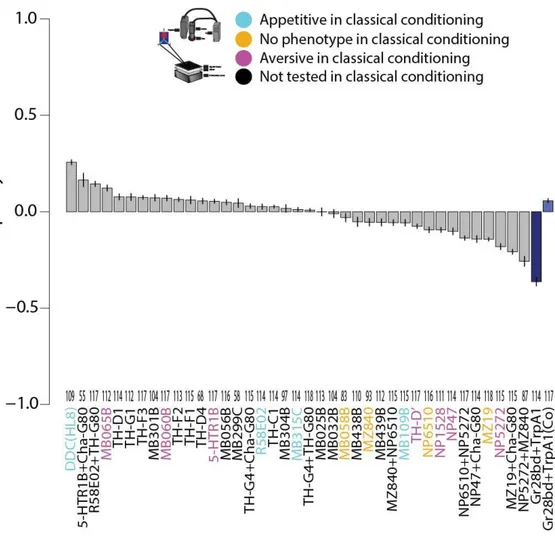
Figure 11. Mean absolute phenotype score across the four operant paradigms. Lines are ordered from higher to lower absolute phenotype. These scores consist of an average of the unsigned behavioral scores for each fly line. Dark blue are positive controls and light blue positive controls without ATR supplement.
3.7 Context-independent reinforcers
Previous analysis indicated that reinforcement is predominantly influenced by the context. However, our interest lies in the neuronal manipulations that produce consistent effects, that is, the general reinforcers. We focused on lines with big phenotypic effects and balanced contribution from each experiment. TH-D', TH-D1 and TH-G1 were the only lines with consistent avoidance/attraction across the four tests (fig. 12). Unfortunately, not all lines were tested in all setups due to different technical reasons. Considering that only lines with
Results 32 four consistent results were chosen, some interesting lines might have been missed, which is a major setback of this study. Nevertheless, this data is still valuable to select promising candidate lines in more detail in the future.
Figure 12. Superimposed barplot with the driver line scores for each experiment. On the Y-axis the corresponding score unit for each paradigm in arbitrary units. On the X-axis the driver lines tested across all screens. Note that not all lines were tested in all paradigms for different reasons. Legend below left show colours attributed to each paradigm score.
3.8 Estimation of the valence of dopaminergic clusters
We created a model with the lines broadly targeting dopaminergic clusters (fig. 5B) to have a numerical estimate of the valence of these populations. The overall behavioral score from the previous section was chosen as the response variable, since it combines data from the four screens, emphasizing the effect of consistent lines. AIC, DIC and BIC are relative values for goodness of fit, therefore one cannot consider them alone but in comparison with other models. Models without interactions yielded lower AIC/DIC/BIC scores, supporting the idea that the effect of these neurons is exclusively additive (fig. 13B).
33 Results Since neurons often work in a nonlinear fashion (Benda et al., 2010; Birman, 2005;
Zhang et al., 2013), we modelled them with nonlinear basis functions. Using a general additive model (GAM; gam function in R) and linear models (lm function in r) yield the same goodness of fits, probably because GAM failed to fit nonlinear basis functions to the linear model variables (fig. 13B). We therefore assume that the effect of these neurons is approx.
proportional to the expression level. Allowing ourselves to compare AIC and DIC equally, bayesian models fitted slightly better than frequentist models (fig. 13B). Considering adj. R² is an absolute fit score where approx. one would be a perfect score, an adj. R² of 0.3 seem to be a low score. This means that these models are probably not capturing properly the behavior of these neurons or, the measured effect of these neurons is very noisy.
Figure 13. Valence estimation of major dopaminergic neuronal clusters. A: On the Y-axis the major dopaminergic clusters and on the X-axis the valence scores in arbitrary units (a.u.). The dots represent posterior means with 95% credible intervals bars. B: Different goodness of fit values for the different models tested. The lower the AIC/BIC/DIC value, the better the trade-off information-overfitting. Note that some of the fields are empty because the R function would not calculate these. bayesglm: bayesian general linear model; gam: general additive model; lm: linear model; MCMCglmm: Markov Chain Monte Carlo general linear mixture model.
All valence estimates credible intervals were overlapping with the zero line. Thus, we could not be be certain of any neuronal effect. The low adj. R² suggests that the effects might not have been captured by our model. Hence, only focusing on the interesting lines might give a better characterization for reinforcement neuronal correlates, which we will deal with in the next section.