Research Collection
Journal Article
Critical crystallization properties of an industrial-grade Zr- based metallic glass used in additive manufacturing
Author(s):
Sohrabi, Navid; Schawe, Jürgen E.K.; Jhabvala, Jamasp; Löffler, Jörg F.; Logé, Roland E.
Publication Date:
2021-07-01 Permanent Link:
https://doi.org/10.3929/ethz-b-000475574
Originally published in:
Scripta Materialia 199, http://doi.org/10.1016/j.scriptamat.2021.113861
Rights / License:
Creative Commons Attribution-NonCommercial-NoDerivatives 4.0 International
This page was generated automatically upon download from the ETH Zurich Research Collection. For more information please consult the Terms of use.
ETH Library
ContentslistsavailableatScienceDirect
Scripta Materialia
journalhomepage:www.elsevier.com/locate/scriptamat
Critical crystallization properties of an industrial-grade Zr-based metallic glass used in additive manufacturing
Navid Sohrabia,∗, Jürgen E.K.Schaweb,c, Jamasp Jhabvalaa, Jörg F. Löfflerb, Roland E.Logéa
aThermomechanical Metallurgy Laboratory (LMTM), PX Group Chair, Ecole Polytechnique Fédérale de Lausanne (EPFL), 2002 Neuchâtel, Switzerland
bLaboratory of Metal Physics and Technology, Department of Materials, ETH Zurich, 8093 Zurich, Switzerland
cMettler-Toledo GmbH, Analytical, 8606 Nänikon, Switzerland
a rt i c l e i nf o
Article history:
Received 15 January 2021 Revised 25 February 2021 Accepted 5 March 2021
Keywords:
Metallic glass Crystallization
Fast differential scanning calorimetry Laser powder-bed fusion
Additive manufacturing
a b s t r a c t
The major challenge to overcome when processing metallic glasses(MGs) is to avoid crystallization.
Therefore, time-temperature-transformation(TTT) diagramsareused, butthey areoftenderived from experimentsinwhichheatingorcoolingratesarelimitedanddonotcoverthefullrangeofprocessing conditions,especiallythoseencounteredinadditivemanufacturing(AM)wheretheratesareveryhigh.
Here,anindustrial-gradeZr-basedMG(AMZ4)is investigatedviafastdifferentialscanningcalorimetry (FDSC).Thecriticalcoolingandheating ratesofAMZ4 areexperimentallymeasuredand TTTdiagrams aredetermineduponheatingandcooling.Thecriticalheatingrateof45,000K/sis18timesthecritical coolingrate,whichindicatesthepresenceofaself-dopedglass(SDG)thatincludesquenched-innuclei.
Theresults illustratethatAMZ4 isverysensitive tocrystallization,even inlaser-basedAM conditions, whereheatingandcoolingstepsneedtobedistinguished.
© 2021TheAuthor(s).PublishedbyElsevierLtdonbehalfofActaMaterialiaInc.
ThisisanopenaccessarticleundertheCCBY-NC-NDlicense (http://creativecommons.org/licenses/by-nc-nd/4.0/)
Metallic Glasses (MGs) refer to alloys that have the abil- ity to solidify in the amorphous state upon cooling from the melt provided that the cooling rate is high enough [1]. AMZ4 is one of the Zr-based MGs free of Be and Ni. It has been de- signed in the last decade andis composed of Zr,Cu, Al, and Nb (Zr59.3Cu28.8Al10.4Nb1.5,inat.%)[2].
Thecostisoneofthemaincriteriafortheselectionofanalloy forindustrialapplications.Industrial-gradealloysareoftenlessex- pensive,buttheycontainmoreimpurities,suchasoxygen[3].The adverse effectof oxygencontent ontheglass-forming abilityand thermalstabilityofZr-basedbulkMGs(BMGs)hasbeenpreviously studied[4,5].
Industrial-grade AMZ4 powder has recently gained great at- tentioninlaser-basedadditivemanufacturing(AM)methods,such aslaser powder-bedfusion(LPBF)[6–11].Customizeddesign,low waste, the possibility of producing complex geometry andlarger size fabricationhavemadeLPBFaprominentcandidatecompared tootherconventionalprocessingmethodssuchascasting[12].
Sincetheinteractiontimebetweenthelaserandthedeposited powder isshortandconfinedto asmallvolumethelocalcooling rate (βc) can reach 103 to108 K/s [13], which istypically higher
∗Corresponding author.
E-mail address: navid.sohrabi@epfl.ch (N. Sohrabi).
thanthe criticalcoolingrate(βcc) ofmostMGs[1,14,15]. Several
BMGs basedon Al [16], Cu [17],Fe [18],Ti [19], Zr[6–11,20–23], andPd[24]havebeenfabricatedviaLPBF.
Although the mentioned processing techniques induce high coolingrates,crystallizationofindustrial-gradeAMZ4hasbeenre- ported in several studies [6–11,21]. According to Liu et al. [25], crystallization in AM-produced Zr-based (Zr65Cu15Ni10Al10) BMG parts occurs upon reheating the solidified material during laser processingdue tothe adding ofnewlayers. Yang et al.[22] and Ouyangetal.[23]investigatedLPBFofaZr55Cu30Ni5Al10BMGand underlined the time spent above the crystallization temperature (afew milliseconds) inthe heat-affected zone (HAZ) of themelt pool ascrucial forthe crystallization process. However, thecrys- tallizationtemperaturewasmeasured byconventional differential scanning calorimetry (DSC)at a heatingrateof 20K/min, which isfarbelowtheheatingandcoolingratesexperiencedintheLPBF process.It iswellestablished thatan increase intheheatingrate significantlyinfluencesglasstransitionandcrystallizationtempera- tures[10].Therefore,tounravelthereasonbehindcrystallization,a characterizationtechniqueconsideringhigherheatingandcooling ratesisrequired.
Fastdifferentialscanningcalorimetry(FDSC)hasmadepossible detailedstudies ofstructure formation at heatingrates (βh) and coolingrates(βc)ofuptomorethan104 K/s[26].Thistechnique
https://doi.org/10.1016/j.scriptamat.2021.113861
1359-6462/© 2021 The Author(s). Published by Elsevier Ltd on behalf of Acta Materialia Inc. This is an open access article under the CC BY-NC-ND license ( http://creativecommons.org/licenses/by-nc-nd/4.0/ )
N. Sohrabi, J.E.K. Schawe, J. Jhabvala et al. Scripta Materialia 199 (2021) 113861
has been extensively used to studycrystallization in various MG alloys [27–34]. Ericssonet al.[21] prepared a TTT diagram upon cooling for AMZ4by FDSC andalso usedit fora numerical sim- ulation of the LPBF process. However, a corresponding TTT dia- gram upon heating, andcontinuousheatingandcooling transfor- mation(CHTandCCT)diagrams,woulddescribemorerealistically theAMprocess.Inourpreviousstudy[10],usingnumericalsimu- lationsweestimatedthattheheatingandcoolingratesofLPBFon AMZ4were1×106K/sand5×105K/s,respectively.Despitethese highratesnanocrystalsweredetectedintheHAZ.Theoriginofthe crystallizationbehavioratsuchhighratesoftemperaturechanges needstobebetterunderstood.
Despite the great interest in the applicationof AMZ4,knowl- edge on the solidification process and crystallization of thisma- terialisstill limitedandthefewreporteddatadiffersignificantly fromoneanother[2,6,21,35–37].However,suchdataareimportant inorder toadjusttheprocessingparameters toincreasethe rela- tivelylowthermalstability,whichisoneofthemaintechnological problemsduringtheprocessingofthismaterial.
In this work, the critical cooling and heating rates (βcc and
βhc) ofindustrial-grade AMZ4havebeen measured by FDSC and time-temperature-transformation(TTT)diagramsuponheatingand cooling, andcontinuousheatingand coolingtransformation (CHT andCCT)diagrams,havebeenexperimentallyconstructed.There- sultsofthepresentstudycanthusbeusede.g. forfiniteelement simulations of AM or casting processes to predict crystallization anddescribetherelatedprocessingconditions.
Pre-alloyed gas-atomized amorphous AMZ4 powder (with an oxygen content of around 1300 ppm [10]), supplied by Heraeus Additive Manufacturing GmbH, with a nominal chemical compo- sitionofZr59.3Cu28.8Al10.4Nb1.5wasusedfortheFDSCexperiments.
ThemeasurementswereperformedusingaFlashDSC2+(Metter- Toledo)witha UFH-1 sensorandequippedwithan HC100 intra- cooler (Huber);fordetailsseeRefs. [26,38].Toreducetheoxygen content of the purge gas, the sensor support wassealed with a screw-on lid, andargon (99.999% purity) witha flow rate of 80 ml/minwasused.Thetemperatureofthesensor supportwasset to−40°C.Thepreparationstepforthesensor(denotedas“correc- tion”)wasperformedatthesameconditions.Forsampleposition- ing, theactivezone onthesamplesideofthesensorwaswetted withathinfilmofsiliconoil(AK60000fromWackerChemie).Be- forethefirstmeasurement,thesamplewaspurgedfor45min.The oilevaporatesanddecomposesduringthefirstheating.
In prior experiments,it was found that the crystallization ki- neticsofindividual powderparticlesshowslargevariationsofthe critical heating rate withvalues between 30,000 and more than 60,000K/s.Thismaybeduetotheinfluenceofsamplesizeonthe crystallization kinetics,which occursfor samplesbelow a critical size [28]. Therefore, the sample size was varied to find the op- timum experimental conditions.Fluctuations are significantly re- duced(to between40,000and50,000K/s)insamplescontaining three to fiveparticles,with atypical overall massof0.3 μg. The
particles were molten together on thesensor insuch a waythat they forma singleparticle, asa collectionof individual particles usuallyleadstomultiplecrystallizationevents.
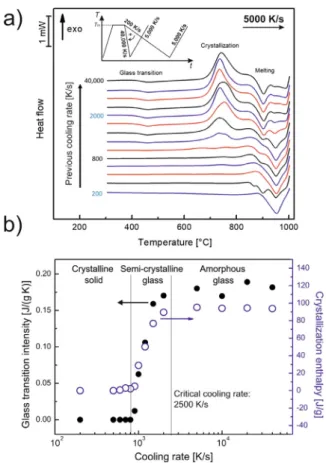
Tomeasurethecooling-ratedependenceofcrystallization,sam- pleswerecooledwithratesbetween200K/sand40,000K/sfrom the liquid state, andsubsequentlyheated at5000K/s. The time- temperaturecurvesareshownasinsetinFig.1a.Theglasstransi- tionoccursabove400°Candcrystallizationoccursbetween650°C and 800 °C, followed by a complex melting range.The intensity of the glass transition (Cp) and the enthalpy of crystallization (Hc)areplottedagainstthecoolingrateinFig.1b.Weevaluated both eventssimultaneously to havean additionalindication that the samplewaspreviously amorphousafterfastcooling andthat the exothermalpeak can be interpreted as a crystallization pro-
Fig. 1. (a) FDSC scan of AMZ4 measured with 50 0 0 K/s heating rate after cooling at different rates ( βc) from 200 K/s to 40,0 0 0 K/s (the inset illustrates the applied temperature-time program). (b) Intensity of the glass transition and enthalpy of crystallization of AMZ4 during heating as a function of the previous cooling rate (log scale). Three regions corresponding to a crystalline solid, a semi-crystalline glass and an amorphous glass can be distinguished.
cess.Atcoolingwithrelativelylowrates(200K/s≤βc<800K/s) the sample crystallizes completely. Thus, no glass transition and crystallizationoccurduringheating.Aftercoolingbetween800K/s and2500K/s,theglasstransitionintensityandthecrystallization enthalpyincreasewithincreasingcoolingrate.Thisisthecooling- raterangethatleadstoasemi-crystallineglass,i.e.aMGcompos- itethatconsistsofaglassyandcrystallinephase.Whencoolingat higherrates(βc>2500K/s),thesampledoesnotcrystallizeany- more,andHcandCp remainconstant.Consequently,thecriti- calcoolingrateisdeterminedtobe2500K/s.Inourpreviouswork [10],usingfiniteelement(FE)simulations,wecalculatedβc inthe meltpooloftheLPBFprocessas5×105 K/s,whichistwoorders ofmagnitudefasterthantheβcc ofAMZ4.Therefore,intheLPBF
process theinitialcooling cyclefromthe meltshould notlead to crystallizationofAMZ4.
The FDSC curves in Fig. 1a show a complex melting process withtwomainpeaksatapproximately905and950°C.Inthecase wherethesampleiscompletelycrystallized duringcooling(βc ≤ 800K/s),themainmeltingpeakisat950°C.Aftercoolingatrates largerthanβcc =2500K/s,itisat905°C.Thedifferenceinmelt- ing temperatures indicates the appearance oftwo differentcrys- tallinephasesthatformduringslowcoolingorheatingoftheglass [39].
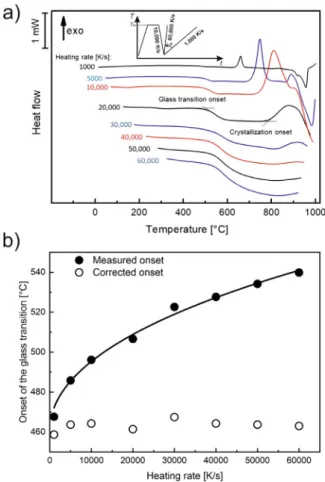
To determine the critical heating rate, AMZ4 was heated at different rates between 1000 and 60,000 K/s (Fig. 2a). As illus- tratedintheinsetforthetemperature-timeprogram,afterachiev- ingastableliquidthesamplewascooledwithaβc of10,000K/s, whichisfourtimesthecriticalcoolingrate,toensurethataglass has formed after cooling. The curves in Fig.2a indicate that the 2
Fig. 2. (a) FDSC curves of AMZ4 measured at different heating rates ( βh) between 10 0 0 K/s and 60,0 0 0 K/s after cooling the melt at a rate of 10,0 0 0 K/s (the inset illustrates the applied temperature-time program). (b) Measured onset of the glass transition versus heating rate (solid dots) and fit according to eq. (2) ; the open dots are the corrected onset temperatures.
measured onset temperatures for the glass transition and crys- tallizationincreaseandthatthe crystallizationenthalpy decreases withincreasingheatingrate.Whenheatingwithβh >40,000K/s, nocrystallizationoccurs.Thus,thecriticalheatingrateofAMZ4to bypass crystallization isdetermined to be βhc ≈ 45,000K/s. The comparison ofthe criticalscanning ratesshows that βcc = 2500 K/s βhc, whichrevealsthat a self-doped glass(SDG) compris- ingquenched-innucleihasformed(formoredetails,seeRef.[40]).
The numerically computedheating andcooling ratesof AMZ4 in theLPBFprocessare1×106K/sand5×105 K/s[10],respectively, andthusmuchhigherthanthecriticalvaluesmeasuredhere.Nev- ertheless,crystallizationhasbeendetectedin[10],illustratingthat (constant) critical heating and cooling rates are not enough to describe the AMZ4 crystallization behavior in the LPBF process.
Thishasalsobeendemonstratedin[32],whereBMGcastingwas monitoredbyhigh-speedinfraredexperimentsandcomplementary FDSCstudies.
Todetermine therealonsettemperatureofcrystallization,the measured onsettemperature hasto be corrected considering the influence of heat-transferconditions inthe calorimeter.The sim- plest correction considers the thermal lag (τ), where the mea-
sured onset temperature of a thermal event(Ton,m) is described by[41]:
Ton=Ton,m−τβ, (1)
whereTon istherealonsettemperatureofthethermaleventand
β isthescanningrate.
Usually τ is rateindependent. Using small samples and high heatingrates,the linearapproachofeq. (1)may,however,bevi-
olated. In such a case, the measured onset temperatureis better describedbyaphenomenologicalequation[42]:
Ton,m=Ton+aβ+bβ0.5, (2)
whereaandbareconstants.Theheating-ratedependentapparent thermallagisthen:
τ(β)=a+bβ−0.5. (3)
Theparameters forthetemperaturecorrection are usuallyde- termined by the use of calibration materials (pure metals). For FDSC, the temperature corrections depend strongly on the heat contactbetweenthesensorandthesampleandtheheat-transfer conditions in the sample [43]. Consequently, the thermal lag should be determined directly from the sample under investiga- tion.BecauseofthecomplexmeltingbehaviorofAMZ4theuseof themelting-peakonsetisnot straightforward,butanotheroption is the glass transition. If the glass transition temperature (Tg) is determinedasa limitingfictivetemperature[44,45],theTg ofan non-annealedsampleandthewidthofthetransformationdepend onlyon the cooling ratebutare independentof theheatingrate [46,47]. In the heating-rate rangeused the apparent heating-rate dependenceofnon-annealedglassesisthuscausedbythermallag.
Theheat-flowcurvesinFig.2aaremeasuredafterpreviouscooling ata rateof10,000 K/s.The thermallag isthen determinedfrom the onset temperature of Tg (Fig. 2b). The solid curve in Fig. 2b is the fit result of Eq. (2) to the measured values, with the pa- rametersTon= 461.0°C,a =-1.15×10⁻⁴ s andb =0.35(K.s)0.5. Theresulting correctedonsetsof Tg areindependentofthe heat- ingrateandapproximately465°C.Comparisonwiththeuseofthe heating-ratedependentmeltingtemperaturesofPbandIntocor- rectforthermallagrevealedthattheuncertaintiesathighheating ratesarelargerthanwiththepresentedmethod.
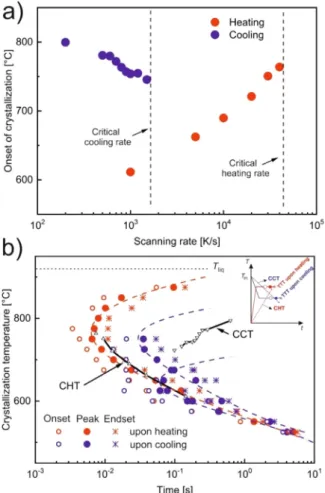
The corrected onset temperatures of the crystallization peaks uponheatingandcooling havebeendeterminedfromEq.(1)and areplottedinFig.3aasafunction ofthe scanningrate.Thisdia- gramindicatesalsothecriticalcoolingandheatingrates.
TheTTTdiagramsofAMZ4measureduponheatingandcooling arepresentedinFig.3b.ToobtaintheTTTdiagramupon heating, the samplewas cooled from the melt with a rate of20,000 K/s (eighttimesβcc)tofarbelowtheglasstransitiontemperature,and subsequently heated with a rate of 50,000 K/s (faster than βhc) tothe crystallizationtemperature (Tx). Duringan isothermal seg- ment at Tx, a crystallization peak appears. The times of the on- set,peak,andend-setwere determinedandplottedinFig.3b.In the region of maximum crystallization rate, the data scatter sig- nificantly (at a logarithmic scale), which is due to the stochas- tics ofnucleation nearthe noseof the TTTdiagram [40] and, in thepresentcase,theexperimental uncertaintyofmeasuringsuch smallonset timescloseto the time resolutionofthe sensor. The TTTdiagramuponcoolingisdeterminedinasimilarway.Samples were cooled directly from the melt with 20,000 K/s to Tx. Usu- ally,themaximumrateofnucleationoccursattemperatureslower thanthe maximumrateofgrowth[48]. Consequently,byheating fromtheglassy stateaself-dopedglass[40]includesmorenuclei before isothermal crystallization than a sample that is quenched fromthemelt.Therefore,theTTTdiagram uponheatingisshifted toshortertimescomparedtotheoneuponcooling,whichhasalso beenobservedforotherMGs[29].Thelackofnucleiathightem- peratures upon cooling from the melt (due to a low nucleation rate)explainsthemissingdatapointsintheTTTcurveuponcool- ing. This TTT curve is bimodal, with a maximum crystallization rate (nose) at about 750 °C and a second one at 640 °C. Thus, differentkinds ofnuclei mightform attheserelatively low tem- peratures.ThepeaktimeattheuppernoseoftheTTTcurveupon cooling is around 35 ms, which islonger than that measured in Ref. [21]. This discrepancy may be attributed to the fact that in