Margin (Hikurangi Margin, New Zealand)
K. F. Kroeger1 , G. J. Crutchley1,2 , R. Kellett1 , and P. M. Barnes3
1GNS Science, Lower Hutt, New Zealand,2GEOMAR Helmholtz Centre for Ocean Research, Kiel, Germany,3National Institute of Water and Atmospheric Research, Wellington, New Zealand
Abstract
We present a three‐dimensional gas hydrate systems model of the southern Hikurangi subduction margin in eastern New Zealand. The model integrates thermal and microbial gasgeneration, migration, and hydrate formation. Modeling these processes has improved the
understanding of factors controlling hydrate distribution. Three spatial trends of concentrated hydrate occurrence are predicted. Thefirst trend (I) is aligned with the principal deformation front in the overriding Australian plate. Concentrated hydrate deposits are predicted at or near the apexes of anticlines and to be mainly sourced from focused migration and recycling of microbial gas generated beneath the hydrate stability zone. A second predicted trend (II) is related to deformation in the subducting Pacific plate associated with former Mesozoic subduction beneath Gondwana and the modern Pacific‐Australian plate boundary. This trend is enhanced by increased advection of thermogenic gas through permeable layers in the subducting plate and focused migration into the Neogene basinfill above Cretaceous‐Paleogene structures. The third trend (III) follows the northern margin of the Hikurangi Channel and is related to the presence of buried strata of the Hikurangi Channel system. The predicted trends are consistent with pronounced seismic reflection anomalies related to free gas in the pore space and strength of the bottom‐simulating reflection. However, only trend I is also associated with clear and widespread seismic indications of concentrated gas hydrate.
Total predicted hydrate masses at the southern Hikurangi Margin are between 52,800 and 69,800 Mt.
This equates to 3.4–4.5 Mt hydrate/km2, containing 6.33 × 10⁸–8.38 × 10⁸m3/km2of methane.
Plain Language Summary
Gas hydrates are ice‐like substances of natural gas enclosed in a lattice of water molecules. They are stable under pressure and temperature conditions found beneath the sea‐floor offshore beyond continental shelfs. Gas hydrates house a significant part of the natural gas methane contained in the geosphere and hence are a potential energy resource. However, if methane is released into surface systems through decomposition of gas hydrates, for instance, due to an increase in ocean bottom temperatures, it will contribute to ocean acidification, and may acerbate climate warming. Hence, quantification and a better understanding of controls on formation and distribution of gas hydrates is important. Here we present a basin‐wide study predicting hydrate formation offshore eastern New Zealand, where the Pacific plate is subducted beneath the Australian plate. We explore the implications of deep gas generation and migration patterns in this setting for gas hydrate formation and distribution.1. Introduction
Gas hydrates and associated subhydrate gas accumulations are attracting increasing economic interest due to the very large amount of methane stored in their crystalline structure (Boswell, 2009; Collett et al., 2009; Fujii et al., 2015). In addition, there is an ongoing debate regarding the response of gas hydrates to climate and ocean warming (Berndt et al., 2014; Biastoch et al., 2011; Boudreau et al., 2015; Kroeger et al., 2011; Ruppel & Kessler, 2017). Quantification of gas hydrate occurrence is essential for addressing these topics, but available geophysical methods are associated with significant quantitative uncertainties whilst well data globally are sparse. Hydrate systems modeling can be used as an additional tool to identify sites of potential concentrated hydrate deposits for further detailed geophysical studies and to estimate masses of hydrates on a basin scale (Burwicz et al., 2017; Crutchley et al., 2017; Fujii et al., 2016; Kroeger et al., 2015, 2017)
©2019. American Geophysical Union.
All Rights Reserved.
Key Points:
• Gas hydrate system modeling predicts three pronounced spatial trends in gas hydrate distribution along the southern Hikurangi Margin
• Hydrate distribution is controlled by sources of microbial and
thermogenic gas, basinfill architecture, and convergent margin deformation
• Predicted volumes of gas stored in gas hydrate warrant further exploration as an energy resource in New Zealand
Supporting Information:
•Supporting Information S1
Correspondence to:
K. F. Kroeger, k.kroeger@gns.cri.nz
Citation:
Kroeger, K. F., Crutchley, G. J., Kellett, R., & Barnes, P. M. (2019). A 3‐D model of gas generation, migration, and gas hydrate formation at a young convergent margin (Hikurangi Margin, New Zealand).Geochemistry, Geophysics, Geosystems,20, 5126–5147.
https://doi.org/10.1029/2019GC008275
Received 18 FEB 2019 Accepted 19 AUG 2019
Accepted article online 14 OCT 2019 Published online 19 NOV 2019
The integration of hydrate formation modeling in the petroleum systems modeling software PetroMod™
(Piñero et al., 2016) has led to significant progress in reconstructing gas hydrate systems. Gas hydrate sys- tems models are used to reconstruct the thermal and pressure regime that controlled hydrate stability throughout basin evolution. In these models the generation of thermogenic and biogenic gas is integrated with gas migration and hydrate formation prediction. Models can be used to better understand how the gas budget and the stratal and structural architecture in the basin affects gas migration and hydrate forma- tion through geological time.
The presence of gas hydrates is commonly inferred from the occurrence of a bottom simulating reflection (BSR), which is visible on seismic reflection data due to the impedance contrast between sediments hosting gas hydrate overlying sediments containing at least small amounts of free gas (e.g., Haacke et al., 2007). A continuous BSR is most common in homogenous, often mud‐dominated sediments, whereas heterogeneity in sediment composition or structure commonly leads to highly heterogeneous gas distribution and a discon- tinuous BSR (Shedd et al., 2012). Locally concentrated hydrate accumulations, in particular if formed from thermogenic gas and consisting of structure II hydrate, may not be represented by a clear BSR at all (Haacke et al., 2007; Holbrook et al., 1996; Hornbach et al., 2012; Paganoni et al., 2016).
PetroMod™2‐D and 3‐D models have been used to successfully reproduce hydrate distributions inferred from seismic data (Crutchley et al., 2017; Fujii et al., 2016; Kroeger et al., 2015, 2017). Consistent with geo- chemical data, most models suggested that microbially generated methane is the most important source for widespread gas hydrate formation (Burwicz et al., 2017; Crutchley et al., 2017; Fujii et al., 2016; Kroeger et al., 2015). Models further suggested that the formation of concentrated hydrate deposits commonly relied on focused migration of either microbial methane or thermogenic natural gas, often as a free gas phase through interconnected permeable strata, faults, and fracture zones. Focused migration of gas is considered to be a major process leading to the formation of prospective hydrate accumulations in sandstones (Boswell et al., 2012; Liu & Flemings, 2007; You et al., 2015). However, concentration of hydrate may also be achieved through continuous recycling of methane related to sedimentation or tectonic uplift, resulting in relative upward migration of the base of gas hydrate stability (BGHS), dissociation of hydrates and re‐incorporation of gas into newly‐formed hydrate above (Bünz et al., 2003; Burwicz et al., 2017; Crutchley et al., 2018; Paull et al., 1994; Rempel & Buffett, 1997)
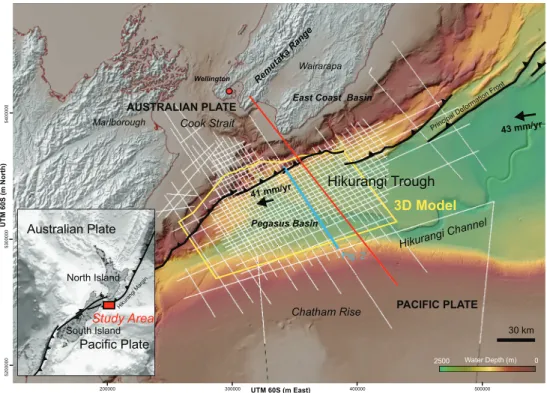
In this study, we investigate mechanisms for gas hydrate formation and resulting hydrate distribution using a 3‐D model of the southern Hikurangi Margin, New Zealand (Figure 1). We interrogate the model to assess the impact of organic matter content, thermal conditions and gas migration patterns on hydrate distribution and quantity. The Hikurangi Margin is a well‐established hydrate province (Crutchley et al., 2011; Faure et al., 2006; Fraser et al., 2016; Henrys et al., 2009; Katz, 1981; Pecher et al., 2004), where consistent with the majority of convergent margins worldwide, analysis of seep fluids suggests a predominantly microbial origin of methane (Coffin et al., 2014; Faure et al., 2010;
Greinert et al., 2010). However, onshore oil and gas seeps from the accretionary wedge in the North Island of New Zealand suggest the presence of mature petroleum source rocks (Rogers et al., 1999).
In addition, seismic velocity analysis and geometric reconstruction of the trench basin (Pegasus Basin) suggest that deeply sourced fluids contribute to the formation of concentrated hydrates in the Hikurangi Margin province (Plaza‐Faverola et al., 2012). Migration of thermogenic gas generated near the subduction interface through buried sandy carrier beds has been predicted using 2‐D PetroMod™
modeling (Kroeger et al., 2015). However, two‐dimensional models are limited in assessing the basin wide impact of sedimentary and structural elements on gas migration and hydrate formation.
PetroMod™3‐D hydrate systems modeling carried out in this study reconstructs regional gas migration and hydrate formation in three dimensions and thus improves gas hydrate volume predictions. We com- pare the model results with seismic indicators for the presence of hydrates and free gas and derive a quantitative estimate of the hydrate volume at the southern Hikurangi Margin.
2. Geological Setting
The modern plate boundary through New Zealand runs in a NNE‐SSW direction from the Kermadec Trench in the north, along the Hikurangi Margin east of the North Island and into the Marlborough region of north- east South Island, before transitioning into the Alpine Fault of central South Island (Mortimer et al., 2017;
Figure 1). Across southern North Island subduction and upper plate deformation accommodates oblique convergence of ~41–43 mm/year between the Pacific and Australian plates east of New Zealand's central North Island (Beavan & Haines, 2001). The normal component of plate convergence across the continental margin decreases southward to about 20 mm/year offshore southern Wairarapa, in association with the along‐strike transition from Hikurangi subduction to strike‐slip faulting in northern South Island (Barnes et al., 1998, 2010; Litchfield et al., 2018; Wallace et al., 2004, 2012). The southern part of the imbricated accretionary wedge of the overriding Australian plate extends 40 km off southeastern Wairarapa, where it gives way to the southern Hikurangi Trough, seaward of the deformation front at ~2500 m water depth (Figure 1). The basin is filled with more than 10 km of Cretaceous to Recent sedimentary rocks and sediments, including a 6 km thick succession of inferred Neogene sediments that thin southeastward and onlap the Chatham Rise (Bland et al., 2015; Plaza‐ Faverola et al., 2012). Late Neogene channel and overbank sediments are interpreted to be similar to Recent deposits of the Hikurangi Channel system (Barnes et al., 2010; Lewis et al., 1998; Lewis & Pantin, 2002; Mountjoy et al., 2018) and consist of mudstones with intercalated silt and sandstones related to channel/levee complexes and overbank deposits. This system transports sediments derived from the uplifting southern Alps and other areas along the east coast of North Island into the southwest Pacific Basin northeast of New Zealand (Lewis, 1994). Neogene sedimentary strata within Pegasus Basin are largely undeformed, but become progressively more deformed closer to the plate boundary before being incorpo- rated into the accretionary wedge.
The southern part of Pegasus Basin, where it gives way to the northward sloping Chatham Rise, is underlain by an east‐west trending accretionary wedge of Cretaceous age related to Mesozoic south‐vergent subduction beneath the Gondwana margin (Bradshaw, 1989; Wood & Davy, 1994; Figure 1). Mesozoic Torlesse grey- wacke rocks were deposited seaward of the northern Gondwana continental margin. These rocks were in part incorporated and deformed as part of the Mesozoic accretionary wedge prior to subduction termination (Bland et al., 2015; Plaza‐Faverola et al., 2012). Subduction beneath Gondwana ceased when the young buoyant Hikurangi Plateau entered the subduction system at about 105 Ma (Davy et al., 2008). Late Figure 1.Map of the study area showing the outline of the PetroMod™3‐D model (yellow polygon), seismic reflection surveys used in this study (white lines), the location of the 2‐D model of Kroeger et al. (2015, red line), plate conver- gence vectors (yellow arrows) based on Beavan and Haines (2001,), and thrusts of the principal deformation front (black lines, after Barnes et al., 2010 and Micallef et al., 2014). The blue line indicates the transect shown in Figure 2.
Cretaceous to Paleogene rocks cover the topography of the buried accretionary wedge in southern Pegasus Basin. These units likely contain source rocks equivalent to organic rich onshore units such as the Waipawa Formation (Hollis et al., 2014).
3. Data and Methodology
3.1. Seismic Mapping
Eleven horizons including sea‐floor and basement were mapped, using 2‐D seismic reflection data (Figures 1 and 2) of the PEG09 and APB13 petroleum industry surveys and several academic seismic lines including geoDyNZ and OGC‐92 (Collot et al., 1994). The horizons represent widely mappable events in the basin.
The stratigraphic framework shown in Figure 2 is based on that of Plaza‐Faverola et al. (2012). Figure 2a shows the Peg09‐17 seismic reflection line with the simplified gridded time horizons used for constructing the PetroMod™3‐D model. Lacking direct well control, Late Miocene to Plio‐Pleistocene horizons were traced into the basin from the northwest Chatham Rise, where strata are very condensed and could be sampled (Barnes, 1994; Davy et al., 2008). The pronounced increase in thickness between the dated con- densed section and the time equivalent succession in the basin results in some uncertainty regarding the age of intervals (see Figure 2 and Table S1 in the supporting information for model ages). Mapped horizons were gridded and depth converted with Paradigm Skua software using the velocity relationships of Plaza‐ Faverola et al. (2012), which were simplified to be applicable across the entire model area, and subsequently imported into PetroMod™software. A section through the resulting 3‐D model in depth along the Peg09‐17 line is shown in Figure 2b. The model only partially includes the complex fold and thrust belt west of the main deformation front of the modern Hikurangi accretionary wedge. The architecture of the Mesozoic Figure 2.(a) Seismic line PEG09_17 showing gridded and simplified time horizons used for 3‐D PetroMod™model con- struction and(b) corresponding section through the PetroMod 3‐D model. See Figure 1 for location. Note that internal structures, faults, and offsets within the Neogene and Mesozoic accretionary wedges are omitted for simplicity. Striped pattern indicates the interval modeled as source rocks for thermogenic gas.
accretionary wedge beneath the Chatham Rise is internally complex and consists of northwest vergent wedges that in part have been thrusted over undeformed Cretaceous sediments. The Mesozoic wedge likely has low permeability and low gas generation potential. Hence the wedge was geometrically simplified and modeled as a single unit.
3.2. Modeling Procedure and Scope
PetroMod™v. 2016 software was used for modeling basin evolution, gas generation and migration, and hydrate formation in 3‐D. The model was designed to assess basin‐wide mechanisms controlling gas hydrate formation and to identify geological factors that affect the distribution patterns of gas and gas hydrates in the basin. At this scale, and due to the absence of well data and 3‐D seismic data, we do not carry out a detailed analysis of individual prospects and the impact of smaller scale features such as faults and individual sedi- ment beds on gas migration and hydrate formation. However, the setup of the model allowed extensive test- ing of key parameters such as heatflow, organic matter distribution and regional carrier bed architecture on gas hydrate distribution across the basin.
PetroMod™is an industry software developed for petroleum systems modeling (Baur & Katz, 2018; Di Primio & Neumann, 2008; Hantschel & Kauerauf, 2009; Kroeger et al., 2009). In order to reconstruct the basin history, present‐day units as defined by the mapped horizons were decompacted and their deposition forward modeled over time intervals as defined by their stratigraphic age, starting with the oldest layer.
While the model was confined to a laterally static base grid, previous models have demonstrated that increasing the thickness of the accretionary wedge reproduces the thermal effects of subduction on overlying strata reasonably well (Kroeger et al., 2015). To achieve this effect, we have thickened the Miocene interval over time to the present‐day mapped thickness (Figure 2b). Sedimentary facies were mapped using seismic facies analysis (see following paragraph). Using onshore analogues (Bland et al., 2015) and investigations of the present day Hikurangi Channel system (Barnes, 1992; Lewis & Pantin, 2002), the mapped units were assigned broad lithological properties (Table 1) to compute petrophysical properties changing during burial and compaction, which are calculated using Athy's law (Athy, 1930). To accommodate facies variation and to achieve sufficient resolution for gas hydrate modeling, in particular in the Pleistocene section, the model was further subdivided. Thefinal model had 34 layers (Table S1) and was gridded to a lateral resolution of 500 m and subdivided to achieve a typical vertical resolution of 50−80 m, decreasing downward. This reso- lution is a reflection of compromising between the spacing of the available 2‐D seismic data and avoiding gridding artefacts and the desire to incorporate higher resolution present‐day bathymetric data to constrain the depth of the BGHS in the model. We adopt the age model of Kroeger et al. (2015) for the definition of time steps (Figure 2b). No erosion was considered. Ages for individual layers were derived by interpolation between model ages of the mapped horizons. The resulting spatial and temporal resolution was deemed to be appropriate to reproduce the main driving mechanisms for gas hydrate formation and to predict aver- age saturations across the basin. As part of the modeling exercise, various scenarios were run to thermally Table 1
Lithological Parameters Used in the Model
Unit Sand Silt Shale Porosity [%] Permeability [log (mD)] Thermal Conductivity
[%] [%] [%] at seafloor at 2000 m burial at 25% porosity at 1% porosity [W/m/K] at 20°C
Neogene Silty Sandstone 50 40 10 49.5 21.04 0.8 ‐4.25 3.1
Neogene Sandy Mudstone 10 50 40 59.6 18.03 ‐1.4 ‐6.73 2.3
Oligo‐Miocene Chalk 40% Calcite 65 11.58 ‐3.1 ‐6.75 3.2
Paleogene Marl 50 19.03 ‐2.25 ‐5.05 2
Paleocene (Whangai, Waipawa) 20 40 40 52 18.67 ‐0.17 ‐4.67 2.31
Paleocene (Te Uri Member) 100 41 22.52 3 ‐1.8 3.95
Late Cretaceous−Paleocene 20 40 40 52 18.67 ‐0.17 ‐4.67 2.31
Middle Cretaceous 20 40 40 52 18.67 ‐0.17 ‐4.67 2.31
Mesozoic Accretionary Wedge Compacted Arcose N/A 4.69 2 ‐2.8 2.3
Hikurangi Plateau Basalt N/A 1 ‐ ‐ 2.1
Note. Porosity and permeability values at depth in the table assume hydrostatic pore pressures. Note that the permeable Te Uri member is only used in scenarios B and C.
calibrate the model (see section 2.4.). Different scenarios were further used to vary poorly defined parameters such as organic matter content in sediments and carrier bed permeability.
3.3. Facies Mapping
Different phases of Pleistocene Hikurangi Channel incision and deposition of channel/levee complexes are clearly evident within the 2‐D reflection seismic data from seismic morphology and reflection characteris- tics. Piston and gravity core data document litholgies ranging from gravel and sand dominated channelfill deposits to mud dominated overbank deposits with silty and sandy interbeds (Lewis & Pantin, 2002). We used the seismic characteristics (geometry and amplitude) to map out successive phases of channel/levee and overbank deposition in space and time. We also used these characteristics to broadly map older, likely sandy units in the Neogene basinfill. An additional source of sandy deposits are detached canyons feeding sediments into forearc subbasins (McArthur & McCaffrey, 2019). Due to the lack of any well control and given the resolution of the model, only two upscaled lithologies have been assigned in the Plio‐ Pleistocene interval: silty mudstone with minor sand for the majority of overbank deposits and silty sand- stone with minor mud for channel/levee complexes and turbidite fan related basinfloor deposits (Table 1 and Figure 3). Lithological characteristics were defined in PetroMod™using default rock properties mod- ified using the data of Funnell et al. (1996). Broad lithological properties were also assigned to Paleogene and Cretaceous rocks (Table 1) using seismic characteristics (Wood & Davy, 1994) and outcrop analogues (Bland et al., 2015).
3.4. Thermal Boundary Conditions and Calibration
Predicting appropriate pressure and temperature conditions is essential for hydrate stability modeling (see supporting information for more detail on parameters used). While pore pressure increase with depth in the shallow section is generally close to linear, the thermalfield is more complex. The thermal evolution of the basinfill is important for both gas generation and gas hydrate stability. The thermal regime in the model is defined by thermal boundary conditions assigned at the base of the model and at the sea‐floor and by lithological properties (Table 1), of which thermal conductivity is most important. We used analogue data from the Taranaki Basin to assign appropriate thermal conductivity values (Funnel et al., 1996).
Present‐day bottom water temperatures were derived by translating water column temperature data of Ridgway (1969) into seafloor water temperature values ranging from 2°C in the deeper parts of the basin to 10°C in the shallowest part. Proxy data to the south of the study area suggest ~4°C colder average sea sur- face temperatures in the Pleistocene compared to present‐day values (Panitz et al., 2015). These were used to adjust present‐day water column curves. The lower limit, however, was set to 1°C at the sea‐floor (see Figure S1 in the supporting information for modeled sea‐floor temperature maps at present‐day, during the Figure 3.(a) View of the PetroMod™3‐D model from the southwest showing the entire model with the Hikurangi Channel (yellow at the surface down to the lower crust (pink and purple) on the left side and (b) cut away view from the same perspective with several transects through the model showing facies reconstructed within the 3‐D model.
Pleistocene and during the Pliocene). The basal thermal condition is defined as heat flow into the model. This value is poorly constrained and a range of models with different heatflow were run to achieve the best calibration result.
For thermal calibration of the model, in the absence of any well data, we used the approximate sub‐seafloor depth of the BSR. For this purpose, we mapped the BSR from all available seismic data, gridded and depth converted the mapped surface, and then imported it into PetroMod™as a reference horizon (Figure 4). The depth conversion was based on a representative velocity (1900 m/s) between the seafloor and the BSR within the central parts of the model domain, based on published velocity analyses (Crutchley et al., 2016; Plaza‐Faverola et al., 2012). For calibra- tion it is assumed that the BSR indicates the lower limit of the present‐ day stabilityfield of pure methane hydrate. This is consistent with earlier results suggesting that the widespread BSR at the southern Hikurangi Margin primarily formed from diffusive migration of biogenic methane (Kroeger et al., 2015). There is no indication of strongly transient thermal conditions, such as the occurrence of“metastable”hydrate resulting in double BSRs in the trough basin (Pegasus Basin). Much further north on the Hikurangi Margin double BSRs indicate pronounced uplift or significant changes in the thermal regime (Pecher et al., 2017). We there- fore have confidence that the BSR is a good indicator for the present‐day thermal regime.
3.5. Gas Generation Potential
Measured organic carbon contents in Neogene sediments in the East Coast Basin are between 0.55 and 1% total organic carbon (TOC;
Ventura et al., 2013). Onshore equivalents of Cretaceous to Paleogene rocks typically contain 0.5–5% organic carbon. Of these units, the late Paleocene Waipawa Formation is richest in TOC and is considered to be a source for oil and gas seeps onshore (Hollis et al., 2014; Rogers et al., 1999). However, despite a relatively high TOC content, the petroleum gen- eration potential of the Waipawa Formation is relatively poor where sampled in outcrop (Naeher et al., 2019). The source rock potential of Paleocene and Cretaceous rocks incorporated deeper into the accretionary wedge or in the subducting plate is not known. A higher source rock potential of these rocks would explain the extensive oil and gas seepage.
To account for the uncertainty in organic matter content of Neogene rocks and the possible higher source rock potential of buried Paleocene and Cretaceous rocks compared to outcropping rocks, we have varied the TOC content between different mod- eling scenarios (Table 2). Thermogenic gas generation was modeled as a time dependent process using the Arrhenius equation and applying a conventional petroleum generation kinetic model. Analysis of equivalent rocks from modeled source rock intervals suggests that they are marine sediments, but contain significant or dominant proportions of terrestrially derived (type III) organic matter (Naeher et al., 2019). In PetroMod™ we therefore use an analogue type III kinetic model based on data from the North Sea (Ungerer, 1990).
Microbial activity and hence methane generation potential is also temperature dependent and reaches a maximum at around 37°C (Katz, 2011). Empirically, around 10 % of the available TOC is converted to methane during burial (Clayton, 1992). Incorporation of these parameters into a PetroMod™model resulted in a predicted maximum of microbial methane generation deep below the sea‐floor (1,600 m below seafloor in the model of Kroeger et al., 2015). Other models and measured data, however, suggest that microbial gas generation is at maximum near the seafloor and decreases with increasing burial and age (Middelburg, 1989;
Wallmann et al., 2006). In the present 3‐D model, microbial gas generation was modeled using both options;
the approach of Kroeger et al. (2015), linking gas generation to temperature dependent microbial activity, as Figure 4.3‐D model views showing the calibration of the model to the
mapped bottom simulating reflection (BSR) surface. (a) The view down onto the BSR surface and the bottom image (b) shows the BSR surface from below. The BSR surface topography is color coded to show the depth of the BSR below sea level. Model results are shown as a series of transects through the 3‐D model with the predicted area of hydrate stability using an average heatflow of 42 mW/m2shown in red. The view from above (a) shows areas where the model underpredicts (too hot) the methane hydrate stabilityfield (blue color above the BSR surface). The view from below (b) shows areas where the model overpredicts (too cold) the extent of the methane hydrate stabilityfield (red color below the BSR surface).
well as an approach, where the microbial methane formation rate is assumed to depend on the age of the organic matter and the sedimentation rate (Middelburg, 1989; Wallmann et al., 2006).
3.6. Gas migration and hydrate formation modeling
Gas migration was modeled using a combination of ray tracing (purely buoyancy drivenflow in carrier beds), two‐phase Darcy flow, and diffusion. In the Neogene interval, permeability is controlled by the mapped distribution of mud versus sand‐dominated facies. The lithological composition and migration properties of the Cretaceous–Paleogene section are poorly known and scenarios assuming overall low permeability have been contrasted with scenarios assuming the presence of at least one laterally contin- uous sandstone carrier interval with high horizontal permeability, for instance an equivalent of the Early Paleocene Te Uri Member of the Whangai Formation (Figure 2 and Tables 1 and 2; Rogers et al., 2001). In the hydrates module of the PetroMod™software, hydrate formation and presence is calculated by determining the equilibrium between methane dissolved in seawater (pore water) and methane hydrate (Piñero et al., 2016). This equilibrium is controlled by the dissociation pressure of methane hydrate in seawater (Tishchenko et al., 2005). For each cell and time step, hydrate formation from avail- able methane is calculated by computing the dissolution of methane in water and the dissociation pres- sure of methane hydrate depending on pressure and temperature based on the equations proposed by Tishchenko et al. (2005).
4. Results
4.1. 4.1. Thermal Calibration and Hydrate Stability
To best predict the present‐day BSR we have iteratively varied heatflow at the base of the model. We found that a heatflow value of 42 mW/m2across the basin resulted in the best agreement between the predicted BGHS and the mapped BSR (Figures 4 and 5a–5c). A higher heatflow of 52 mW/m2, similar to that in Burgreen‐Chan and Graham (2018) was assumed in the Cretaceous and set to linearly decrease to the present‐day value. The difference between the predicted BGHS and the mapped BSR surface is less than 100 m across most of the study area. The difference is to a large extent due to the resolution of the model, which is limited by a vertical cell thickness of 50–80 m. The bestfit basal present‐day heat‐flow in the 3‐D model is within the range of heatflow values of 30 to 52 mW/m2used in previous studies (Burgreen‐ Chan & Graham, 2018; Darby et al., 2000; Kroeger et al., 2015). The resulting predicted thickness of the hydrate stability zone (HSZ) is between 600 and 800 m (Figure 5d) and decreases north, west and southward with decreasing water depth. The influence of landward decreasing water depth on the thickness of the HSZ in the north of the study area is counteracted to some extent by decreasing heatflow toward the trench and accretionary wedge (Figure 6). However, it appears that the model locally overpredicts some of the topo- graphic and structural effects in this area, resulting in higher calibration errors in parts of the accretionary wedge section (Figure 5a). Models run with different heatflow values illustrate the sensitivity of the HSZ to a lower or higher heatflow (Figures 5d–5f). A modeled heatflow of 35 mW/m2results in an approximally 100 m thicker HSZ in the deeper parts of Pegasus Basin, while at 50 mW/m2, the predicted HSZ is up to 100 m thinner. However, the difference between the predicted BHSZ and the mapped BSR similarly increases in both scenarios, clearly resulting in a poorer calibration result (Figures 5b and 5c). Another pro- nounced difference between the mapped BSR and the predicted BGHS in the best‐fit scenario was found in the eastern part of the model, north of the present‐day Hikurangi Channel, where the mapped BSR is up to 250 m shallower than the predicted BGHS (Figure 5a). This is an area of potentially highfluidflow, leading to a shallower BGHS and slight doming of the BSR (e.g., Kroeger et al., 2015; Pecher et al., 2010; Plaza‐
Faverola et al., 2012). Although the heatflow at the base of the model has been increased to 56 mW/m2 Table 2
Overview of Modeled Scenarios
Heatflow at base (mW/m2) TOC Cretaceous (%) TOC Waipawa eq. (%) TOC Neogene strata (%) Paleogene Carrier Bed
Scenario A 42 1 5 1 Absent
Scenario B 42 1 5 1 Present
Scenario C 42 3 10 0.5 Present
in this area to replicate the effects offluidflow, the more localized effects of advective heat transport could not be reproduced (Figure 5a).
4.2. Predicted Gas Generation
Three scenarios are presented here (Table 2), two of which (scenarios A and B) assumed 1% TOC in the Neogene basinfill and predict a microbial gas generation of up to 4 Mtons/km2(average 1 Mtons/km2) from Pleistocene sediments (Figure 7a). Scenario C assumed only 0.5% TOC in Neogene sediment and hence pre- dicts only half the gas generation. Microbial gas generation is predicted to peak at around 1,300 m below the seafloor. The predicted depth of maximum microbial gas generation is ~300 m shallower than that predicted by a previous 2‐D model across the area (Kroeger et al., 2015), which assumed a lower heat flow of 33 mW/m2beneath Pegasus Basin (Figure 1) compared to a heatflow of 42 mW/m2used in the bestfit sce- nario of the present 3‐D model. In addition, the 3‐D model predicted slightly lower average sedimentation rates of 0.80 mm/year in the basin (compared to ~0.85 mm/year in the 2‐D model). The variability in the Figure 5.Illustration of calibration of (a–c) the thermal model to the mapped BSR and (d–f) the resulting thickness of the predicted HSZ. Panels a–c show the difference between the modeled BHSZ and the mapped bottom simulating reflection (BSR); (a) in the base case thermal scenario used in model scenarios A, B, and C (Table 2) using a basal heatflow of 42 mW/m2; (b) for a scenario using a basal heatflow of 35 mW/m2, and (c) a basal heatflow of 50 mW/m2. Panels d–f show the predicted HSZ thickness at a basal heatflow of 42, 35, and 50 mW/m2, respectively. See Figure 1 for location and model outline. The stepped patterns reflect the resolution (layer thickness) in the model, as the BHSZ in the model is defined by the interval, where hydrates are stable in the entire cell. Coordinates are km in the New Zealand Transverse Mercator map grid.
predicted rate of microbial gas generation illustrates the sensitivity of the models to changes in the modeled thermalfield. Models run with a higher (50 mW/m2) or lower (35 wM/m2) heatflow compared to the bestfit scenario used for scenarios A–C (42 mW/m2) result in an over- all 25% higher or lower (respectively) microbial gas generation and a 150 m shallower or deeper (respectively) maximum in microbial gas generation rate. Models incorporating an approach depending on the age of the organic matter (Middelburg, 1989) predict maximum methane generation in the upper 200 m beneath the sea‐floor, decreasing toward the BGHS.
Predicted thermogenic gas generation from petroleum source rocks is 3 times as high as microbial gas generation in the southwestern part of the model, where these strata are thickest and most deeply buried, in scenarios A and B, assuming 1–5% TOC for Cretaceous–Paleogene rocks (Figure 7b and Table 2). Thermal generation of gas further beneath the subduction interface, as predicted in the model of Kroeger et al. (2015), was not considered here.
This would increase the gas generation potential landward of the modeled area in the northeast. The total predicted microbial gas generation from Pleistocene rocks in scenarios A and B is higher (9993 Mtons) than the thermogenic generation from source rocks (7651 Mtons). In scenario C, assuming 3% TOC in the Cretaceous interval and 10% TOC in the Waipawa Formation, however, the total predicted thermogenic gas generation is close to three times as high as in scenarios A and B.
4.3. Predicted Methane Hydrate Distribution
Models assuming 1–5% TOC in Cretaceous–Paleogene rocks and 1% TOC in the Neogene basinfill pre- dict widespread methane hydrate occurrence across the southern Hikurangi Margin (Figures 8a and 8b;
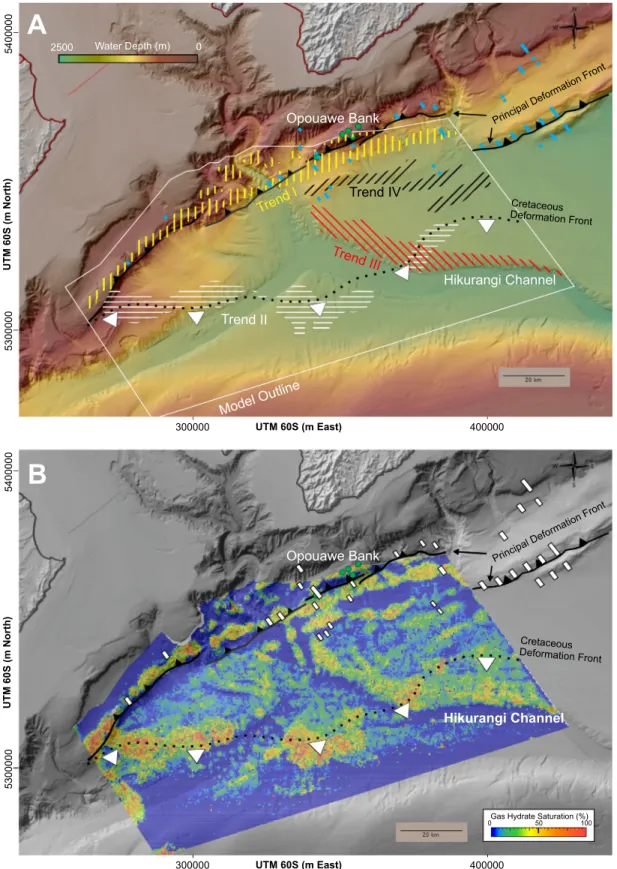
scenarios A and B). Predicted areas of concentrated hydrate occurrence follow variably east‐west oriented trends mapped in Figure 9a.
Predicted saturations along these trends are between 30 and 80%
hydrate in the pore space (Figure 9b). The most pronounced trend (I) occurs in close proximity to prominent ridges of the principal defor- mation front of the margin, and is predicted in all scenarios. A second trend (II, Figure 9a) is predicted by models assuming the presence of an early Paleocene carrier bed (Figures 8b and 8c; scenarios B and C;
Table 2). These models predict high hydrate concentrations above the Cretaceous deformation front related to stalled subduction beneath the Gondwana continent and associated later structures, north of the Chatham Rise (Figure 7). This trend is accentuated in the model that uses higher organic material contents in the Cretaceous–Paleogene interval (3–10% TOC) and lower TOC (0.5 %) in the Neogene basinfill (Figure 8c; scenario C). This suggests that the contribution of thermo- genic gas to hydrate formation is relatively high along this trend, if gas migration is sufficiently focused in the Cretaceous‐Paleogene interval.
Secondary predicted trends of greater hydrate accumulation are along the northern margin of the Hikurangi Channel (trend III) and along proto‐thrusts and gentle folding of the troughfill seaward of the prin- cipal deformation front (trend IV), in the eastern part of the model area (Figure 9).
4.4. Comparison to Observed Features
The pronounced trend of predicted high gas hydrate concentration (trend I) along the principle deformation front of the Hikurangi Subduction Margin (Barnes et al., 2010; Figure 9) is consistent with strong BSRs and gas related anomalies observed beneath deforming ridges along the mar- gin (Crutchley et al., 2011, 2015, 2018; Henrys et al., 2009; Pecher et al., Figure 7.Maps showing predicted generation of (a) microbial and (b) ther-
mogenic gas, assuming 1% total organic carbon (TOC) in Neogene rocks and 1–5% TOC in Cretaceous‐Paleogene rocks (see Table 1 for parameters used, note that scenarios A and B use the same source rock properties).
Figure 6.Predicted surface heatflow across the model area in the bestfit sce- nario using 42‐mW/m2basal heatflow. See Figure 1 for location and model outline.
2010; Figures 9 and 10a) and increased velocities within the HSZ (Crutchley et al., 2015, 2016, 2017).
Opouawe Bank, at the northeastern edge of our model (Figure 9), is one of the most prominent and best studied ridges near the deformation front on this part of the margin. It is associated with focusedfluidflow Figure 8.Predicted gas hydrate masses by scenarios A–C (see Table 1 for parameters). Coordinates are km in the New Zealand Transverse Mercator map grid.
Figure 9.Trends in hydrate distribution; (a) bathymetric map of the southern Hikurangi Margin showing predicted trends of high gas hydrate concentrations (I: yellow vertical bars, II: white horizontal bars, III: red diagonal bars, IV: black diagonal bars), direct evidence for occurrence of concentrated hydrate from seismic data from Crutchley et al. (2018; blue marks), seep sites at Opouawe Bank (green circles), the principal deformation front at present‐day (black lines, after Barnes et al., 2010 and Micallef et al., 2014) and related to Mesozoic subduction (dotted line). (B) Hydrate saturations predicted in scenario B for the lowermost layer within the HSZ, overlain on the same bathymetric map (grayscale). Here, direct evidence for occurrence of concentrated hydrate from seismic data from Crutchley et al. (2018) is shown as white bars.
(e.g., Koch et al., 2016; Riedel et al., 2018), numerous active gas seeps (Greinert et al., 2010), and concen- trated gas hydrate accumulations (Schwalenberg et al., 2017). However, in the eastern part of the modeled area, only open anticlines sea‐ward of the principal deformation front are fully represented in the model since the structures farther landward were too complex to map with the available data. These anticlines have a less prominent sea‐floor expression, but seismic amplitude and velocity data suggest these also host con- centrated hydrate deposits (Crutchley et al., 2017, 2018), consistent with model predictions (Figures 8–10).
Areas with predicted high hydrate occurrence above structures associated with the Cretaceous deformation front (trend II; Figure 9) are consistent with strong reflections beneath the BSR indicating the presence of gas, includingflat spots (Fraser et al., 2016; Figure 10b). Predicted hydrate distribution is also generally con- sistent with mapped BSR reflection strength (Figure 11). Of the three scenarios shown in Figure 8, scenarios A and B assuming 1% TOC in Neogene strata are more consistent with a persistent BSR throughout the area indicating widely distributed hydrate at the BGHS, compared to scenario C that assumes 0.5% TOC in Neogene strata (Table 2). Scenarios B and C (Figures 8b and 8c) assuming greater permeability in strata in the subducting plate are more consistent with increased BSR reflectivity approximately coinciding with the Cretaceous deformation front (trend II, Figures 1, 9, and 11). Predicted gas hydrates along the northern margin of the Hikurangi Channel (trend III) coincide with particularly strong reflectivity at the BSR and strong gas anomalies (Figures 10c and 11). Apart from the area where trend II and III overlap, scenario A and B predictions of this trend are very similar, whereas scenario C predicts notably less hydrate along this trend. Predicted hydrate concentration along this trend thus depends on the organic carbon available for microbial gas generation rather than the effective advection of thermally generated gas.
For comparison with the above results, additional models were run using an age dependent model for micro- bial gas generation. These predict patchier hydrate distributions than scenarios A–C, do not predict trend III, and are therefore inconsistent with the mapped BSR strength. However, models using a combination of the age‐dependent and the temperature‐dependent model for microbial gas generation by adding early gas gen- eration to the thermogenic kinetics predict increased gas hydrate concentrations near the BGHS across the basin relative to the model using only temperature‐dependent microbial gas generation. These results sug- gest that some of the shallow methane generated remains in the pore water and is incorporated during burial into gas hydrates and eventually recycled at the BGHS.
5. Quantification
5.1. Significance of Quantitative Predictions
While the presence of a BSR is a strong indicator of gas hydrate presence, its reflectivity is at best a weak indicator for the amount of hydrate present (Chen et al., 2007). The presence of concentrated hydrate can also manifest as anomalously strong reflections within the HSZ (Boswell et al., 2012; Boswell et al., 2016).
These can be used as direct indicators of concentrated hydrate accumulations if they are associated with a polarity inversion across the BGHS from negative (free gas) to positive (hydrate in the pore space; Boswell et al., 2012; Shedd et al., 2012). Such reflectivity characteristics are clear in situations where afine‐grained unit (i.e., mud) with no or little hydrate overlies a coarse‐grained unit (i.e., sand) bearing hydrate satura- tions close to‐or higher than 50% (Boswell et al., 2016). Direct indicators of concentrated gas hydrates as mapped in Crutchley et al. (2018) occur in or near areas of high predicted hydrate saturations associated with trend I (Figures 9 and 10d). Expected hydrate saturations > 50% based on the seismic data (Crutchley et al., 2018) are consistent with predicted hydrate saturations near the base of the HSZ (Figure 9b). Even though the Opouawe Bank structure was only partially included in the model, predicted hydrate satura- tions in this area of 50 to 80% are also consistent with hydrate saturations of up to 80% based on electro- magnetic data (Schwalenberg et al., 2017). Predicted high concentrations of gas hydrate along trend I align with the main topographic sea‐floor expression of the principal deformation front in the western part of the study area. These results are robust because changes in the modeled thermal regime have relatively little impact on predicted hydrate saturation along trends I‐IV, although the predicted extent of concen- trated hydrate formation along trend II increases with modeled heatflow and resulting higher thermo- genic gas generation (supporting information Figure S3). Predicted concentrated gas hydrate along trend II is characterized by pronounced gas anomalies and flat spots, suggesting accumulated gas, but no clear seismic indicators of concentrated gas hydrate in the stability zone of pure methane hydrate.
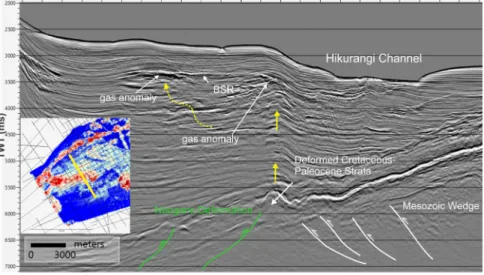
Figure 10.Comparison between seismic data (left) and model predictions of hydrate mass at the same location (right). The location of seismic data and 3‐D model extractions is shown on inset maps of predicted hydrate accumulation (scenario B; Figure 6b). (a) An example of predicted concentrated hydrate at the principal deformation front in an area with strong gas anomalies (trend I). (b) Evidence for aflat spot (see also enlarged inset to the right) and model predictions of con- centrated hydrate in this area (trend II). (c) Predicted hydrate and strong gas anomalies beneath the northern margin of the Hikurangi Channel (trend III).
(d) Seismic line with amplitude anomalies within the HSZ indicating concentrated gas hydrate consistent with predicted concentrated hydrate near the principal deformation front.
The scarcity of clear indications of concentrated hydrate in Pegasus Basin, seaward of the main deformation front (trends II and III) could be related to the lithological make‐up and orientation of strata. The response of seismic waves to hydrate filled strata in addition to hydrate concentration depends on the thickness of sandy strata and the wavelength of the seismic waves (Dai et al., 2008;
Shelander et al., 2010). It is possible that the sandy strata are thinner along trends II and III and hence a clear seismic response does not occur. Furthermore, flat lying strata are less likely to provide pathways for gas migration into the HSZ resulting in pronounced impedance contrasts related to concentrated hydrate within layers (see Boswell et al., 2016, their Figure 6; Crutchley et al., 2018). Due to the regional character and resolution of the model, as well as the simplification of modeled lithologies, these relationships could not be tested in more detail and models show no clear preference for hydrate formation in the difference upscaled lithologies.
5.2. Quantitative Prediction of Basin‐Wide Hydrate Occurrence
A major aim of this study was to improve quantitative estimates of gas hydrate occurrence along the south- ern Hikurangi Margin. Scenarios A and B were most consistent with observations from seismic data.
Therefore, we have used these for predicting gas hydrate occurrence. The predicted total mass of gas hydrate in the 15605 km2model area ranges between 52800 Mt (scenario A) and 69800 Mt (scenario B). This equates to 3.4–4.5 Mt hydrate/km2, containing 6.33 × 10⁸–8.38 × 10⁸m3/km2of methane at standard atmospheric pressure. These predictions are lower than estimates in a probabilistic resource assessment for the Gulf of Mexico of 1.33 × 10⁹m3/km2(Frye, 2008) and those predicted by a 3‐D PetroMod™model of the Green Canyon area in the Gulf of Mexico by Burwicz et al. (2017) of 1.56 × 10⁹m3/km2.
6. Discussion
6.1. Hydrate Distribution Prediction
The 3‐D modeling carried out at the southern Hikurangi Margin shows that a relatively simple integrated gas hydrate systems model can reproduce gas hydrate distributions consistent with a widespread BSR in reflec- tion seismic data. It also predicts concentrated hydrate accumulations consistent with direct indicators for gas hydrates (Figures 9 and 10d). Basic assumptions regarding TOC in Neogene sediments (1% TOC in sce- narios A and B), methane solubility and rates of methanogenesis, in combination with modeling gas migra- tion in a structurally relatively simple 3‐D model, allows us to broadly reproduce a hydrate distribution Figure 11.Map of amplitude at the bottom simulating reflection (BSR) derived from 2‐D reflection seismic data across the study area. The maximum negative amplitude was extracted across a window of ±8 ms of the interpreted BSR pick. The black line shows the Modern principal deformation front (black lines) and Cretaceous deformation front (dotted line).
consistent with observed BSR strength. Whilst BSR strength is not a quantitative indicator for hydrate pre- sence, these results nevertheless suggest that regional structures and stratal geometries are afirst order con- trol on the distribution of gas in the basin and, therefore hydrate distribution. Our results further suggest that with sufficient focusing into suitable structures, for instance thrust‐faulted and folded ridges along the prin- cipal deformation front, widespread microbial generation of methane underneath the HSZ can lead to highly concentrated hydrate accumulations. These results are consistent with modeling results of other hydrate provinces, where organic matter contents and sedimentation rates generate a sufficiently high gasflux for widespread hydrate formation such as at the Nankai Trough and the Gulf of Mexico (Burwicz et al., 2017;
Fujii et al., 2016).
6.2. The Role of Deep Gas in Pegasus Basin
In many aspects the New Zealand Hikurangi Margin is geologically unique. The subduction system is geo- logically young as convergence in the North Island of New Zealand has only been recorded from the Late Eocene onward (Nicol et al., 2007; Reilly et al., 2015; Stagpoole & Nicol, 2008). Subduction at the Hikurangi Margin is inferred to have started 30–24 Myr ago (Ballance, 1976; Barnes et al., 2010; Kamp, 1999; Lewis & Pettinga, 1993; Nicol et al., 2007; Stern et al., 2006). The southern Hikurangi Trough overlies the interface of a Mesozoic subduction system and the oceanic plateau that led to its stalling (Bradshaw, 1989; Davy et al., 2008; Wood & Davy, 1994). Lastly, to the southwest of the Pegasus Basin, convergent plate motion is transferred into the overriding plate, resulting in a continental strike‐slip system, the Alpine Fault system in the South Island of New Zealand (Ballance, 1976; Barnes et al., 1998; Giba et al., 2010; King, 2000;
Wallace et al., 2012). This lead to additional deformation in southern Pegasus Basin and structures that can trap gas or focus the migration of gas. Deformed sediments of the pre‐30 Ma passive margin sequence and Mesozoic convergent margin sequence, due to their proximity to the Gondwana continent, likely contain source rocks rich in terrestrial organic material (Uruski, 2010). This adds a source of thermogenic gas that is not present in most convergent margins. Modeling supports the notion that gas focused through structures related to the evolution of both the Mesozoic and Cenozoic plate margins increases the potential for concen- trated gas hydrate formation along the structural trends in the basin.
6.3. Controlling Factors on Hydrate Distribution
Gas hydrate system models in this study have been used to assess the impact of a range of factors on hydrate formation. Three main controlling factors are identified: (1) the structure and architecture of the Neogene basinfill, (2) the architecture and permeability of pre‐Neogene strata, and (3) the distribution of organic mat- ter and gas generation. The lithological composition of sediments within the HSZ is a fourth important factor that is likely underestimated in our models due to the relatively coarse resolution; an effective shift in rela- tive solubility strongly favors hydrate formation in coarser grained sediments (Clennell et al., 1999; Liu &
Flemings, 2011; Malinverno, 2010; You & Flemings, 2018). Since our models do not take into account the impact of processes on hydrate formation potential at the pore and sedimentary layer scale, the main impact of lithological parameters on predicted gas hydrate formation is through the difference in overall permeabil- ity and its impact on two‐phase advective transport and diffusion potential.
6.3.1. Structure and Architecture of the Neogene Basin Fill
Migration of free gas or gas‐chargedfluids has been proposed to occur along high‐permeability layers (e.g., sandy lithologies) bounded by lower permeability sediments (e.g., shales; Boswell et al., 2012;
Crutchley et al., 2015; Fraser et al., 2016). Despite the relatively coarse resolution of the model, the impact of stratal geometries is evident, in particular in the northern part of the model area, where pre- dicted concentrated hydrate formation occurs near the apexes of anticlines along and seaward of the principal deformation front (trend I, Figure 7). These hydrate accumulations follow a trend that is pro- minent in all scenarios. Models suggest that stratal geometries related to anticlinal structures focus migrating gas, resulting in concentrated hydrate deposits (Figure 10a). Upward migration of gas char- ging hydrate systems is often associated with faults, fault intersections and associated structural highs that focus gas migration (Barnes et al., 2010; Freire et al., 2011; Hustoft et al., 2007; Paganoni et al., 2019; Plaza‐Faverola et al., 2014). Models in the present study were run without considering the influ- ence of faults. Hence, an enhanced advection of deeper thermogenic gas along thrust faults and anticli- nal extensional structures as proposed by Barnes et al. (2010), Foschi et al. (2019), and Plaza‐Faverola et al. (2012) could not be tested.
Increased potential for hydrate formation is also predicted in the proto‐thrust zone seaward of the prin- cipal deformation front (trend IV, Figure 9). This secondary trend likely represents an early stage of the process of forming concentrated hydrate accumulations during convergent margin deformation (Crutchley et al., 2018). Here, a larger component of thermogenic gas originating from subducting pet- roleum source rocks and migrating along the subduction interface or the frontal trusts may initially be incorporated (Kroeger et al., 2015; Plaza‐Faverola et al., 2012). The process of uplift and recycling is thought to then lead to further concentration of hydrate deposits, and a landward shift of the highest concentration of hydrates relative to the apex of the buried anticline is often observed (Crutchley et al., 2018), which is partially reproduced by the model (Figure 10a). This landward shift may be related to gas recycling at the BGHS driven by forearc basin formation behind (i.e., landward of‐) the crest of the uplifted ridge (Crutchley et al., 2018).
Stratal geometries also control the third trend (III; Figure 9) of predicted concentrated hydrate occurrence.
Microbially or thermally sourced gas migrates vertically or laterally through carrier beds deposited as part of the Hikurangi Channel sedimentary system and its predecessors. The present‐day sea‐floor topography related to the Modern channel‐levee system in this area defines the shape of the BSR which crosscuts deeper strata and traps gas migrating along carrier beds (Figure 10c).
6.3.2. Architecture and Permeability of Pre‐Neogene Strata
The second (II) predicted approximately east‐west oriented trend of concentrated hydrate deposits, which occurs sea‐ward of the trend along the principal deformation front, is particularly strong in sce- nario B and further enhanced in scenario C (Figures 8b and 8c and 9). These scenarios assumed greater permeability in strata in the subducting plate (scenario B) and, in addition, a proportionally greater con- tribution of deep, thermally generated gas (scenario C). The predicted trend that was enhanced by these assumptions follows the extent of the deformation backstop associated with the buried wedge resulting from Mesozoic subduction beneath Gondwana. An additional southwestward increase in deformation is due to an increasing transpressional component in the Late Neogene to Modern subduction.
Deformation resulted in folding of Cretaceous and to some extent also overlying younger strata (Figure 12). Models suggest that deep, likely thermogenic gas migrates along carrier beds in the sub- ducting plate and is focused upward into Neogene strata at the crests of folds and in areas of structural deformation. This focusing is also indicated by enhanced reflections likely related to gas in the sedi- ments in deformed areas and associated strong reflections beneath the BGHS (Figure 12). In the eastern part of the study area, focusing of migrating deep gas occurs mainly above structures related to the bur- ied Mesozoic wedge and related to the pinch‐out of pre‐Neogene strata (Kroeger et al., 2015; Plaza‐ Faverola et al., 2012). Migration of deep gas in these areas is consistent with low‐velocity anomalies and inversions in Neogene strata (Plaza‐Faverola et al., 2012).
6.3.3. Organic Matter Distribution and Gas Generation
A local methane source (i.e., short migration) has been proposed not only for hydrates in mudstones but also for concentrated hydrates in intercalated sandstone layers (Malinverno, 2010; You & Flemings, 2018). However, quantitative considerations and modeling results suggest that at least concentrated hydrate accumulations in sandstone intervals above several meters in thickness are formed through advection of methane (Kroeger et al., 2015; Milkov, 2005; Wallmann et al., 2006; You & Flemings, 2018). This is most likely achieved by focused migration of methane either from deep microbial or ther- mogenic sources. Near‐vertical focused migration of gas generated well below the HSZ has been imaged by high resolution 3‐D reflection seismic data (e.g., Plaza‐Faverola et al., 2014; Riedel et al., 2018) and illustrates the role that focused migration of gas plays in the formation of concentrated hydrate deposits.
Pore water chemistry at Opouawe Bank is consistent with deep (1,500–2,100 m below seafloor; Koch et al., 2016) microbial methane generation. This is corroborated by the 3‐D modeling results that suggest that anticlines can be charged with sufficient microbial gas to form concentrated hydrates with up to 80% pore space saturation. Such high concentrations can be reached through the recycling of advected methane at the BGHS (Nole et al., 2018). Additional models incorporating shallow microbial generation of gas using the Middelburg (1989) model suggest that recycling of shallow microbial methane may also contribute to hydrate accumulation near the BGHS. Yet, the 3‐D modeling results support earlier mod- els of Kroeger et al. (2015, 2017) in the notion that it is primarily the microbial generation of methane underneath the BGHS that results in widespread hydrate occurrence and the formation of laterally extensive BSRs. This process is expected to be common in basins with high sedimentation rates
(Boswell et al., 2012; Milkov, 2005; Wallmann et al., 2006, 2012). In the 3‐D model the importance of the incorporation of microbial methane generated beneath the HSZ is illustrated by a decrease in predicted hydrate accumulation in most parts of the basin when a lower TOC content is assumed in Neogene sediments (scenario C; Figure 8c). Such a low TOC scenario is inconsistent with the extent of a relatively high amplitude BSR (Figure 11) and therefore corroborates the role of microbial generation of methane as a source for widely distributed BSRs. Similarly, predicted concentration along trends III and IV mainly depends on the amount of microbial gas generated, whereas the modeled scenarios suggest a stronger thermogenic gas contribution to concentrated hydrate accumulations along trend II seaward of the deformation front.
7. Conclusions
Gas hydrate petroleum systems modeling of the southern Hikurangi Margin predicts a rich hydrate pro- vince in eastern New Zealand. Predicted methane contents range from 36 to 48 Bcf/km2 in the most likely scenarios (A and B). Scenario B, assuming more permeable carrier beds in the subducting plate and hence a greater contribution of thermogenic gas, predicts average volumes of methane stored in gas hydrates in Pegasus Basin that are very similar to estimated gas hydrate related gas in the Gulf of Mexico, where a probabilistic resource assessment estimated an average of 46.8 Bcf/km2 (Frye, 2008). Predicted widespread and often highly concentrated hydrate deposits are consistent with wide- spread BSRs, seismic velocity and amplitude anomalies, and electromagnetic anomalies (Crutchley et al., 2015, 2017, 2018; Schwalenberg et al., 2017). Although geologically fundamentally different, the Gulf of Mexico and southern Hikurangi Margin hydrate provinces have in common that they are charged largely from beneath the HSZ (Boswell et al., 2012; Burwicz et al., 2017). A large component of the hydrate has formed from microbially generated gas, but advected thermogenic gas likely plays a role in forming some of the more concentrated hydrate deposits.
We identify three major trends of concentrated hydrate deposits at the southern Hikurangi Margin:
I. along anticlines of the principal deformation front;
II. overlying deformed Cretaceous sediments and related fairways for focused gas migration; and III. in stratal packages related to the Late Neogene to Modern Hikurangi Channel.
The identified trends are controlled by the following:
1. structure and architecture of the Neogene basinfill;
Figure 12.Reflection seismic image (line APB 13‐6) showing interpreted gas migration focused at Cretaceous structures (yellow arrows) and high reflectivity along migration pathways indicating gas charged sediments and associated strong gas related amplitude anomalies beneath the BSR. The location of seismic data is shown on a map of predicted hydrate accumulation (scenario B; Figure 6b).