GEOMAR
Helmholtz‐Zentrum für Date: 26.10.2017 Ozeanforschung Kiel
Cruise Report
Compiled by: Dr. Cornelia Jaspers
R.V. ALKOR Cruise No.: AL 499
Dates of Cruise: 14.08. – 25.08.2017
Areas of Research: Physical, chemical, biological oceanography
Port Calls: Gdynia, Poland: 19.08. – 20.08.2017
Institute: GEOMAR, FB3 (Marine Ecology, Evolutionary Ecology of Marine Fishes)
Chief Scientist: Dr. Cornelia Jaspers
Number of Scientists: 11
Number of Observers: 1, Regional Sea Fisheries Inspectorate in Szczecin, Poland
Projects: BONUS BIO‐C3 and SFB 1182, Excellence Cluster Future Ocean and Marie Curie (CJ)
Cruise Report
This cruise report consists of 14 pages including the cover page:
A: Cover page 1
B: Table of content 2
C: Scientific content of cruise report: 1. Scientific crew 3
1.1 Observer 3
2. Research program 4
3. Narrative of cruise and detailed timeline with technical details 6
Table1. Overview of gear deployment 12
4. Scientific report and first results 12
4.1 Summary 12
4.2 Gelatinous macro‐zooplankton sampling 12
4.3 Ichthyoplankton sampling 14
4.4 Hydrography 15
5. Scientific equipment 16
6. Acknowledgements 17
7. Appendix E1: Station list 17
8. References 17
C: Scientific content of cruise report
1. Scientific crew
Name Function Institute Leg
Cornelia Jaspers Chief Scientist GEOMAR Entire cruise
Bastian Huwer Scientist
National Institute of Aquatic Resources, Technical
University of Denmark
Leg 1
Henrik Gross Technical Assistant GEOMAR Entire cruise
Kristin Hänselmann Scientist University of Hamburg Entire cruise
Sabrina Schneider M.Sc. Student GEOMAR Entire cruise
Rebecca Piontek M.Sc. Student GEOMAR Entire cruise
Tobias Büring M.Sc. Student GEOMAR Entire cruise
Mariana Hill‐Cruz M.Sc. Student GEOMAR Entire cruise
Moritz Baumann M.Sc. Student GEOMAR Entire cruise
Christine Gawinski M.Sc. Student GEOMAR Entire cruise
Anna Boila M.Sc. Student GEOMAR Entire cruise
Sirin Schulz Student Assistant GEOMAR, PR Department Leg 2
Total 12
1.1 Observer
Name Function Institution Leg
Katarzyna Spich Polish Inspector, Scientist
National Marine Fisheries Institute, Gdynia, Poland
Leg 1
Chief scientist:
Dr. Cornelia Jaspers, GEOMAR Helmholtz Centre for Ocean Research Düsternbrooker Weg 20, 24105 Kiel
Phone: 0431 600 4560 Fax: 0431 600 4553 E‐Mail: cjaspers@geomar.de
2. Research program
Physical, biological oceanography:
This multidisciplinary cruise extended a long‐term data series on (eco‐)system composition and functioning of the Baltic Sea, with a focus on the deeper basins. The series has been collected in similar form since 1986. A key characteristic of the cruise is the integration of oceanographic and biological information to enhance understanding of environmental and zooplankton (especially jellyfish) population fluctuations, and evolutionary processes in this system. The resulting datasets and samples are an essential component of the international EU project BONUS BIO‐C3 coordinated by GEOMAR and contribute with samples to the SFB1182 (Metaorganisms) as well as two additional projects which are coordinated by the chief scientist and are funded by Marie Curie Actions as well as the excellence cluster Future Ocean. The spatial focus is on the Bornholm Basin (the most important spawning ground for Baltic cod), but also included the Western Baltic Sea, Arkona and Gotland Basin, as well as the Gdansk Deep (Fig. 1), where long term data are available.
Fig. 1: Investigation area of the Baltic Sea with all 75 stations sampled during the cruise.
This August cruise is especially pristine as long term data on so far un‐synthesized jellyfish abundances are available at GEOMAR and will thus contribute to the long standing scientific discussion if jellyfish abundances are increasing or if such rising densities are based on perception due to a lack of available long term data (Condon et al., 2012).
In detail, specific investigations during the cruise included a detailed hydrological survey (oxygen, salinity, temperature) of the entire investigation area as well as plankton surveys, focusing on gelatinous macrozooplankton, ichthyoplankton as well as the general zooplankton community composition. Data acquisition also included hydroacoustic methods and this will allow for estimating
abundance and distribution pattern of jellyfish via this non‐invasive method, although data analyses is not planned at the moment due to financial constraints. The cruise track of the investigated stations is outlined in Fig. 2 and the ICES Sub‐devisions those data are contributing to in Fig. 3.
Additional sample objectives during the cruise included (i) microbiota community composition along the salinity gradient of the Baltic Sea; (ii) vertically resolved zooplankton sampling to resolve spatial heterogeneity and comparison of towed video systems (cooperation with University of Hamburg) as well as conventional net methods. (iii) Vertically and spatially resolved genotypic composition of jellyfish species for population structure analyses along the salinity gradient of the Baltic Sea.
This cruise is a dedicated education cruise as part of the Biological Oceanography Master Program at GEOMAR, Helmholtz Centre for Ocean Research Kiel. It contributes with sea going experience and fulfillment of hands‐on learning objectives for future Biological Oceanographers.
Fig. 2: Cruise track covering all 75 stations sampled during the two week investigation.
Fig. 3:ICES subdivisions in the Baltic Sea area with hydrography data delivering to SD 22, 24, 25, 26, 27, 28. Source: ICES
3. Narrative of cruise with technical details Monday 14.8.2017
15:00 Departure Kiel
16:30 Station work on SW4, KB3, KB12, SW14 covering the hydrography and meso, macro and ichthyoplankton community (Fig. 4).
Applied methods consisted of a CTD for water column profiling covering salinity, temperature, oxygen, fluorescence and density as well as net sampling using a using a double Bongo net with 150, 330 and 500µm meshed nets.
Tuesday 15.8.2017
9:30 Station work on BY2 and H14 same as before. On station H14 a 330µm mesh sized multiple opening and closing net was additionally deployed to resolve the depth distribution of macrozooplankton (primarily jellyfish).
14:00 Beginning of standard monitoring station work in the Bornholm Basin covering the
standard 45 station grid, conducting CTD casts and Bongo hauls on all stations with life sorting for cod and clupeid larvae and gelatinous macrozooplankton.
Tuesday 15.8.2017 to Thursday 17.8.2017
0:00 ‐24:00 24h station work on the Bornholm –Grid (Fig. 5) using CTD and Bongo.
21:00 Thursday finishing station work on Bornholm Gird.
Fig. 4: Stations in the SW Baltic Sea
Thursday 17.8.2017 – Friday 18.8.2017
21:00 to 18:00 24h station investigating dial vertical migration pattern of plankton organisms using a 300µm towed multiple opening and closing net as well as a 45µm vertical multiple opening and closing net. Additionally we used an obliquely towed camera system to resolve fine scale vertical migration pattern and patchiness of zooplankton. Due to upcoming bad weather conditions the captain suggested that we should stop our 24h investigation after 18 hours and drop the stations SF in the Slups Furrow. I followed his advice and we steamed directly from the Bornholm Basin to the Gdynia Deep to continue station work there.
Saturday 19.8.2017
6:00 – 15:00 Station work in the Gdynia Deep area see Figs. 1,2 and 6.
Station work consisted of CTD and Bongo with an in depth investigation conducted at Station GD60a consisting of water chemistry, microbiota sampling, zooplankton, ichthyoplankton and gelatinous macrozooplankton sampling in up to 18 discrete depth strata. Equipment deployed consisted of Multinet Maxi, Bongo, small CTD, water rosette sampler.
15:30 Entry Gdynia harbor to exchange to disembarqe the Polish observer and our Danish o‐worker Bastian Huwer. We were awaiting the arrival of Sirin Schulz from the GEOMAR PR Department, arrival time airport Gdynia Sunday 15:05.
Fig. 5: Station‐Grid Bornholm Basin with standard 45 Stations, SF stations not covered.
Sunday 20.8.2017
10:00 Official back stage visit of the Marine Research Institute (MRI) Poland with tour through the laboratory facilities, culture rooms and public aquarium by Dr. Piotr Margonski (Vice President ICES, MRI employed).
16:10 Arrival Sirin Schulz
16:30 Departure Gdynia and steaming to station GB96 for in depth horizontal zooplankton work in the Gotland Basin – old monitoring station for which background data from August 1998 are available.
Sunday 20.8.2017
Afternoon After an interesting stopover in Gdynia with visits to the Aquarium and its backstage facilities and an interesting lunch break with Dr. Piotr Margonski, elected Vice President of the International Council for the Exploration of the Seas (ICES) and Senior Scientist at the National Marine Fisheries Research Institute, Poland (NMFRI) as well as arrival of Sirin Schulz from the GEOMAR PR Department Alkor departed from Gdynia. We are especially happy that Sirin actively disseminated our research results to the broad public during the cruise . . (http://www.oceanblogs.org/oceannavigator/).
Fig. 6: Station list in Gdynia Deep and Southern Gotland Basin area (GD56, GD57, GD59a, GD58, GD59, GD63, GD60, GD60a).
Monday 21.8.2017
8:00 Station work on GB96 with CTD sampling rosett to collect water samples for bacterioplankton work, physical and chemical oceanography measurements as well as deploying a multiple opening and closing net (Multinet Maxi 335µm mesh size) for vertical depth resolution of macrozooplankton in 18 depth strata (Fig. 2).
13:30 Station work on BY15 with CTD sampling rosett to collect water samples for bacterioplankton work, physical and chemical oceanography measurements as well as deploying a multiple opening and closing net (Multinet Maxi 335µm mesh size) for vertical depth resolution of macrozooplankton in 9 depth strata.
18:40 Station work on BY20a with CTD sampling rosett to collect water samples for physical and chemical oceanography measurements as well as deploying a small, high resolution CTD with ultra‐fast oxygen sensor to allow for direct comparison between different oxygen measuring devices and techniques. Additionally, a multiple opening and closing net (Multinet Maxi 335µm mesh size) for vertical depth resolution of macrozooplankton in 9 depth strata was deployed.
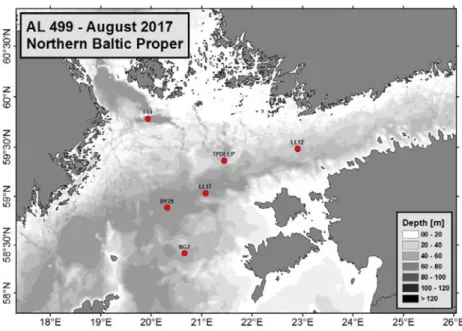
The plan was to steam to station F69 to continue station work in the North. However, due to increasing wind speeds from NNE, and following the advice of the captain, we decided to drop the northern stations (F69, TPDEEP, LL12, BY29 ‐ see Fig. 7 for planned stations which were cancelled) and to continue station work along Gotland.
Continuation of station work off Gotland, steaming towards BY32. .
Fig. 7 Planned monitoring stations in the northern Gotland Basin and off Finland (F69, TPDEEP, LL12, BY29) which had to be cancelled.
Tuesday 22.8.2017
2:15 Station work on BY32 with CTD sampling rosett to collect water samples for bacterioplankton work, physical and chemical oceanography measurements down to 200m as well as deployment of a high resolution CTD with ultra‐fast oxygen sensor
down to 100m. Additionally, we used a multiple opening and closing net (Multinet Maxi 335µm mesh size) for vertical depth resolution of macrozooplankton in 9 depth strata.
7:45 Station work on T4 with CTD deployment for physical and chemical oceanography measurements, a multiple opening and closing net (Multinet Midi 335µm mesh size) for vertical depth resolution of macrozooplankton in 5 depth strata and a Bongo net for depth integrated mesozooplankton abundances.
11:30 Station work on T5 with CTD deployment for physical and chemical oceanography measurements, a multiple opening and closing net (Multinet Maxi 335µm mesh size) for vertical depth resolution of macrozooplankton in 7 depth strata and a Bongo net for depth integrated mesozooplankton abundances.
14:40 Station work on T6 with CTD deployment for physical and chemical oceanography measurements, a multiple opening and closing net (Multinet Midi 335µm mesh size) for vertical depth resolution of macrozooplankton in 5 depth strata and a Bongo net for depth integrated mesozooplankton abundances.
18:00 Station work on T7 with CTD deployment for physical and chemical oceanography measurements, a multiple opening and closing net (Multinet Midi 335µm mesh size) for vertical depth resolution of macrozooplankton in 5 depth strata and a Bongo net for depth integrated mesozooplankton abundances.
21:00 Station work on T8 with CTD deployment for physical and chemical oceanography measurements, a multiple opening and closing net (Multinet Midi 335µm mesh size) for vertical depth resolution of macrozooplankton in 5 depth strata and a Bongo net for depth integrated mesozooplankton abundances.
The plan to steam eastwards after station T6 to continue station work in the southern Gotland Basin on stations GB90a, GB90, BY10 and on a second southern transect from GB79 to GB82 was dropped due to heavy winds from north east and expected large swell which was expected to make station work difficult, especially when considering that this is a student cruise. The suggestion of the captain was followed to continue station work in southern areas and we decided to continue in the Bornholm Basin on the 24h station BB30 where the 3rd 24 sampling was missing due to bad weather during the end of leg 1.
Wednesday 23.8.2017
4:00 Station work on BB30 with CTD for physical and chemical oceanography measurements and a vertically deployed multiple opening and closing net (Multinet Midi 150µm mesh size) for vertical depth resolution of mesozooplankton in 9 depth strata. The aim of this investigation has been to examine where the arctic relict comb jelly Mertensia ovum is located in relation to physical water column properties. So far it is only known that M. ovum is located below the thermocline during summer
months (Jaspers et al., 2013). After the mulltinet, different depth strata of maximum abundance were sampled with a VPR (Video Plankton Recorder) to see if fine scale accumulations can be detected.
6:00 VPR investigation ondulating throughout the water column
13:30 6 h VPR transects to investigate fine scale accumulation of mesozooplankton, especially Mertensia ovum in relation to physical properties of the water column.
Focus has been devoted to oxygen as primary limiting factor for depth distribution.
21:00 4th VPR 24 h sampling which had to be dropped during leg 1.
Thursday 24.8.2017
6:00 Station work on N1 with CTD deployment for physical and chemical oceanography measurements, a multiple opening and closing net (Multinet Midi 335µm mesh size) for vertical depth resolution of macrozooplankton in 5 depth strata and a Bongo net for depth integrated mesozooplankton abundances.
8:45 Station work on N2 with CTD deployment for physical and chemical oceanography measurements and a Bongo net for depth integrated meso‐ and macrozooplankton abundances.
10:30 Station work on BY2 with CTD deployment for physical and chemical oceanography measurements, a multiple opening and closing net (Multinet Maxi 335µm mesh size) for vertical depth resolution of macrozooplankton in 7 depth strata and a Bongo net for depth integrated mesozooplankton abundances.
12:00 Station work on H18 with CTD deployment for physical and chemical oceanography measurements and a Bongo net for depth integrated meso‐ and macrozooplankton abundances.
13:50 Station work on BY1 with CTD deployment for physical and chemical oceanography measurements, a multiple opening and closing net (Multinet Midi 335µm mesh size) for vertical depth resolution of macrozooplankton in 5 depth strata and a Bongo net for depth integrated mesozooplankton abundances. Additionally, surface water samples were taken for bacterioplankton community composition and abundances.
Friday 25.8.2017
8:00 Arrival in Kiel East shore for unloading and loading of new equipment for AL500. 22 hours arrival before planned arrival since station work in the all regions has been conducted (see Fig. 2 for entire station map which have been covered during AL499) and time was saved as the weather situation permitted to visit northern most stations off Finland and eastern stations in the Gotland Basin during leg 2.
Table 1 Overview of gear deployment. Mesh sizes are given in brackets.
4. Scientific report and first results
4.1 Summary: The scientific results regarding the gelatinous macrozooplankton community composition in relation to the vertical and horizontal salinity gradient of the Baltic Sea are currently worked up by all students and a manuscript with all MSc students who participated in this cruise is in preparation and underway. This is an essential learning exercise as the communication of scientific results is a key learning objective and should be highlighted as most essential scientific communication skill.
With this cruise I envisioned to give the students a complete picture about scientific day to day activities which include the planning, preparation, conduction, analyses as well as result presentation and writing up of scientific results.
In total we have quantified 2500 gelatinous macrozooplankton organisms, identified and measured 376 cod larvae plus several clupeids fish species and covered more than 75 Stations which were resolved in up to 18 depth strata. Those samples are essential for continuation of ongoing monitoring activities and will contribute to several EU and DFG projects such as BIOC3, SFB1182, Future Ocean, Marie Curie (CJ).
4.2 Gelatinous macro‐zooplankton sampling
In total 2500 gelatinous macrozooplankton organism were identified and sized belonging to
Gear Deployments (n)
ADM‐CTD vertical: 74
Hydroacoustic transect (continuous): 1
Watersampler + CTD: 7
Bongo, Babybongo (150μm, 335μm, 500μm): 69 Multinet MAXI (9 nets) & MIDI (4 nets)
horizontal towed(335μm): 24
Multinet MIDI vertical (50μm): 14
Fig. 8:The primary jellyfish species caught during the cruise ‐ Aurelia aurita.
Picture credit: S. Schulz.
two different phyla and four species. Namely, we caught two different ctenophore species, the invasive American sea walnut Mnemiopsis leidyi and the arctic relict species Mertensia ovum.
Ctenophores were present in low densities as the seasonal succession shows that invasive comb jelly abundances in the Baltic Sea peak during autumn (Haraldsson et al., 2013; Jaspers et al., 2013), while the arctic relict species is present year round in the Baltic Sea (Jaspers et al., 2013). We confirm previous observations by Jaspers et al. (2013) that Mertensia ovum eggs and larvae are only present in deeper water layers during August in the Bornholm Basin (Fig. 9) with larvae being distributed directly at the halocline, while eggs have a slightly lower average depth of occurrence (Fig. 9).
Fig. 9: Depth distribution of Mertensia ovum in the central Bornholm Basin during August 2017
For further fine scale resolution of the depth distribution of M. ovum in the Baltic Sea we additionally deployed a towed video plankton recording system and transected throughout the water column to detect spatial accumulations. With these data we aim at detecting spatial aggregations of this carnivore which is suggested to be located at thin layer accumulations of prey in association with the halocline.
For the two scyphozoan species present in the Baltic Sea, namely Aurelia aurita and Cyanea capillata, long term data from previous monitoring activities conducted at GEOMAR are available and now allow for direct comparisons of abundance and depth distribution in the major basins of the Baltic Sea over the past 20 years (Fig. 10). A manuscript is being prepared with the students summarizing and analyzing the scyphozoan data from this cruise.
Other biological samples related to bacterioplankton, microbiota associations, zooplankton community composition and larval condition factors are underway.
Fig. 10: Depth distribution of the scyphozoan jellyfish species Cyanea capillata in the Ddansk Deep off
Poland during August 1998 and 2017
4.3 Ichthyoplankton sampling
In total 376 cod larvae (Fig. 11) were caught and sorted from the Bongo net samples alive under a stereo microscope. This is the 3rd highest abundance on the Bornholm Grid from covering the past 11 years and leads to an approximate average abundance of 1.7 ind m‐2. Estimation of cod larvae abundances is crucial since latest results indicate that the eastern Baltic Cod stock is impossible to assess due to large uncertainties in the age determination. Therefore, published relationships found
between age group zero recruits and larvae abundances as well as well as age group zero recruits and 1 year age group recruits (Köster et al. 2003) could be an alternative way for stock assessment of eastern Baltic cod for the future This highlight the importance of cod larvae abundances for future fisheries assessments of one of the commercially most important fish species in the Baltic Sea, which is only possible due to the unique data availability currently present at GEOMAR, Helmholtz Centre for Ocean Research Kiel and its international collaboration network e.g. with the National Institute of Aquatic Resources, DTU Aqua, Technical University in Denmark, the University of Hamburg and the National Marine Fisheries Research Institute (NMFRI) in Gdynia, Poland.
4.4 Hydrography
Physical water column profiles showed typical vertical structure of the Baltic Sea with a fresh water body lying on a more saline, denser bottom water layer, as displayed in Fig. 12. Re‐current high saline water inflow events are essential for the regeneration of oxygen conditions in the deep basins. Fig.
12 shows a typical central Baltic Sea (Bornholm Basin) profile where bottom water oxygen concentrations are heavily reduced.
Fig. 11: Development sequence of eastern Baltic Cod (Gadus morhua callaris) from newly fertilized eggs to 9 days post hatch.
Picture credit: C.
5. Scientific equipment
List of major scientific equipment used:
BONGO/BABYBONGO: 500, 300 and 150µm meshed nets with flowmeters.
Multiple opening and closing net (Multinet Hydrobios, Kiel, Germany) Multinetz MIDI with mesh sizes 55µm, 150µm, 335µm
Multiple opening and closing net (Multinet Hydrobios, Kiel, Germany) Multinetz MAXI with mesh sizes 335µm and 2mm
Multiple standard plankton nets such as Apstein, WP2, WP3 with differing mesh sizes
Fig. 12: CTD Profiles for a) shallow water SW Baltic Sea region (SW4) with highly oxygenated bottom waters in comparison to a deep station in the central Baltic Sea, here Bornholm Basin, where bottom water oxygen
concentration reaches zero. Both casts are from August 2017 – AL499 investigation.
(a)
(b)
AMD‐CTD, mit AMT‐Oxygenmeasuring device and light sensor
Hydro‐Bios‐Sonde CTD with water bottle collector and Multifluorescencesonde
Video Plankton Recorder (VPR)
Thermosalinograph: Data collection via Datadis‐System.
Microbiota sampling rack with ‐80C freezer
Chl a extraction unit and flurometer
5 Stereomicroscopes with up to 40x magnification and 2 camera systems
1 Inverted microscope for qualitative Phytoplankton analyses
6. Acknowledgements
Special thanks go to the captain Jan Peter Lass for his excellent leadership ensuring the success of this cruise as well as the entire crew of RV Alkor for their outstanding support during the cruise.
Thanks go to Henrik Gross for technical assistance, Dr. Miotr Margonski for his support with the polish authorities and sending one of his scientific staff along as observer on this cruise.
The cruise received funding from BONUS (BIO‐C3 project), the joint Baltic Sea research and development programme (Art 185), funded jointly from the European Union’s Seventh Programme for research, technological development and demonstration (Forschungszentrum Jülich Beteiligungsgesellschaft mbH (Germany) and BMBF (Grant No. 03F0682A).
7. Appendix E1: Station list
Supplied with the report in electronic form as Excel table, “Appendix E1 “ – AL499_station_list.xlsx
8. References:
Condon, R. H., Graham, W., Pitt, K. and Cathy, H. (2012) Questioning the Rise of Gelatinous Zooplankton in the World's Oceans. Bioscience, 62, 160‐169.
Haraldsson, M., Jaspers, C., Tiselius, P., Aksnes, D. L., Andersen, T. and Titelman, J. (2013)
Environmental constraints of the invasive Mnemiopsis leidyi in Scandinavian waters. Limnol.
Oceanogr., 58, 37‐48.
Jaspers, C., Haraldsson, M., Lombard, F., Bolte, S. and Kiørboe, T. (2013) Seasonal dynamics of early life stages of invasive and native ctenophores give clues to invasion and bloom potential in the Baltic Sea. J. Plankton Res., 35, 582‐594.