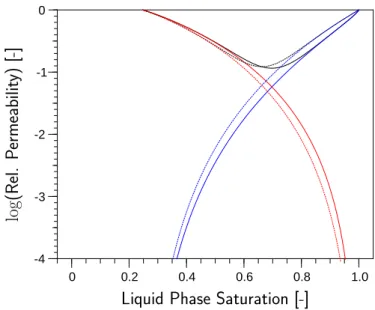
After the finalization of the thesis I discovered that a programming error in the routine calculating the gas phase permeability with van Genuchten parameters led to erroneous simulation results in section 5.4 of the thesis. The simulations therefore have been redone and the correct results are given below. I took the opportunity to make some additional changes. For the calculations in the thesis it was assumed, that the relative permeability of the gas phase reaches the value of one only if the medium is completely dry (zero water saturation, figure 5.9 in the thesis). As the residual water content should not contribute to the water conductivity it seemed more reasonable that the relative gas phase conductivity reaches one already at the residual water content (water saturationSr, figure 1.1). Therefore this was used for the new calculations.
The convergence problems previously observed in combination with the Brooks- Corey parameterization could be resolved by smoothing the sharp edge of the Brooks-Corey soil water characteristic in a very narrow range with a third order polynomial to make the function differentiable. Comparisons of simulations with and without this regularization showed no observable effect on the simulation re- sult, but a much better convergence behavior. The twophase simulations using the van Genuchten parameterization were also done with an independently developed code (Peter Bastian, personal communication), which delivered identical results.
The duration of the simulated multistep outflow experiments (except for the ho- mogeneous columns composed of coarse material) was prolonged to 23 hours and the lower boundary pressure at the end of the experiment was increased to reach full saturation in the coarse lens with Richards’ equation in the heterogeneous case.
1.1 Homogeneous Medium
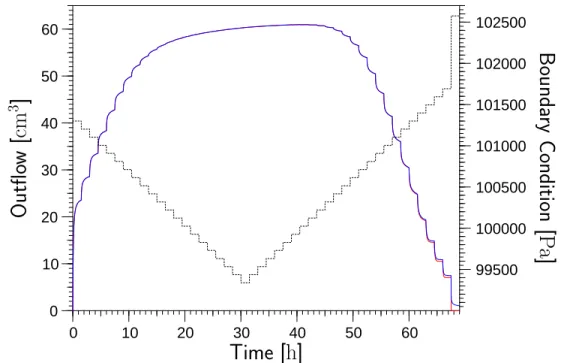
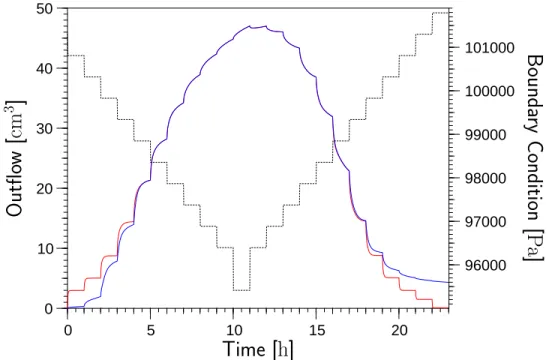
No observable changes occurred for the homogeneous column of fine material. In the coarse medium a small hysteresis occurred in the twophase simulations due to a retarded inflow of water on the resaturation branch of the experiment both with Brooks-Corey (figure 1.3) and van Genuchten parametrization (figure 1.2). For the medium material the results of Richards’ equation and the twophase model now showed marked differences with both the Brooks-Corey (figure 1.5) and van
-4 -3 -2 -1
0 0.2 0.4 0.6 0.8 1.0
! #"%$'&)(+*$-,.0/1$-,.2436587:9
Figure 1.1: Relative permeabilities obtained with the van Genuchten (solid lines) and Brooks-Corey parameterization (dashed lines) for gas phase (red), liquid phase (blue) and sum of both (black) (cp. to figure 5.9 in the thesis)
Genuchten parameterization (figure 1.2). Drainage calculated by the multiphase model was slower in the first pressure steps and hysteresis occurred during imbiba- tion. Compared with the results shown in the thesis, the deviations between the simulation using Richards’ equation and the twophase model are smaller when the Brooks-Corey parameterization was used due to the change in the relative perme- ability function.
1.2 Heterogeneous Medium
The new simulation results for the heterogeneous medium are shown in figures 1.6 and 1.7. It was now possible to simulate the complete experiment with the Brooks- Corey parameterization as well. Differences between Richards’ equation and the twophase simulation occurred now also with the van Genuchten parameterization, but there are some markable differences between the twophase simulations using the Brooks-Corey and the van Genuchten parameterization.
In the van Genuchten simulation a continuous gas phase has formed throughout the whole column after the first desaturation step (figure 1.8). As the gas phase is partially formed from dissolved air and the relative conductivity is still low, the gas pressure is below atmospheric pressure in the whole column. After two hours the coarse lens starts to drain while the medium material above the coarse lens remains nearly saturated (figure 1.10) and the gas phase pressure stays well below
0 10 20 30 40 50
0 10 20 30 40 50 60
99500 100000 100500 101000 101500
!
"$#
%&%
')(
*
+
Figure 1.2: Outflow of water calculated with Richards’ equation (red) and the twophase model (blue) obtained with the van Genuchten parameteri- zation for the homogeneous column made of coarse material and lower boundary condition (black dashed)
0 10 20 30 40 50 60
0 10 20 30 40 50 60
99500 100000 100500 101000 101500 102000 102500
!
"$#
%&%
')(
*
+
Figure 1.3: Outflow of water calculated with Richards’ equation (red) and the twophase model (blue) obtained with the Brooks-Corey parameteriza- tion for the homogeneous column made of coarse material and lower boundary condition (black dashed)
0 10 20 30 40
0 5 10 15 20
96000 97000 98000 99000 100000 101000
!
"$#
%&%
')(
*
+
Figure 1.4: Outflow of water calculated with Richards’ equation (red) and the twophase model (blue) obtained with the van Genuchten parameteri- zation for the homogeneous column made of medium material and lower boundary condition (black dashed) (cp. to figure 5.3 in the thesis)
0 10 20 30 40 50
0 5 10 15 20
96000 97000 98000 99000 100000 101000
!
"$#
%&%
')(
*
+
Figure 1.5: Outflow of water calculated with Richards’ equation (red) and the twophase model (blue) obtained with the Brooks-Corey parameteriza- tion for the homogeneous column made of medium material and lower boundary condition (black dashed) (cp. to figure 5.4 in the thesis)
0 10 20 30
0 5 10 15 20
96000 97000 98000 99000 100000
!
"$#
%&%
')(
*
+
Figure 1.6: Outflow of water calculated with Richards’ equation (red) and the twophase model (blue) obtained with the van Genuchten parameteriza- tion for the heterogeneous column and lower boundary condition (black dashed) (cp. to figure 5.5 in the thesis)
0 10 20 30 40 50
0 5 10 15 20
96000 97000 98000 99000 100000 101000
!
"$#
%&%
')(
*
+
Figure 1.7: Outflow of water calculated with Richards’ equation (red) and the twophase model (blue) obtained with the Brooks-Corey parameteriza- tion for the heterogeneous column and lower boundary condition (black dashed) (cp. to figure 5.6 in the thesis)
atmospheric pressure in the lower three-quarter of the sample. One hour later the drainage of the coarse lens is nearly completed and the gas phase pressure has reached atmospheric pressure in the upper two-third of the column (figure 1.12).
The liquid phase conductivity is very low in the coarse lens and final drainage is efficiently obstructed, resulting in a slightly increased liquid phase pressure in the coarse material. At the end of the experiment after 23 hours a gas phase is present in the whole column and the coarse lens remains nearly dry (figure 1.14). Gas phase pressure is especially high below the fine lens.
When the Brooks-Corey parameterization is used for the simulation, a gas phase is formed only in the coarse lens by a very small amount of dissolved air as the entry pressure of the medium material is not yet reached (figure 1.9). This results in a pressure drop in the coarse lens and it’s immediate vicinity. The situation remains unchanged until the medium material starts to drain after 5 hours (figure 1.11). After 6 hours the drainage front has reached the coarse lens (figure 1.13).
Below, water originating from the coarse lens can be seen. It has not yet been in contact with a continuous gas phase and the partial pressure of air is still lower.
The retarding effect of the dried coarse lens to water drainage from the medium material above is even more pronounced than in the van Genuchten simulation and water is ponding on the coarse material. Finally after 23 hours a continuous gas phase remains in the whole column with particular gas accumulations in the coarse lens and below the fine lens (figure 1.15). The gas phase pressure is better balanced than in the van Genuchten simulation but reaches higher maximum values.
1.3 Discussion
Richards’ equation and the twophase model deliver identical results if the gas phase is continuous. Characteristic differences occurred between the Richards’ equation and the twophase model with both Brooks-Corey and van Genuchten parameteriza- tions at high water saturations. The water flux out of the column was slower and hysteresis was visible during imbibation. These observations are in agreement with measurements. Differences in air pressure distribution and outflow characteristic be- tween the simulations with van Genuchten and Brooks-Corey parameterization can be explained with the existence of an air entry pressure in the Brooks-Corey param- eterization, resulting from the limited maximal pore diameter, and the accordingly different shape of the soil water characteristic.
The new phase pressure/partial pressure formulation makes solution of a twophase model in combination with the Brooks-Corey parameterization and the considera- tion of dissolved air possible. It therefore might give a better description of the measurements. The difficulties with the convergence of the Newton Method in com- bination with the Brooks-Corey parameterization could be resolved by a minute regularization of the soil water characteristic curve.
Gas Pressure Gas Saturation Gas Flux
1
Figure 1.8: Distribution of liquid phase pressure [100’000. . . 101’000], gas pres- sure [99’600. . . 101’000], water saturation [0. . . 1], gas saturation [0. . . 0.03] and fluxes in the heterogeneous column after one hour simu- lated with the van Genuchten parameterization. Values in brackets are the maximum and minimum value used in scaling
Water Pressure Water Saturation Water Flux
Gas Pressure Gas Saturation Gas Flux
1
Figure 1.9: Distribution of liquid phase pressure [99’600. . . 101’000], gas pres- sure [100’500. . . 101’000], water saturation [0. . . 1], gas saturation [0. . . 0.0005] and fluxes in the heterogeneous column after one hour sim- ulated with the Brooks-Corey parameterization. Values in brackets are the maximum and minimum value used in scaling
Water Pressure Water Saturation Water Flux
Gas Pressure Gas Saturation Gas Flux
2
Figure 1.10: Distribution of liquid phase pressure [99’100. . . 100’000], gas pres- sure [100’000. . . 101’000], water saturation [0. . . 1], gas saturation [0. . . 0.17] and fluxes in the heterogeneous column after 2 hours sim- ulated with the van Genuchten parametrization. Values in brackets are the maximum and minimum value used in scaling
Water Pressure Water Saturation Water Flux
Gas Pressure Gas Saturation Gas Flux
5
Figure 1.11: Distribution of liquid phase pressure [97’700. . . 98’800], gas pres- sure [98’700. . . 101’000], water saturation [0. . . 1], gas saturation [0. . . 0.04] and fluxes in the heterogeneous column after 5 hours sim- ulated with the Brooks-Corey parameterization. Values in brackets are the maximum and minimum value used in scaling (cp. to figure 5.7 in the thesis)
Gas Pressure Gas Saturation Gas Flux
3
Figure 1.12: Distribution of liquid phase pressure [98’. . . 99’800], gas pres- sure [99’800. . . 101’000], water saturation [0. . . 1], gas saturation [0. . . 0.72] and fluxes in the heterogeneous column after 3 hours sim- ulated with the van Genuchten parametrization. Values in brackets are the maximum and minimum value used in scaling
Water Pressure Water Saturation Water Flux
Gas Pressure Gas Saturation Gas Flux
6
Figure 1.13: Distribution of liquid phase pressure [97’100. . . 99’000], gas pres- sure [97’900. . . 101’000], water saturation [0. . . 1], gas saturation [0. . . 0.74] and fluxes in the heterogeneous column after 6 hours sim- ulated with the Brooks-Corey parameterization. Values in brackets are the maximum and minimum value used in scaling (cp. to figure 5.8 in the thesis)
Water Pressure Water Saturation Water Flux
Gas Pressure Gas Saturation Gas Flux
23
Figure 1.14: Distribution of liquid phase pressure [101’000. . . 102’000], gas pres- sure [101’000. . . 103’000], water saturation [0. . . 1], gas saturation [0. . . 0.69] and fluxes in the heterogeneous column after at the end of the simulated experiment simulated with the van Genuchten parame- terization. Values in brackets are the maximum and minimum value used in scaling
Water Pressure Water Saturation Water Flux
Gas Pressure Gas Saturation Gas Flux
23
Figure 1.15: Distribution of liquid phase pressure [101’000. . . 102’000], gas pres- sure [101’000. . . 105’000], water saturation [0. . . 1], gas saturation [0. . . 0.75] and fluxes in the heterogeneous column after at the end of the simulated experiment simulated with the Brooks-Corey parameter- ization. Values in brackets are the maximum and minimum value used 10

![Figure 1.8: Distribution of liquid phase pressure [100’000. . . 101’000], gas pres- pres-sure [99’600](https://thumb-eu.123doks.com/thumbv2/1library_info/5508984.1686163/7.918.212.728.160.502/figure-distribution-liquid-phase-pressure-pres-pres-sure.webp)
![Figure 1.10: Distribution of liquid phase pressure [99’100. . . 100’000], gas pres- pres-sure [100’000](https://thumb-eu.123doks.com/thumbv2/1library_info/5508984.1686163/8.918.169.686.156.502/figure-distribution-liquid-phase-pressure-pres-pres-sure.webp)
![Figure 1.12: Distribution of liquid phase pressure [98’. . . 99’800], gas pres- pres-sure [99’800](https://thumb-eu.123doks.com/thumbv2/1library_info/5508984.1686163/9.918.210.729.161.503/figure-distribution-liquid-phase-pressure-pres-pres-sure.webp)
![Figure 1.14: Distribution of liquid phase pressure [101’000. . . 102’000], gas pres- pres-sure [101’000](https://thumb-eu.123doks.com/thumbv2/1library_info/5508984.1686163/10.918.169.686.156.502/figure-distribution-liquid-phase-pressure-pres-pres-sure.webp)
