www.giga-hamburg.de/workingpapers
orking Papers serve to disseminate the research results of work in progress prior to publicaton to encourage the exchange of ideas and academic debate. n of a paper in the Working Papers series does not constitute publication and should not limit publication in any other venue. Copyright remains with the authors.
GIGA Research Programme:
Legitimacy and Efficiency of Political Systems
___________________________
It’s Not Only Rents:
Explaining the Persistence and Change of Neopatrimonialism in Indonesia
Nina Korte
No 167 May 2011
GIGA Working Papers
Edited by the
GIGA German Institute of Global and Area Studies Leibniz‐Institut für Globale und Regionale Studien
The GIGA Working Papers series serves to disseminate the research results of work in pro‐
gress prior to publication in order to encourage the exchange of ideas and academic debate.
An objective of the series is to get the findings out quickly, even if the presentations are less than fully polished. Inclusion of a paper in the GIGA Working Papers series does not consti‐
tute publication and should not limit publication in any other venue. Copyright remains with the authors. When working papers are eventually accepted by or published in a journal or book, the correct citation reference and, if possible, the corresponding link will then be in‐
cluded on the GIGA Working Papers website at <www.giga‐hamburg.de/workingpapers>.
GIGA research unit responsible for this issue:
GIGA Research Programme 1: “Legitimacy and Efficiency of Political Systems”
Editor of the GIGA Working Papers series: Bert Hoffmann
<workingpapers@giga‐hamburg.de>
Copyright for this issue: © Nina Korte English copy editor: Andrew Blechman
Editorial assistant and production: Silvia Bücke
All GIGA Working Papers are available online and free of charge on the website
<www.giga‐hamburg.de/workingpapers>.
For any requests please contact:
E‐mail: <workingpapers@giga‐hamburg.de>
Phone: +49 (0)40 ‐ 4 28 25 ‐ 548
The GIGA German Institute of Global and Area Studies cannot be held responsible for errors or any consequences arising from the use of information contained in this Working Paper;
the views and opinions expressed are solely those of the author or authors and do not neces‐
sarily reflect those of the Institute.
GIGA German Institute of Global and Area Studies Leibniz‐Institut für Globale und Regionale Studien Neuer Jungfernstieg 21
20354 Hamburg Germany
E‐mail: <info@giga‐hamburg.de>
Website: <www.giga‐hamburg.de>
It’s Not Only Rents:
Explaining the Persistence and Change of Neopatrimonialism in Indonesia
Abstract
Indonesia has long been associated with neopatrimonialism, corruption, collusion, and nepo‐
tism as the main modi operandi of politics, economics and public administration. Despite various measures and initiatives to fight these practises, little evidence for a significant de‐
cline can be found over the years. Rather, longitudinal analysis points to changes in the char‐
acter of neopatrimonialism. Based on more than 60 in‐depth interviews, focus‐group discus‐
sions, and the analysis of both primary and secondary data, the aim of this article is, first, to describe the changes that have taken place, and, second, to investigate what accounts for these changes. Political economy concepts posit the amount and development of economic rents as the explanatory factor for the persistence and change of neopatrimonialism. This study’s findings, however, indicate that rents alone cannot explain what has taken place in Indonesia. Democratisation and decentralisation exert a stronger impact.
Keywords: Economic Rents, Neopatrimonialism, Democratisation, Decentralisation, Indo‐
nesia
Nina Korte, M.A.
is a research fellow at the GIGA Institute of Asian Studies and Ph.D. candidate in political science at the University of Hamburg.
Contact: <korte@giga‐hamburg.de>
Website: <http://staff.en.giga‐hamburg.de/korte>
Explaining the Persistence and Change of Neopatrimonialism in Indonesia
Nina Korte
Article Outline 1 Introduction
2 Rents and Neopatrimonialism: Conceptualisation and Measurement 3 Indonesia: From Enclave Economy to Non‐Enclave Economy
4 The Changing Nature of Neopatrimonialism in Indonesia 5 Conclusion
1 Introduction
Observation and experience tell us that the Indonesian state simultaneously operates by two logics of rule, the legal‐rational and the patrimonial. Patrimonialism, patronage and various forms of patron‐client relationships have been prominent under Soeharto’s rule (Roth 1968;
Eisenstadt 1973; Crouch 1979; Hutchcroft 1998; Ufen 2002) and they are until today (Aspinall 2010). While “Berantas KKN”, the abolishment of corruption, collusion and nepotism, has been fiercely demanded by Indonesiaʹs reform movement in the late 1990s, so far there is lit‐
tle evidence for the decline of patrimonial practises (corruption, collusion and nepotism).
Rather than declining, it is the form and character of patrimonial practises that appear to have changed over time (cf. Mackie 2010: 83). Recent studies suggest presidential power has
decreased (Tomsa 2010), corruption has shifted (Kuncoro 2006: 14), and collusion and nepo‐
tism have diversified.
Applying the concept of neopatrimonialism, which has frequently been used to describe states where the exercise of authority is both patrimonial and legal‐rational (cf. Clapham 1982; Migdal 1988; Chabal/Daloz 1999; Hutchcroft/Rocamora 2003), this paper aims to sys‐
tematically analyse how neopatrimonialism has changed in Indonesia in the course of the past 40 years, and why these changes have taken place.1 In explaining differences in neopat‐
rimonial profiles, scholars have pointed to various aspects: economies of affection (Hyden 1983) resulting from low levels of socio‐economic development and differentiation; culture (i.e. deeply engrained societal norms) (Kraar 1995; Chabal/Daloz 2006); multi‐ethnicity (Le‐
marchand 1972); state‐weakness (Piattoni 2001), or democratisation processes (Brinkerhoff/
Goldsmith 2002; Lindberg 2003). This paper focuses on the explanatory power of the political economy concepts which suggest that high rent incomes from enclave economies are the key factor for explaining neopatrimonialism’s persistence and change (e.g. Ross 2001; Leonard/
Straus 2003) as Indonesia has transformed from an enclave to a non‐enclave economy during the period under observation.
To answer the question whether the availability of economic rents can explain the persis‐
tence and change of neopatrimonialism in Indonesia, this paper is based on an in‐depth em‐
pirical study which includes the analysis of information collected from a wide‐range of data‐
bases, secondary and primary documents, four focus group discussions, and more than sixty interviews conducted with seven different stakeholder groups (social scientists, civil society representatives, business representatives, international organisation representatives, gov‐
ernment officials, bureaucrats from the tax administration and education authority, and poli‐
ticians). The empirical results of this study indicate that the availability of economic rents alone cannot serve as the determinant factor for explaining changes in Indonesia’s neopatri‐
monial profile, but rather suggest that democratisation and decentralisation do exert a stronger impact.2
To systematically develop the argument, the paper is structured as follows. Section two elaborates on the concepts of rents and neopatrimonialism, and outlines their operationalisa‐
tion and measurement. Section three presents estimations of Indonesia’s rent incomes from primary commodities export. Indonesia’s resource dependence and its resource abundance are both analysed. Section four describes Indonesia’s neopatrimonial profile and discusses its
1 This paper is embedded into a larger research project on the “Persistence and Change of Neopatrimonialism in Various Non‐OECD Regions”, funded by the DFG (Deutsche Forschungsgemeinschaft/ German Research Foundation), based at the GIGA German Institute of Global and Area Studies. With a shared analytical grid, the project compares cases in Sub‐Saharan Africa (Zambia and Kenia, Christian von Soest), Latin America (Venezuela and Argentina, Karsten Bechle), and Southeast Asia (Indonesia and the Philippines, Nina Korte).
Research assistance provided by Jochen Bader and Philipp Poppitz. For more information: <www.giga‐
hamburg.de/projects/neopatrimonialism>.
2 Field research conducted in Jakarta between April and June 2009.
persistence and change over time. Finally, section five discusses conclusions reached regard‐
ing the factors causing neopatrimonialism’s persistence and change.
2 Rents and Neopatrimonialism: Conceptualisation and Measurement
In political economy analysis of resource‐rich countries, a classification which applied to In‐
donesia for many decades—rentier state theory (cf. Beblawi/Luciani 1987; Boeckh/Pawelka 1997)—has assumed an important role. Based on the assumption that economic rents (reve‐
nues which are neither balanced by economic production nor investment) (Khan/Sundaram 2000) are captured and controlled to a large extend by the ruling elite, rentier state theory’s principal argument is that the need for broad domestic tax collection is low (Beblawi/Luciani 1987). Thus, based on a reversal of the paradigm of “no taxation without representation”, ac‐
countability decreases as citizens lack the necessary leverage over their state to make political demands (Moore 2004; 2007). The autonomy from society allows the ruling elite “to use them [i.e. rents] for their self‐interests, which are often not compatible with the principles of good governance and sustainable development” (Beck 2009: 8). Economic rents are therefore under suspicion when it comes to fuelling patrimonial practises. Accordingly, the supposition is that high economic rents cause the persistence of neopatrimonialism (for conceptualisation see below), while lowering economic rents cause its decline. Following this idea, for Indone‐
sia we would expect that a change in the availability of economic rents entails a change of neopatrimonial practises.
As any conclusions upon the hypothesized causal relationships are based on rent esti‐
mates, an accurate measurement is crucial. Various attempts to reach meaningful rent esti‐
mates, differing in the choice of commodities included in calculations and/or methods in cal‐
culation3, have been made in the past. Unfortunately these different measures have regularly delivered “radically different estimation results” (Brunnschweiler 2008: 402). A literature re‐
view of previous studies shows that scholars commonly defined economic rents as external income earned from abroad, in particular export revenues.4 Unsurprising primary commodi‐
ties, in particular hydrocarbons, have attracted the most attention. The reasoning is that “(o)il and gas are indeed the rentier commodities par excellence, due to the enormous surpluses eas‐
ily captured by the state, and the non‐labour intensive extraction” (Anthonsen et al. 2009: 6).
By comparison, hard minerals also received a fair share of attention, but agricultural goods, such as plantation crops, were frequently ignored or excluded.
3 E.g. measuring absolute resource abundance, the share of resource exports, of mineral rents to total exports/
the national budget.
4 Official Development Assistance is not addressed. Similarly, internal rents, e.g. by the imposition of import tar‐
iffs, licences, export subsidies, marketing boards, currency overestimation, parallel exchange rates (cf. Betz 1997), are excluded from this study.
To obtain a comprehensive picture of economic rents entering Indonesia, we assess rents from all of these commodities. Following Sachs and Warner’s (1995) study on the impact of natural resource abundance on economic growth, which calculated the ratio of primary‐
product exports to GDP in 1970 (base year), we define primary commodities as those classi‐
fied within the Standard International Trade Classification (SITC)5 categories 0 (live animals and all unprocessed and processed food products), 1 (beverages and tobacco), 2 (inedible crude materials except fuels), 3 (mineral fuels, lubricants and related materials), 4 (animal and vegetable oil and fats), and 68 (non‐ferrous metals).
Yet, in calculating rents we diverge from Sachs and Warner’s methodology, as it has drawn criticism from various quarters in recent years for two main reasons: (1) its underlying concept of resource dependence, and (2) its export‐based approach. Resource dependence as a relative measure has to be distinguished from resource abundance, i.e. resource wealth in per capita terms, as an absolute measure (De Soysa 2002). Both measurements may differ substan‐
tially. It is possible that two countries are equally dependent upon resource rents, yet when divided by the population, the amount of rents available for the ruling elite to sway individ‐
ual citizens varies markedly (Basedau/Lay 2009). Export‐based measures are regarded as rather inaccurate, as the commodities’ production costs are not taken into account. To achieve a more valid estimate of the final size of revenues for government, the export‐based measure therefore should be replaced by a rent‐based measure (Rosser 2006: 11; Moore 2007).
In response to this criticism, we calculate Indonesia’s economic rents for the period 1970‐
2007 by separately multiplying export values of the defined primary commodities with rental rates. By adding up the different commodities’ values, we obtain aggregate values of primary commodity rents for each year since 1970. Export data is taken from the United Nations Com‐
modity Trade Statistics Database (COMTRADE), while rental rates are taken from the World Bank’s Environmental Accounting Initiative (Hamilton/Clemens 1999; Bolt et al. 2002; World Bank 2005).6 Aiming to estimate the wealth of nations and its sustainability, the World Bank, by the “adjusted net savings” (also: genuine savings) measure, calculated rental rates by the world market price of the resource minus the average extraction costs. In addition, for some catego‐
ries relevant lifting, transportation cost, and normal return to capital were included (Hamilton/Clemens 1999: 339). While the authors themselves acknowledge that their data does have some weaknesses, e.g. the cost estimate is based on data for a single year, and unit costs are assumed to be constant over time in real terms, (Bolt et al. 2002), their data currently appear to be the best suited for calculating export rent estimates (cf. Anthonsen et al. 2009; Collier/
Hoeffler 2009; Segal 2009). To allow for comparability, we present our estimations as a ratio of GDP (resource dependence) and as constant US Dollars per capita (resource abundance).
5 The SITC is a statistical classification of commodities designed by the United Nations, constituting the most commonly published format for foreign trade statistics.
6 Averages of related rental rates were calculated when rental rates were missing for a specific product of a sub‐
category.
Indonesia’s neopatrimonial profile is not any easier to grasp than its economic rents, as neopatrimonialism basically is an elusive concept, trying to capture the informal within the formal. By denoting the simultaneous operation of the patrimonial and the legal‐rational rule within one system, (Eisenstadt 1973; Clapham 1985; Bratton/van de Walle 1997) the concept of neopatrimonialism builds on Weber’s sociology of domination. In his conception of the modern state, Weber (1978 [1922]) distinguished between the ideal type of rational‐legal rule—denoting a clear separation between the public and the private sphere, where rational‐
legal authority follows clearly specified procedures, i.e. is rule‐bound and depersonalised—
and the ideal type of patrimonial rule, as a traditional subtype—denoting the missing sepa‐
ration between the public and the private sphere, meaning that all power relations, political as well as administrative, between the rulers and the ruled, are essentially personal in nature.
In a neopatrimonial system, the legal‐rational framework exists and is accepted, yet is con‐
tested by patrimonial practises. The distinction of the public and the private realm, connotat‐
ing the “modern” state, is blurred (Erdmann/Engel 2007: 105).
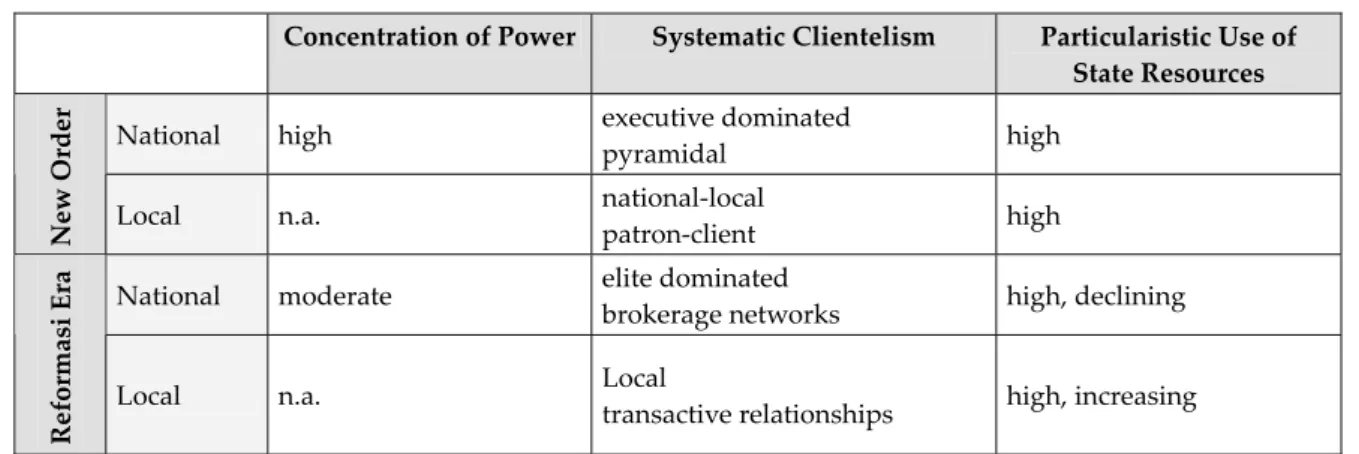
To systematically describe Indonesia’s neopatrimonial profile, a variation of Bratton/van de Walle’s (1997: 63‐68) conceptualisation is used. The study concentrates on three dimen‐
sions: (1) concentration of power, (2) systematic clientelism, and (3) particularistic use of state resources. An analysis of these three dimensions allows an estimation of the degree of neopatrimonialism in a state and its development over time.7 The operationalisation of the three dimensions largely draws upon von Soest (2009: 56‐58). Informal “concentration of power”, analyses the domination of the state by political elites, in particular the role of the president. The focus lies on an analysis of the de facto relationship between the president and the legislatures. In addition the (average) tenure of the president in relation to key minis‐
ters is calculated. This shall give an indication of the concentration of power in the head of state, and will thus be called the power concentration index. It is assumed that a significantly longer tenure of the president in relation to the ministers correlates with a high concentration of power in the president. “Systematic clientelism” looks into the issue of the distribution of government positions and public sector jobs in exchange for personal loyalty and support.
The development of cabinet size and composition, together with public administration growth and civil servants’ qualification, may point to the prevalence of clientelistic and nepo‐
tistic practices. “Particularistic use of state resources” alludes to the use of public office for private gain. Data used comprises Transparency International’s Corruption Perceptions In‐
dex (CPI) (cf. Graf Lambsdorff 2005; TI 1996‐2009), as well as the World Bank’s Governance Index (WGI) in respect to the control of corruption indicator (Kaufmann 2009).
7 Due to the often covert and secretive nature of neopatrimonial practises, one of the main challenges in describ‐
ing the neopatrimonial character of a state lies in identifying objective indicators to complement common per‐
ception‐based indicators. Therefore, analysis is primarily qualitative.
3 Indonesia: From Enclave Economy to Non‐Enclave Economy
Rich in natural resources such as oil, gas, minerals, copper, coal, tin, nickel, bauxite, silver, gold, forests, and waters, natural resource rents have long played an important role for the Indonesian state. Just before Second World War, Indonesia already dominated the oil indus‐
try in the Far East, next to “supplying most of the world’s quinine and pepper, over one‐third of its rubber, one‐quarter of its coconut‐products and one‐fifth of its tea, sugar, coffee and palm oil” (Barnes 1995: 8). Yet, with huge hydrocarbon reserves, and having gained power over water and other natural resources after the declaration of independence (Republic of Indonesia, 1945: Article 33), Indonesia’s natural choice was to focus on the oil industry. By promoting domestic enterprises, entering production‐sharing agreements with an increasing number of foreign oil companies, and providing generous investment incentives, offshore production expanded and new onshore fields began producing, effectively boosting oil pro‐
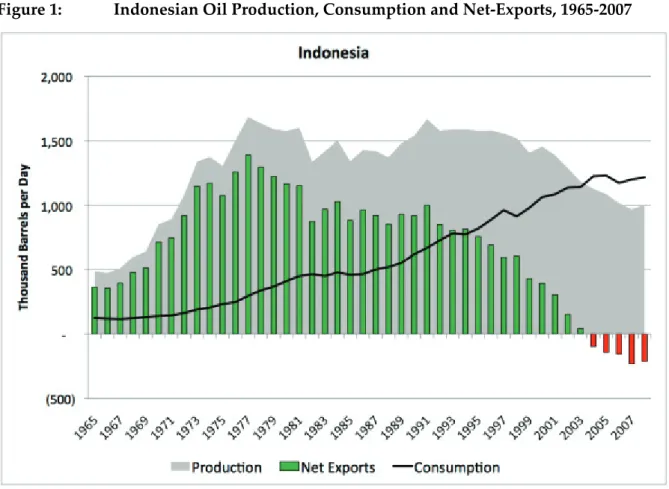
duction and transforming the Indonesian state into an enclave economy. As illustrated in Figure 1 below, the volume of oil produced increased significantly, steadily reaching a first peak at 16.000 bpd in 1977.
Figure 1: Indonesian Oil Production, Consumption and Net‐Exports, 1965‐2007
Source: Mazama Science (2010) based on BP (2009).
For Indonesia during the mid‐1970s and mid‐1980s, oil became the main export commodity and the country’s major source of government revenue, derived from corporate income taxes
and revenue generated by profit‐sharing agreements between the central government and the oil companies. Within ten years (1966‐1976), the share of the oil industry in Indonesian exports rose from about one‐third to about three‐quarters, and from about 5% of government revenue to more than half of the total government revenue (Johnson 1977: 34). Induced by the oil boom of the 1970s, the share of oil revenues in the central budget finally reached a peak of almost 80% in the early 1980s. Since then, the share of oil revenues in domestic reve‐
nue decreased steadily, falling to just over 20% in 2000 (cf. Alisjahbana 2005: 111).
The primary reasons for this decrease can be found in declining oil prices, the restruc‐
turisation of the Indonesian economy away from the primary sector to the manufacturing and services sector, as well as declining net‐exports. Contrary to most OECD‐countries, where there is a trend of declining energy use per unit of GDP, the trend in Indonesia, com‐
parable to other non‐OECD‐countries, is that of increasing or at best stagnant energy con‐
sumption. “In 2000, total energy consumption was more than 3.5 times that of 1980, while per capita energy use was more than 2.5 times that of 1980” (McKibbin 2005: 59). Due to do‐
mestic demand over time, imports soon began to outpace exports, resulting in Indonesia be‐
coming a net importer of oil in 2004. By 2009, Indonesia effectively suspended its member‐
ship in the Organization of Petroleum Exporting Countries (OPEC), of which it had been a member state since 1962 (OPEC 2010).
The export of agricultural goods and hard minerals constituted an additional income source. Yet, despite successful government efforts to diversify the Indonesian economy by placing more emphasis on agricultural goods and hard minerals extraction during the oil re‐
cession years in the 1980s, export volumes and world market prices have never been high enough to offset for depleting hydrocarbon exports. Except for palm oil, whose output rose more than 11‐fold from 1968 to 1992, as well as rubber and a few minor crops such as cocoa, the Indonesian state has not managed to capitalize on opportunities (cf. Hill 2000: 139, 144).
Until today the share of economic rents from agricultural goods and hard minerals is smaller than that of hydrocarbon exports.
In sum, above indicators clearly imply that Indonesia changed in the last 40 years from being an enclave economy to a non‐enclave economy, yet they do not show us the amount of economic rents derived from commodities exports. Figure 2 below shows the export rent es‐
timates as share of GDP, which we calculated following the method described in part two of the paper. Due to limited data availability, only the period 1970‐2007 can be covered.
The declining importance of export rents is similarly visible in this figure. But as the pur‐
ple bar (SITC 3)—constituting rent estimates from hydrocarbon exports—in relation with the developments depicted in Figure 1 indicates, the amount of export rents earned is not de‐
pendent only on the volumes exported. Rather, it is also heavily influenced by the develop‐
ment of international oil prices, which depend on the interactions of supply and demand and are influenced by geopolitical crises, exchange rate developments and strategic speculation of buyers and/or strategic behaviour of the suppliers.
Figure 2: Export Rent Estimate as share of GDP, 1970‐2007
Sources: Own calculation and illustration based on United Nations (2010); World Bank (2005).
Taking these factors into account, it is possible to explain the significant jumps in 1974, 1979, 1998, and 2005 to today. The first jump was the result of the Organization of Arab Petroleum Countries’ (OAPEC) oil embargo in retaliation for U.S. support to Israel during the Yom Kip‐
pur war, which caused the quadrupling of the international world market price of oil. The second high price period between 1979 and 1985 occurred in the wake of the Iranian revolu‐
tion, causing a serious drop in oil supplies, and the later high‐price policy maintained by OPEC. The temporary increase between 1998 and 2003 can be explained by the impact of the Asian economic crisis, which severely hit Indonesia, in combination with higher oil prices and a depreciated Rupiah. The high oil prices since 2005 are primarily the result of increasing demand combined with a speculative bubble.
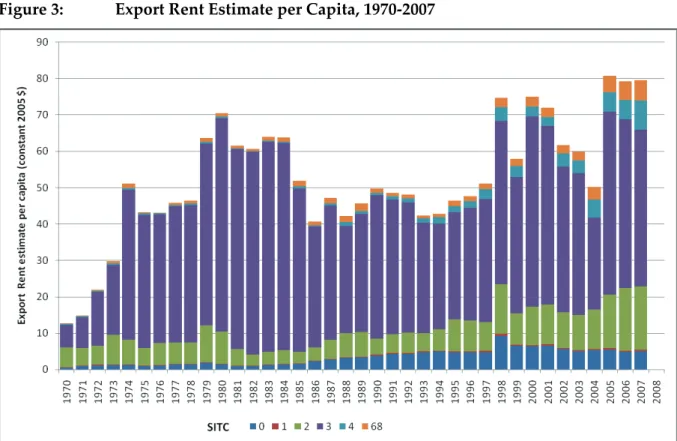
In per capita terms, as depicted in Figure 3, the fluctuations show a largely comparable pattern.
Figure 3: Export Rent Estimate per Capita, 1970‐2007
Sources: Own calculation and illustration based on United Nations (2010); World Bank (2005).
While rent incomes as a share of GDP significantly declined over the years, rent estimates per capita since the mid‐1970s did not show significant deterioration. With less than $80 per cap‐
ita at any time, compared to more than 14% of the GDP at peak times, we can discern that the Indonesian state was depending on rents for quite some time, yet due to its high population has never really shown resource abundance.8
4 The Changing Nature of Neopatrimonialism in Indonesia
To assess whether a causal relationship between economic rents and the persistence and change of neopatrimonialism exists, next to rent estimates, we need a systematic and accurate picture of the development of Indonesia’s neopatrimonial profile. The period of assessment similarly constitutes the previous four decades. As will be shown, all three dimensions of neopatrimonialism—concentration of power, systematic clientelism, and particularistic use of state resources—have featured consistently in the course of Indonesia’s political development.
8 A similar observation can also be made by comparing the development of the OPEC per capita net oil export revenues of Indonesia with other oil exporting states (EIA 2008).
4.1 Concentration of Power
Between 1970 and today, two distinct regime periods can be distinguished. The authoritarian New Order regime of President Soeharto, which lasted from 1967 until his ouster in 1998, and the following democratic Reformasi Era, which saw peaceful and orderly change of so far four presidents: B. J. Habibie (1998‐99), Abdurrahman Wahid (1999‐2001), Megawati Su‐
karnoputri (2001‐2004) and Susilo Bambang Yudhoyono (2004‐present).
The New Order regime was characterised by a steadily increasing concentration of power in the hands of the president. While the 1945 Constitution assigned political power to the president and two legislative bodies, the People’s Consultative Assembly (MPR) and the People’s Representative Council (DPR), the overall picture of the regime was that of a domi‐
nant executive. Constitutionally, the MPR’s assigned functions were to elect the president and the vice‐president every five years, amend the constitution, determine the Broad Out‐
lines of State Policy (GBHN), and issue quasi‐constitutional decrees. DPR’s main assigned functions were to adopt legislation and pass implementation laws for the broad directives of MPR (Republic of Indonesia 1945: Chapters 1‐2).
In reality, the legislatures had a more symbolic character. During his reign, Soeharto tightened his control by depoliticizing the Indonesian society, silencing opposition, and care‐
fully controlling and manipulating electoral processes. Election results were predictable: leg‐
islatures dominated by parliamentarians of the government’s electoral vehicle, Golkar (Party of Functional Groups), and the military. Parliament was the place, “where cronies and time‐
servers could be rewarded or side‐lined, and where a ritualised pretence of democracy could be played out” (Sherlock 2003: 4). The legislatures were powerless, rubber‐stamp legislatures, existing to give legitimacy to appointments and decisions already determined by President Soeharto and his inner circle, and not to review and restrict executive actions (cf. Ziegenhain 2008: 45‐77; Sukma 2003: 245‐246). “Cynics alleged that its members adhered to the principle of ‘5 D’ that is datang, duduk, diam, dengar, duit, which means ‘come, sit, be quiet, listen, [take the] money” (Eklöf 2003: 129).
Consequently, Soeharto’s reinauguration by the MPR was certain. Generally no other can‐
didates were proposed and the decision was unanimous. It was more of a ritual than an elec‐
tion, building into “Indonesia’s bureaucratized and encapsulated political process regular op‐
portunities to reorganize higher echelons and to take policy steps that encourage an image of a regime leading from a position of reinvigorated popular strength” (Emmerson 1984: 136).
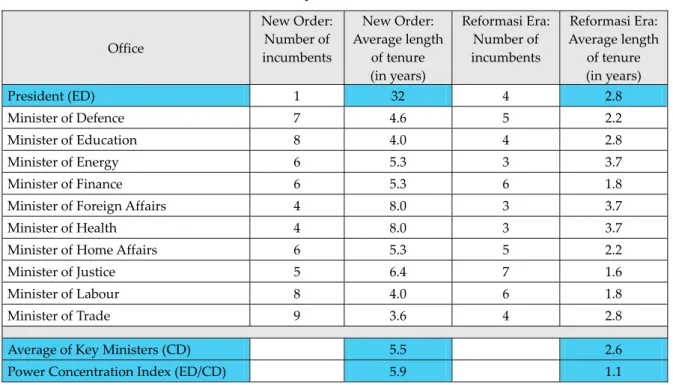
An analysis of cabinet ministers’ rotation confirms that Soeharto made regular use of these opportunities. Table 1 below shows the results of a count of the number of different in‐
dividuals appointed to head crucial government departments. These are considered as key ministers for their theoretical potential to challenge the president, and for the departments’
significance in rewarding loyal followers. The average length of tenure of all key ministers of 5.5 years corresponds closely with the constitutional term of office of five years. This figure is relevant in two regards. First, it indicates the relative political stability of the New Order re‐
gime. Second, in relation with the average tenure of the president, it indicates the high con‐
centration of power in President Soeharto.
Table 1: Tenure of Presidents and Key Ministers in Indonesia (1967‐2009)
Office
New Order:
Number of incumbents
New Order:
Average length of tenure (in years)
Reformasi Era:
Number of incumbents
Reformasi Era:
Average length of tenure (in years)
President (ED) 1 32 4 2.8
Minister of Defence 7 4.6 5 2.2
Minister of Education 8 4.0 4 2.8
Minister of Energy 6 5.3 3 3.7
Minister of Finance 6 5.3 6 1.8
Minister of Foreign Affairs 4 8.0 3 3.7
Minister of Health 4 8.0 3 3.7
Minister of Home Affairs 6 5.3 5 2.2
Minister of Justice 5 6.4 7 1.6
Minister of Labour 8 4.0 6 1.8
Minister of Trade 9 3.6 4 2.8
Average of Key Ministers (CD) 5.5 2.6
Power Concentration Index (ED/CD) 5.9 1.1
Source: Author’s calculation based on The Jakarta Post (2009).9
President Soeharto’s successors faced fundamentally different political realities. Since the demise of his highly centralised regime in May 1998, Indonesia’s presidents have been con‐
fronted with strengthened legislatures and political fragmentation. These have effectively curtailed presidential power.
Four major constitutional amendments enacted between 1999 and 2002 have transformed the authoritarian political structures into internationally recognized democratic political structures.10 DPR was moved back to the centre stage of political life and was supplemented by a Regional Representatives Council (DPD), while the MPR lost most of its powers (Sherlock 2007, 2010). The military’s role was severely curtailed, civil rights reintroduced, po‐
litical parties and civil society groups founded, and decentralisation pursued.11 Further in 2004/ 2005, the direct election of all executive positions, including the president and the vice‐
president, were introduced. On balance, the president’s power can by now be described as strong, yet restrained (Interview, Social Scientist, Jakarta, 12.05.2009).
B. J. Habibie, who was Soeharto’s longest‐serving cabinet minister, was not elected presi‐
dent, but simply followed President Soeharto as his former vice‐president. While the consti‐
tution at this time in the government had not yet been amended, he was the first to feel the
9 Cabinets included into the calculation range from the Revised Ampera Cabinet under Acting President Soeharto, serving from October 1967, to the United Indonesia Cabinet under President Yudhoyono, serving until Octo‐
ber 2009. In calculating averages, the observed period of New Order resp. Reformasi Era were each divided by the number of incumbents. ED stands for Executive Duration, while CD stands for Cabinet Duration.
10 As of 2010, Indonesia is the only ASEAN country considered an electoral democracy, and the only state in the region considered as “free” (Freedom House 2010).
11 For detailed discussions of the constitutional amendments see Lindsey (2002) and Ellis (2002).
reinvigorated strength of the Indonesian legislatures, when the People’s Consultative As‐
sembly rejected his presidential accountability report. As a result, Habibie opted not to pur‐
sue the presidential candidacy in the 1999 elections, which he had already scheduled during his first week in office in an effort to acquire legitimacy.
Indonesia’s founding elections were overall free and fair (Suryadinata 2002: 94‐96). Of 48 parties contesting in the general elections, 21 parties were able to gain representation in the People’s Representative Council. While Megawati Soekarnoputri’s Indonesian Democracy Party of Struggle (PDI‐P) gained victory in the general elections, after “a series of backroom deals involving promises of cabinet appointments and other perquisites” (Crouch 2010: 52), Abdurrahman Wahid from the National Awakening Party (PKB), which had only gained third place, was elected president in the MPR’s general session. Wahid’s presidency was simi‐
larly short‐lived. While he depended on political party support, his leadership style was in‐
coherent, and at times erratic and capricious. By the end of his first year, he had alienated virtually all political parties. Indonesia’s legislatures once again showed their reinvigorated strength, and impeached President Wahid on grounds of corruption allegations.
Following his impeachment, Megawati Soekarnoputri, Wahid’s vice‐president, ascended to power in 2001 (cf. McIntyre 2005). Adopting the strategy of inclusion, Megawati was able to sustain until the end of the term, but she was not able to secure political backing and pub‐
lic support. In 2004, Megawati sought re‐election in the first direct presidential elections, yet was defeated by the reform‐minded and widely popular Susilo Bambang Yudhoyono. Yud‐
hoyono is the first post‐Soeharto president who not only served a full term but also gained a second term in the presidential elections of 2009.
The neopatrimonial power concentration in the president has clearly declined. On aver‐
age, as described in Table 1 above, Reformasi Era presidents have only served 2.8 years, which is less than a legislature period. The key ministers’ tenure with 2.6 years differs only slightly from the average tenure of the presidents, indicating that frequent turnover was not a strategy practised by post‐Soeharto presidents to secure their positions.
Comparing the power concentration index of 5.9 for the New Order period and 1.1 for the Reformasi Era period, we can deduce that presidential power is by now far more restricted than presidential power during authoritarian Indonesia. POLITY IV’s Executive Constraints Indicator (Marshall/Jaggers 2009), the World Bank’s Database of Political Institutions (DPI) In‐
dicator Checks (Keefer 2007), and Henisz’s (2000) Political Constraints Index substantiate this impression. All three indicators show very low values during the Soeharto years and steep rise following the introduction of democracy, e.g. the DPI indicator Checks counts only one veto‐player for the period 1975‐1999, two between 2000‐2003 and five veto‐players since 2004.
The comparison of constitutional provisions and presidential leadership style further supports the conclusion that presidential‐power concentration is a result of constitutional provisions, but also the result of specific actions taken by the president. Economic rents play a secondary role, yet, as will be demonstrated in the following sections, rent‐sharing and rent‐seeking have been important elements of Indonesian politics.
4.2 Systematic Clientelism
Patronage distribution formed the backbone of Soeharto’s New Order regime. When Presi‐
dent Soeharto first assumed power his political base was rather weak. To strengthen his posi‐
tion, Soeharto created personal loyalties, rewarded supporters and bought off potential op‐
ponents by distributing public sector positions and public resources (cf. Crouch 1979).
Cabinet size and composition serve as indicators for the provision of personal favours and the character of these favours. Figure 4 below describes the growth of the ministerial cabinet between 1970 and 2009.12
Cabinet size during the New Order regime ranged between 22 and 38 cabinet ministers.
Even considering Indonesia’s large population of already more than 150 million in the late 1970s and its vast landmass of 1.9 million km2, which certainly require different administra‐
tive approaches than much smaller countries, the size of Indonesia’s ministerial cabinets were bloated.13 Indonesian cabinet structure has changed several times. Ministerial compe‐
tences have never been clear‐cut, nor has the functional necessity of various ministries been proven (Interview, Politician, Jakarta, 13.05.2009). Therefore, it seems reasonable to suppose that patrimonial considerations, rather than considerations of competence and meritocracy, have guided the selection of cabinet ministers.
Cabinet minister positions were divided into those in “wet” and “dry” departments, ac‐
cording to inherent possibilities for making use of the offices for private and pecuniary ends.
“The most lucrative (…) are those offices with the power to allocate drilling leases, mining leases, forestry concessions, import and export licenses, government contracts for construc‐
tion and supply, and state bank credit” (Robison 1990: 14).14
The distribution of cabinet positions, however, was not solely based on patronage con‐
siderations. While it was certainly true that those in coordinating positions were the “essence of hard working, unquestioning loyalty, men who owed their careers to his favour” (Elson 2001: 226), at least during the early period of his regime, Soeharto, with the intention of fos‐
tering national development, also included technocrats in his cabinets. Developmental ar‐
guments also serve to explain the massive expansion of his cabinet by 1984, when Soeharto split government departments and introduced the office of the junior minister (cf. Jones 1984:
161‐162). Notably, the presentation of the military throughout most of Soeharto’s regime was strong, accounting for up to 40% of all cabinet ministers in the 1970s. However, by the mid‐
12 The size of the cabinet varies significantly between different sources (Akinyoade 2008: 3; Banks 2010; Bap‐
penas [National Development Planning Body] 2009; Tapiomas 2006: 141‐159). The general development trend, however, is largely comparable. Thus, it shall be noted that the described trend is more accurate than the ac‐
tual numbers. Following Bappenas, the National Development Planning Body (2009), cabinet size depicted in‐
cludes coordinating ministers, ministers, state ministers, and junior ministers.
13 Internationally, an average size of 15 to 25 cabinet ministers is regarded sensible.
14 Similarly lucrative were positions in state‐owned corporations (cf. McLeod 2000). E.g. Pertamina, the national state oil corporation, served as a major income source for the New Order regime (cf. Mackie 1970; Seda 2005).
and late 1980s, he turned away from the military, as well as technocrats. By the mid 1990s, Soeharto generally thought only of his closest and most trusted political and business associ‐
ates and family members when selecting his cabinet. Crony capitalists stood at the core of the patronage network (cf. Mietzner 2009: 61).
Figure 4: Size of Cabinet (1970‐2009)
0 5 10 15 20 25 30 35 40
1970 1972 1974 1976 1978 1980 1982 1984 1986 1988 1990 1992 1994 1996 1998 2000 2002 2004 2006 2008 2010
Number of Cabinet Members
Source: Bappenas (2009).
As Figure 4 above shows, following democratisation, the number of cabinet ministers was reduced, yet not significantly (ranging between 25 and 33) nor sustainably. On the contrary, the number of cabinet ministers has again been rising, standing at 33 ministers by 2009. This must again be described as bloated. On first sight, one would perceive a continuity of the New Order, yet upon an analysis of cabinet members’ identities and qualifications, some change is clearly perceptible.
As the previous section has demonstrated, all post‐Soeharto presidents faced the chal‐
lenge of political fragmentation and strengthened legislatures. The implications for (and the reactions to) this situation have been largely comparable. The role of the military has been reduced, while the role of political party representatives has significantly increased. Despite interim‐president Habibie, who reinstalled more than half of Soeharto’s former cabinet, all Reformasi Era presidents resorted to inclusive cabinets, often at the expense of political cohe‐
sion and functionality. The appointment of cabinet ministers is largely the result of a series of
background negotiations, deal‐making and “cow trading” (dagang sapi). “The coalitions they (i.e. Indonesia’s democratic presidents) build are not based on policies or shared values, it’s all a matter of power, sharing the power, getting power, getting rents, getting cabinet posi‐
tions” (Interview, International Organisation Representative, Jakarta, 05.05.2009).
Wahid managed to secure the presidency only by promising to share the cabinet among all political factions (Crouch 2010: 31; Kingsbury 2005: 290). Megawati included ministers from virtually all significant political parties into her ‘rainbow cabinet’ to mitigate the pros‐
pects of a later challenge from DPR and MPR. Yudhoyono, while holding a strong mandate as the first directly elected president, chose to form a broad coalition in DPR, as his party was far from having a majority (Roberts 2004). However, Yudhoyono set a precedent by requiring his cabinet members to sign contracts and base cabinet reshuffles on performance assessments.
In conclusion, during the period under observation, patronage by cabinet positions was an important factor, yet not the most important. All presidents have taken both personal loy‐
alty and competence into consideration of whom to appoint to which post. What appears to have changed, due to stronger political competition, is the ultimate motive of why patronage is extended. Presidents are no longer in a “big man” position, their political survival depends on public acceptance, and their political success is strongly influenced by the political elite (Interviews, Civil Society, Jakarta, 23.04.2009, Business Representative, Jakarta 07.05.2009).
An additional indicator for systematic clientelism is the size and qualification of public administration. Figure 5 below describes its rapid expansion.
Figure 5: Size of Public Administration (1970‐2009)
0 500.000 1.000.000 1.500.000 2.000.000 2.500.000 3.000.000 3.500.000 4.000.000 4.500.000 5.000.000
1970 1972 1974 1976 1978 1980 1982 1984 1986 1988 1990 1992 1994 1996 1998 2000 2002 2004 2006 2008 2010
Number of Public Servants
Sources: Logsdon (1998: 5‐6); Ufen (2002: 222); BKN (2003‐2009).
Following independence, the Indonesian bureaucracy was transformed into a massive job‐
creation machine with the rewarding of those who were engaged in the armed struggle for independence (van Klinken 2009: 885). This character has been maintained for much of the period under observation. Indonesia’s civilian bureaucracy more than doubled during the New Order regime. Between 1974 to 1984, the bureaucracy increased by 66%; between 1984 to 1994 by 42%, thus far outpacing the growth in population growth but not GDP (Logsdon 1998: 6). Part of the increase “was due to rapid expansion of services like education and health” (van Klinken 2009: 887), but more important were nepotistic considerations. During the New Order, bureaucracy was the place to provide cronies, family and friends with a job.
In many cases, primary education was regarded as sufficient15 (ADB 2004 62; Harun 2007:
371‐372). By 1994, however, falling oil prices forced the Indonesian state to adopt a zero‐
growth policy, which caused the number of civil servants to level off. By 1999, following de‐
mocratisation, a minus‐growth policy was instituted. But it was made a mockery of in the following years when in 2005 and 2007 the government passed legislation to lift almost one million honorarium staff to civil servants’ status (cf. Riau Pos 2009), and a new high in the absolute number of civil servants was reached.
As a legacy of the New Order, Indonesia’s hiring guidelines largely “maintain closed hir‐
ing and appointment systems that do not encourage appointments and promotions based on competence and performance” (ADB 2004: 58). Large parts of Indonesia’s bureaucracy are not fit for purpose. According to Taufik Effendi, former State Minister for Administrative Re‐
forms, 65% of civil servants do clerical jobs and are not functional. In addition, a large num‐
ber of civil servants had been placed in positions for which they were not academically quali‐
fied (Gatra 2006).
Nowadays, bureaucratic reform is slowly moving forward. A little more attention is paid to competence and merit at national level than before. Professional recruitment has been in‐
troduced in some departments, e.g. the Department of Finance has introduced new human resource management policies (Interviews, Government Officials, Jakarta 12.05.2009, 29.05.2009). In addition, appointments of key state officials are now the shared responsibility of the executive and legislative. Collusion and nepotism is still widely found in appointment, transfer and promotion processes. The subnational level in many areas is still unreformed, and direct elections of regional heads in many regions have even exacerbated the situation.
Nepotism is prevalent, e.g. it is rather common for newly elected executive heads to reward his/her election campaign financiers and supporters with positions in his/her government and administration (cf. Erb/Sulistiyanto 2009). But notably “(t)oday’s relationships resemble more transactive relationships than patron‐client relationships” (Interview, Civil Society Representative, Jakarta, 06.05.2009).
15 On the main characteristics of the Indonesian civil service during the New Order regime see Warwick (1987:
40‐45).
4.3 Particularistic Use of State Resources
Corruption in Indonesia has been both systemic and endemic, and affects all levels of society.
Particularistic use of state resources has not only been accepted in Indonesia, but it has been encouraged as well. “The problem of Indonesian government and administration precisely does not lie in having bad people, but more in having a bad system.” (Interview, Politician, Jakarta, 19.06.2009). Soeharto himself appropriated and distributed public resources for pri‐
vate ends. Officials at lower levels were granted the right to act in a similar way.16 Salaries of government personnel were kept low, while numerous mechanisms enabling rent‐seeking were put in place (Gray 1979; Mackie 2010: 90). Thus, in an effort to compare Soeharto’s pa‐
tronage networks, scholars reverted to the images of a pyramid with him sitting at the apex of power (Liddle 1985: 71; MacIntyre 1991: 7), and the business model of franchising (McLeod 2008b; 2010).
The main beneficiaries of the New Order’s first decade were a comparatively small circle of military officers, civilian bureaucrats, civilian politicians, intellectuals and Chinese entre‐
preneurs. Yet, by the 1980s, Soeharto’s patronage network began expanding massively, in‐
cluding family and friends who themselves were not often military personnel or bureaucrats.
Military, politics, bureaucracy, and business in Soeharto’s Indonesia became fused.
“Parties, factions of parties and military commands secured control of various strategic sections of the state apparatus, dividing amongst themselves government departments, banks, state corporations controlling trade, economic policy, resources, credit and contracts”
(Robison 1990: 38). Accountability on money flows has been deficient. Neither state revenues nor expenditures were fully accounted for. Though volumes are unknown, it was discovered that many government entities held off‐budget funds, and large amounts of government ex‐
penditure occurred off‐budget (cf. MacIntyre 2000).17
“One of the key functions of the bureaucracy was to implement policies that would gen‐
erate rents on behalf of the beneficiaries of the franchise system” (McLeod 2008a: 201). It was not to provide service to the citizens. Within the administration there was a market for posi‐
tions, transfers and promotions, and in relation to citizens, prices for basically every “ser‐
vice” existed (Kristiansen/Ramli 2006). Public administrators have viewed themselves as rul‐
ers, not public servants. The aim of public administration has not been to promote and exe‐
cute the public interest, but to serve political and private interests (Thoha 2003: 11; Prasojo 2009: 17‐18).18 So far, despite the introduction of various anti‐corruption programmes, little
16 Some scholars attributed Soeharto’s government style to the tradition of pre‐colonial Javanese kings who dis‐
tributed appange benefices to supporters, clients, and family (cf. Geertz 1956).
17 As late as May 2007, Indonesia’s Supreme Auditing Board (BPK) still identified more than 5,000 illegal ac‐
counts containing a total of 9.08 trillion Rupiah ($1 billion) (Badoh 2007).
18 “Pre‐crisis estimates of the net worth of the Soeharto family run to many billions of dollars, while cronies such as Liem Sioe Liong became among the richest individuals in Asia. Countless high‐level bureaucrats, military
has changed (Interviews, International Organisation Representatives, Jakarta 30.04.2009, 05.05.2009, Social Scientist, Jakarta, 12.05.2009, Politician, Jakarta, 10.06.2009).19
With regard to corruption, contemporary Indonesia is characterized by two countervail‐
ing trends. Decentralisation, and the following introduction of direct elections on the local level, is perceived to have caused a shift in corruption from the central to the local level.
While transparency and accountability on the national level is increasing, the rise of local players has led to a rise in corruption in many provinces and districts. Differences between local government entities are attributed to leadership differences: “Administrative corruption seems to be somewhat lower in districts with good leadership” (von Luebke 2009: 219). The general impression is, that
“(t)he primary difference today is not in the amount, but in the pattern. During the pe‐
riod of Soeharto, the pattern was centralised, as everyone made deposits to one point only. While today corruption is spreading with the result that the patrons are also be‐
coming even more. Today we have more players from the bottom level to the highest level until corruption takes place from the smallest to the biggest level”.
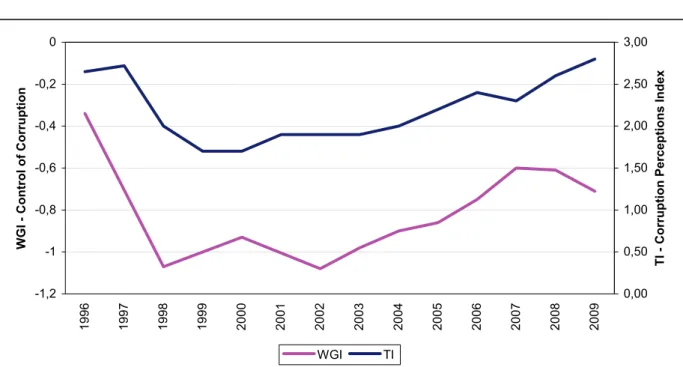
(Interview, Civil Society Representative, Jakarta, 27.04.2009) As presented in Figure 6 below, both Transparency International’s Corruption Perceptions Index and the World Bank’s Governance Indicator Control of Corruption, however, depict an overall positive development with regard to corruption in Indonesia.
Transparency International reports that overall corruption perception has declined (TI 1996‐2009), and the Worldwide Governance Indicator project perceives an increasing control of corruption (World Bank 2009). The apparent discrepancy between the trends described by the interview material and by Transparency International and the World Bank might be at‐
tributed to different foci of perception. While the interviewees might have had in mind inci‐
dences of corruption, perceptions voiced in World Bank and Transparency International sur‐
veys might have been more influenced by the Indonesian governmentʹs strong anti‐
corruption rhetoric and efforts in the investigation and criminal prosecution of corruption‐
related incidents amongst politicians and public officials. Both perceptions are valid and both lead to the conclusion that Indonesia continues to have a massive corruption problem in absolute terms.
officials, state enterprise managers and judges became fabulously wealthy relative to their miserably small of‐
ficial salaries” (McLeod 2010).
19 For an overview of post‐New Order attempts to eradicate corruption see Setiyono/McLeod (2010) and Schütte (2009).
Figure 6: Indonesia – Control of Corruption and Corruption Perception (1996‐2009)
-1,2 -1 -0,8 -0,6 -0,4 -0,2 0
1996 1997 1998 1999 2000 2001 2002 2003 2004 2005 2006 2007 2008 2009
WGI - Control of Corruption
0,00 0,50 1,00 1,50 2,00 2,50 3,00
TI - Corruption Perceptions Index
WGI TI
Source: World Bank (2009); Transparency International (1996‐2009).20
5 Conclusion
Does a positive relationship between the amount of economic rents and the degree of neopatrimonialism exist? Based on a case study of Indonesia’s income from economic rents and the changes in its neopatrimonial profile over the course of the last 40 years, the answer is ambivalent. This study’s findings indicate that the presence of economic rents allowed neopatrimonial practises, including corruption, collusion, and nepotism (KKN), but rents alone cannot explain how these practises developed over time. In accounting for the persis‐
tence and change of neopatrimonialism, democratisation and decentralisation exert a stronger impact. In other words, economic rents may have an indirect influence, but a direct causal relationship cannot be traced.
Economic rents constituted an enabling factor for Soeharto’s political regime. The degree of patrimonialism increased with increasing economic rents induced by the oil‐boom in the 1970s. Soeharto was able to position himself as the “big‐man” and provide his family and cronies with strategic positions to gain huge benefits from the Indonesian state. Moreover, vastly expanded opportunities for rent‐seekers ensured that Soeharto’s authority became vir‐
tually unchallenged, as rewards for loyalty and costs of disloyalty were high. Economic rents can thus be regarded as supporting pillars to the New Order.
20 The ‘control of corruption’ indicator ranges from –2.5 to +2.5, with higher scores denoting “better” outcome.
The ‘corruption perceptions index’ ranges from 0 to 10, with the value 10 denoting the lowest level of percep‐
tion of corruption. Year‐to year comparisons have to be handled with caution, as changes in score can result from a changed perception, but also from a change in the sample or methodology (cf. Rohwer 2009).