Veröffentlichungsreihe der Abteilung Institutionen und sozialer Wandel des Forschungsschwerpunkts Sozialer Wandel, Institutionen und Vermittlungsprozesse des
Wissenschaftszentrums Berlin für Sozialforschung ISSN 1615-7559
Berlin, May 2001
Wissenschaftszentrum Berlin für Sozialforschung gGmbH (WZB) Reichpietschufer 50, D-10785 Berlin,
Telefon (030) 25 49 1-0 FS III 01-201
Human Development as a General Theory of Social Change:
A Multi-Level and Cross-Cultural Perspective
Christian Welzel, Ronald Inglehart, and Hans-Dieter Klingemann
Zitierweise:
Welzel, Christian, Ronald Inglehart, and Hans-Dieter Klingemann, 2001:
Human Development as a General Theory of Social Change: A Multi-Level and Cross- Cultural Perspective
Discussion Paper FS III 01-201.
Wissenschaftszentrum Berlin für Sozialforschung (WZB).
Zusammenfassung
Das vorliegende Papier zeigt, dass sozio-ökonomische Entwicklung, kulturelle Modernisierung und demokratische Regimeperformanz ein kohärentes Syndrom sozialen Wandels bilden – ein Syndrom, dessen integrierender Kern von der klassischen Modernisierungstheorie nicht hinreichend spezifiziert wurde. Wir spezifizieren diesen Kern mit dem Konzept der Humanentwicklung. Wir argumentieren, dass die drei Komponenten der Humanentwicklung dahingehend zusammenwirken, dass sie die individuelle Optionsvielfalt steigern. Sozio-ökonomische Entwicklung erweitert Optionen, indem sie den Individuen mehr Ressourcen verleiht; kulturelle Modernisierung mobilisiert Ansprüche, die die Individuen nach Optionsvielfalt streben lassen; und Demokratie sichert Optionen durch rechtliche Garantien. Eine Analyse der Weltwertestudien zeigt, dass es (1) einen universellen Nexus aus Ressourcen, Ansprüchen und Garantien gibt, der sich auf der individuellen, nationalen und supra-nationalen Ebene über 80 Gesellschaften und 8 Kulturzonen nachweisen lässt; (2) dass die endogene Genese dieses Syndroms der Humanentwicklung durch kausale Effekte von Ressourcen und Ansprüchen auf Garantien zustande kommt; und (3) dass regelkonformes Elitenverhalten eine exogene Determinante dieses Syndroms insgesamt ist.
Abstract
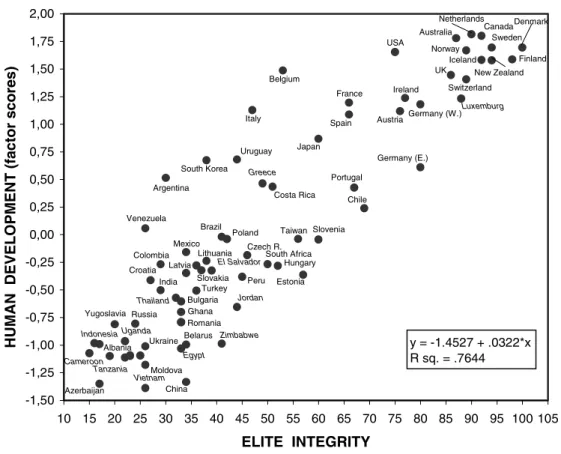
This paper demonstrates that socioeconomic development, cultural modernization, and democratic regime performance constitute a coherent syndrome of social change—a syn- drome whose common focus has not properly been specified by standard modernization theory. We specify this syndrome as Human Development, arguing that its three compo- nents have a common focus on individual choice. Socioeconomic development broadens individual choice by giving people more resources; cultural modernization gives rise to aspirations that lead people to seek for individual choice; and democracy extends individ- ual choice by codifying legal opportunities. Analysis of data from 80 societies demon- strates: (1) that a universal resource-aspiration-opportunity syndrome is present at the individual, national and supra-national levels across 80 nations and 8 cultural zones; (2) that this Human Development syndrome is endogenously shaped by a causal effect from resources and aspirations on opportunities; and (3) that elite integrity or “good governance”
is a strong exogenous determinant of the Human Development syndrome as a whole.
Christian Welzel, Ronald Inglehart, and Hans-Dieter Klingemann
Human Development as a General Theory of Social Change: A Multi- Level and Cross-Cultural Perspective
Introduction
Students of social change have focused on three major processes. The most fundamental one, socioeconomic development, has been described innumerable times (among many oth- ers see Lewis 1955; Rustow 1963; Bell 1973; Chirot 1986; Perkin 1996; Rowen 1996;
Estes 1998; Hughes 1999). Most scholars agree that socioeconomic development reflects a set of closely linked changes including productivity growth, improving quality of life in terms of health and life expectancy, increasing material prosperity, expanding education and communication, and increasing social diversification.
The second process, cultural modernization, is assumed to co-evolve with socioeco- nomic development when rationalized market relations and expanding horizontal networks disburden people from hierarchical and parochial clientelistic ties that restrict human autonomy (Weber 1958; Banfield 1958; Eckstein 1988; Coleman 1988). Cultural moderni- zation, if it occurs, reshapes a society’s prevailing attitudes in ways that have been described in various terms, such as the emergence of “democratic personalities” (Lasswell 1958; Sniderman 1975), “civic cultural attitudes” (Almond and Verba 1963), “individual modernity” (Inkeles and Smith 1974; Inkeles 1983), “postmaterialist values” (Inglehart 1977, 1990), “liberal attitudes” (Brint 1984; Nevitte 1996), or “social capital” (Coleman 1988; Putnam 1993; Fukuyama 1995). Cultural modernization is present to the degree that traditional-deferential orientations, which subordinate the individual to the community, give way to more ambitious aspirations which emphasize the value of the individual and which include increasing self-respect, more self-determined forms of civic engagement, less personalized and more generalized forms of social trust as well as growing tolerance of human diversity (cf. Eckstein 1988; Nevitte 1996; Inglehart 1997).
The third major process occurs in a society’s political institutions. The most notable development in this field has been a profound tendency to improving the democratic per- formance of political regimes during the past three decades. This happened in two ways.
Most obviously, numerous authoritarian regimes have adopted representative democratic institutions through the “Third Wave of Democratization” (Huntington 1991; Sørensen 1993; Linz and Stepan 1996; Kurzman 1998; Nagle and Mahr 1999; Dorenspleet 2000).
On the other hand, there seems to be a more subliminal trend in established representative democracies. Since the late 1970s, most of them have implemented or extended direct democratic institutions (Cronin 1998; Scarrow 1999) and they have experienced more direct democratic forms of civic participation (Barnes, Kaase, et al. 1979; Budge 1996;
Dalton 1996). Some scholars interpret these changes as an acceleration of a more enduring historical trend towards the “growth of democracy” (Gurr, Jaggers, and Moore 1990;
Diamond 1993; Modelski and Perry 1993; Jaggers and Gurr 1995).
As often as the processes of socioeconomic development, cultural modernization and democratization have been described (for a recent affirmation see Pye 1990 and Diamond 1992), they have been suspected and even refuted (see Randall and Theobald 1998 for a discussion of revisionism and modernization). It has been debated, for instance, whether these processes manifest irreversible linear trends or follow cyclical patterns with major setbacks; whether they are uniformly global or culture-specific in a way that prescribes an inherently Western model; and even whether they are desirable or not.
One point, however, can hardly be denied: if socioeconomic development, cultural mod- ernization and democratization occur, they tend to do so on coincidently low or high levels.
Societies that are economically less advanced, most obviously those in Sub-Saharan Africa, tend to be dominated by traditional belief systems and usually have political regimes whose democratic performance is poor. Most of the OECD-countries, by contrast, are economi- cally advanced and characterized by modern mass cultures. Usually their regimes show a strong democratic performance (see Inglehart and Baker 2000 for statistical evidence of this global pattern). On a smaller scale, the same pattern characterizes the postcommunist world: economically more advanced countries, like the Czech Republic, Hungary, or Poland, show more modernized cultures and have better consolidated democracies than economically less advanced ones, such as Romania, Belarus, or Ukraine (see Rose 2001).
In any case, there seems to be a strong coincidence between nations’ socioeconomic devel- opment, cultural modernity and democratic performance.
This insight is not new. In fact, it is conventional wisdom of classical modernization theory (see Lerner 1958; Lipset 1959; Coleman 1968; Pye 1990; Diamond 1992). What is new, is the empirical evidence that has been added in recent years: thanks to the World Values Surveys this applies in particular to the role of cultural modernization (Inglehart 1990, 1997; Inglehart and Baker 2000). Yet, we lack an integrated theory of social change.
Modernization theorists have argued for close relations between socioeconomic develop- ment, cultural modernization and democratic performance, but they did not properly spec- ify the common focus of these three phenomena. Either they used modernization as an umbrella term which has been defined by enumerating its concrete components but not by what integrates them (Lerner 1968: 385); or they restricted modernization to the socioeco-
nomic field which let them view democracy as a consequence rather than an integral part of modernization (Huntington 1991: 69); or they specified modernization in formalistic terms, such as “functional differentiation” (Mouzelis 1999), which provides no evident criteria to distinguish what is and what is not an element of modernization. Hence, there is no general definition of modernization that clarifies in which common principle its various compo- nents converge.
Empirical studies reflect this lack of theoretical integration. Most of them focus on only one of the three relationships within the syndrome of socioeconomic development, cultural modernization and democratic regime performance. These studies pay little or no attention to the fact that they capture only one facet of a more comprehensive syndrome. Thus, existing explanations of this syndrome’s internal linkages are disintegrated. They do not refer to a common principle and are therefore only loosely related to each other. Arguments about causal effects are based on isolated bivariate logics. Even the few studies that deal with all three processes dissolve the whole complex into single pairs of relations, each of which is discussed in separation (cf. Muller and Seligson 1994; Inglehart 1997; Sides 1999;
Inglehart and Baker 2000). As a consequence, the debate is fragmented and puzzling.
Indeed, the literature entails six contradicting hypotheses, one for each causal relationship that is logically possible.
Following Lipset (1959), numerous authors claimed that socioeconomic development leads political regimes to improve or sustain their democratic performance (among others Cutright 1963; Bollen and Jackman 1985; Lipset, Seong, and Torres 1993; Burkhart and Lewis-Beck 1994; Barro 1997; Vanhanen 1997; Gasiorowski and Power 1998), while oth- ers argue that “effective democracy” promotes political stability, provides better economic policies and thus improves life quality and as a consequence also socioeconomic develop- ment (Ersson and Lane 1996; Rowen 1996; Leblang 1997; Yi Feng 1997; Frey and Al- Roumi 1999; Olson, Sarna, and Swamy 2000). Some observers postulate that socioeco- nomic development leads to cultural modernization (Inkeles and Smith 1974; Inkeles 1983;
Inglehart 1997; Inglehart and Baker 2000), but others hypothesize that cultural modernity accelerates socioeconomic development (Putnam 1993; Fukuyama 1995; Knack and Keefer 1997; Landes 1998). And while some analysts suggest that “effective democracy”
favors the emergence of modern pro-democratic cultures (Rustow 1970; Muller and Seligson 1994; Jackman and Miller 1998), others argue the opposite flow of causation:
cultural modernization puts political regimes under popular pressure to improve or sustain their democratic performance (Almond and Verba 1963; Inglehart 1997).
To summarize these contradictions we cite Dahl (1997: 35) who notes that “the exact nature of the relationship among socioeconomic modernization [‘development’ in our
words], democratization, and the creation of a democratic culture [or ‘modern culture’] is almost as puzzling today as it was a quarter-century ago.”
The source of this puzzle is that no one, as far as we know, starts with the fundamental question: what is the common denominator in which socioeconomic development, cultural modernization, and democracy converge? This question is posed vigorously by the striking coincidence of these three processes. We start from this question and elaborate on the syn- drome as such before we dissolve the whole complex into separate relations. Specifying the principle that unifies socioeconomic development, cultural modernization and democratic regime performance has important implications. It lets us better understand which specific part the three subprocesses play within the whole theme; and this in turn sheds more light on the logical connections between these subprocesses.
We unfold a concept based on the principle of “human choice.” This principle is implicit in modernization theory (Lewis 1955: 9-19), but its capacity to integrate related changes in socioeconomic structure, political culture and regime institutions has not yet been fully exploited. The following section introduces the concept of Human Development as an integrating framework. Anand (1993), Sen (2000) and Anand and Sen (2000) have brought the term Human Development to prominence. They have established the notion that
“human choice,” or the capability of human beings to choose the live they want, should be used as the ultimate norm to judge the benefits and problems of social change. Norma- tively, this is consistent with the anthropological view that “self-actualization” is the lead- ing end in human motivation (Maslow 1970) and with the notion that the “liberation of life,” or the gain of options, represents a guiding principle in biological and social evolu- tion (Birch and Cobb 1981). We agree that Human Development is a normatively prefer- able concept. But we unfold this concept more systematically. We specify its distinct com- ponents and their logical relationships more precisely in a way that is empirically useful to analyze social change across nations and cultural zones. And we use this framework to examine data from the World Values Surveys together with socioeconomic data from Vanhanen (1997) and scores for civil liberties and political rights from Freedom House.
Subsequent sections demonstrate (1) that the syndrome of Human Development is present at the individual, cross-national and cross-cultural levels; (2) that this syndrome is endoge- nously shaped by a process in which socioeconomic development and cultural moderniza- tion lead regimes to improve their democratic performance; and (3) that elite integrity, or
“good governance,” is a strong exogenous determinant of the Human Development syn- drome as a whole.
1 Theory
1.1 The Three Components of Human Development
In contrast to more sophisticated conceptions of modernization, our proposition makes it easier to understand socioeconomic development, cultural modernization and democratic regime performance as distinct but interrelated facets of the same principle. We argue that socioeconomic development, cultural modernization, and democratic regime performance work together in promoting individual choice.
Socioeconomic development expands individual choice in two ways. It gives people more autonomy over their resources in that it substitutes horizontal market relations for parochial clientelistic ties. Moreover, socioeconomic development gives people more physical and cognitive resources by improving basic life conditions as well as incomes, skills and information facilities. Socioeconomic development provides the objective means that enable people to pursue self-determination. This view is as old as Aristotle and has been continued from Marx to Lewis (1955) and Sen (2000). We conclude that socioeco- nomic development contributes autonomy resources to individual choice. And we label the process which makes socioeconomic development relevant to individual choice as resource allocation.
Cultural modernization is the second subprocess which is relevant to individual choice.
Cultural modernization mobilizes human motivations to higher levels of ambitions. It leads people to place increasingly high priority on individual choice. Cultural modernization contributes liberty aspirations to individual choice. This is consistent with the notion that individual choice is not only a matter of one’s means but also of one’s mind (cf. Rokeach 1960). What makes cultural modernization relevant to individual choice is aspiration mobilization.
Democracy is the third element of individual choice, providing an institutional structure that codifies civil and political freedom. Improving a political regime’s democratic per- formance contributes freedom opportunities to individual choice. This notion, too, goes far back to Mill and Dewey who saw opportunities for “individual self-development”
(Macpherson 1977: 44-76) as an inherent value of democracy. Democratization is relevant to individual choice through opportunity codification.
Autonomy resources, liberty aspirations and freedom opportunities are the three compo- nents of Human Development. And resource allocation, aspiration mobilization and opportunity codification are the three subprocesses through which these components emerge. In the Human Development perspective, resource allocation, aspiration mobiliza- tion and opportunity codification are the functional equivalents of socioeconomic devel-
opment, cultural modernization and democratization, respectively. Table 1 gives a summa- rizing picture of our conception and terminology.
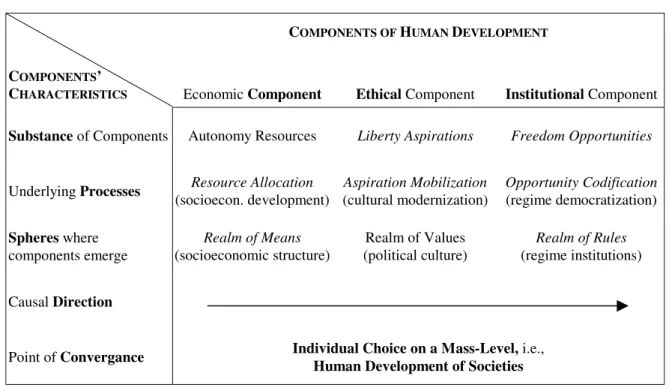
Table 1: The Concept of Human Development
COMPONENTS OF HUMAN DEVELOPMENT
COMPONENTS’
CHARACTERISTICS Economic Component Ethical Component Institutional Component
Substance of Components Autonomy Resources Liberty Aspirations Freedom Opportunities
Underlying Processes Resource Allocation (socioecon. development)
Aspiration Mobilization (cultural modernization)
Opportunity Codification (regime democratization) Spheres where
components emerge
Realm of Means (socioeconomic structure)
Realm of Values (political culture)
Realm of Rules (regime institutions)
Causal Direction
Point of Convergance Individual Choice on a Mass-Level, i.e., Human Development of Societies
The three components and subprocesses of Human Development coincide in their focus on individual choice. Progress in any of these aspects widens the human leverage in societies, giving people larger resources, stronger aspirations and wider opportunities to make use of their individual talents. Human Development of societies means growing individual choice on a mass level.
Human Development is not a teleological concept. It does not imply that its three sub- processes necessarily proceed in a linear upwards direction. Human Development only implies that resource allocation, aspiration mobilization, and opportunity codification show a strong tendency for coincidence. This tendency can move either in a regressive or progressive direction. There is no iron law of linear progress but rather a probabilistic ten- dency for coincidence to either narrow or widen the range of human choice within socie- ties.
The concept of Human Development goes beyond standard modernization theory in being both more comprehensive and more specific. Usually, theories cannot maximize comprehensiveness and specificness at the same time, but the concept of Human Develop- ment does. On one hand, it is comprehensive in that it integrates major changes in socio- economic structure, political culture, and regime institutions. On the other hand, this con-
cept is specific because it concentrates on one theme: the expansion or recession of human choice.
1.2 The Two Linkages of Human Development
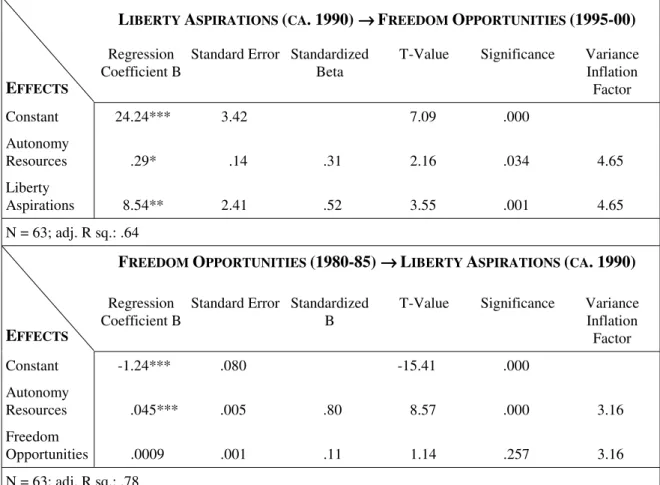
Individual choice is the common principle which integrates the three components of Human Development. Since choice refers to individuals, the linkages between these com- ponents should be deduced from patterns of individual behavior and additional assumptions how these patterns translate from the individual to the societal level. Basic behavioral assumptions suggest that the Human Development syndrome is shaped by two linkages: (1) a resource-aspiration linkage in which aspirations adjust to given resources;
and (2) an aspiration-opportunity linkage in which opportunities get suited to prevailing aspirations. We outline briefly why these are the most logical linkages.
The Resource-Aspiration Linkage: If avoiding the psychological costs of frustration is a rational human behavior, then it is irrational for people to evolve aspirations for goals that are beyond the reach of their means or resources. When this happens, it is a rare aberration from a behavioral pattern that is known in social psychology as “aspiration adjustment”
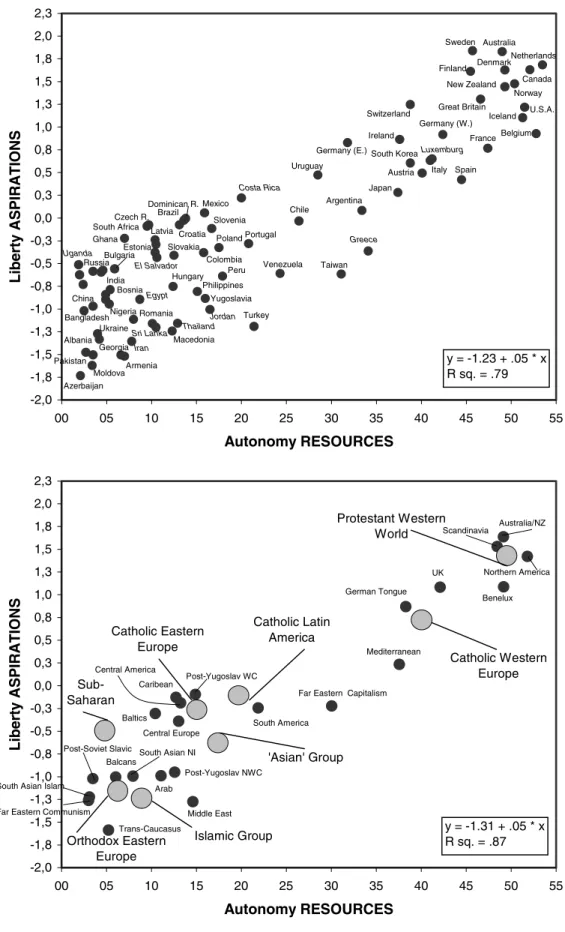
(Costa, McCrae, and Zonderman 1987; Cummins 1995; Eckersley 2000). Studies conducted in countries with very different cultural backgrounds, ranging from the U.S., to Mexico, Nigeria, and China, have found that individuals in less secure economic positions and with lower education, show relatively weak aspirations for political participation (Inkeles and Smith 1975; Verba, Nie, and Kim 1978; Barnes, Kaase, et al. 1979; Dalton 1996). Effective participation is beyond these peoples’ resources. Conversely, more ambitious aspirations, such as those reflected in postmaterialism, have been shown to be most prevalent among people with a relatively secure economic status and higher education (Brint 1984; Scarbrough 1995). We will show that liberty aspirations, which include postmaterialism, also tend to be more prevalent among people with more autonomy resources. This reflects a basic mechanism due to which people adjust their aspirations to their resources. Growing autonomy resources therefore give rise to stronger liberty aspirations.
The Aspiration-Opportunity Linkage: Mass aspirations that prevail within a community contain which opportunities are demanded by that community. Hence, aspirations put adjustment pressure on opportunities. On the other hand, opportunities cannot create corre- sponding aspirations, unless the resources that support these aspirations are present. For example, consider India: though offering its citizens relatively wide freedom opportunities during 50 years of democracy, Indian society did not evolve correspondingly strong liberty
aspirations (see India’s location on Figure 1). Conversely, former Czechoslovakia provided its citizens narrow freedom opportunities during four decades of communist rule, but the Czechs (and to a lesser degree also the Slovaks) developed much stronger liberty aspira- tions than most of the Indians did—in keeping with their larger autonomy resources that derived from a higher level of socioeconomic development (see Figure 1). This does not mean that freedom opportunities cannot exist without corresponding liberty aspirations.
Actually they can, as the Indian example shows. But if so, freedom opportunities are inef- fective (which explains why India is such an exceptional case). To be used effectively, freedom opportunities need corresponding liberty aspirations but cannot create them.
Liberty aspirations, on the other hand, are inherently directed towards freedom opportuni- ties. Hence, if adjustment pressure is at work, it works from liberty aspirations on freedom opportunities rather than the reverse.
1.3 The Dynamics of the Human Development Linkages
The resource-aspiration linkage and the aspiration-opportunity linkage are shaped in differ- ent ways. Resource allocation and aspiration mobilization are processes that originate at the individual level and translate to the societal level through mass-accumulation. Thus, autonomy resources and liberty aspirations are connected through a co-evolutionary link.
This makes large discrepancies between societies’ autonomy resources and liberty aspira- tions unlikely.
By contrast, freedom opportunities do not evolve from the individual level. Freedom opportunities are codified at the societal level. Elites can codify or nullify freedom oppor- tunities almost over night, as it happens when autocracies are turned into democracies, or the reverse. Hence, there is no such co-evolutionary link between aspiration mobilization and opportunity codification. Large discrepancies between societies’ liberty aspirations and freedom opportunities can therefore occur. Publics may develop strong liberty aspira- tions, but authoritarian elites can suppress them.
In the long run, however, rising liberty aspirations make “aspiration suppression”
increasingly costly, especially when these aspirations are nourished by corresponding autonomy resources. Then it is more likely that liberty aspirations overcome—under addi- tional circumstances1—the mobilization hurdles, which are typical of authoritarian regimes, giving way to powerful movements for democracy. Conversely, “aspiration sup-
1 It is no room here to describe these ‘additional circumstances,’ but see Foweraker and Landman (1997:
chapter 8).
pression” is less costly, if liberty aspirations are too weak to mobilize large segments of the population. This may explain why, in 1989, Chinese elites calculated relatively low risks of crushing the encapsulated and largely student-based pro-democracy demonstrations on T’iananmen square, while East German as well as Czech elites calculated the risks of using troops against their country’s massive, nation-wide demonstrations as too high.
We conclude that autonomy resources and liberty aspirations tend to coincide at any given point in time, while liberty aspirations and freedom opportunities may show larger discrepancies in a cross-sectional snapshot. Nevertheless, even liberty aspirations and freedom opportunities should tend to coincide in the long run. This coincidence should become increasingly evident as we extend our perspective over time.
2 Methodology: The Logics of Aggregation and Mass-Accumulation
The theory of Human Development uses behavioral assumptions in its reasoning why link- ages at the societal level exist. Thus, it should be demonstrated that these assumptions hold at both the individual and societal levels. Moreover, if this is a general theory, it must hold across societies of different cultural zones. We test these requirements in a multi-level design that covers the individual, cross-national and cross-cultural levels. We analyze the extent to which the linkages of Human Development are present at each level of analysis.
The correlations which reflect the Human Development syndrome probably vary at dif- ferent levels of analysis. The strength of correlations usually increases, sometimes dramati- cally, as one moves to higher levels of aggregation. For example, Robinson (1950) found that the correlation between illiteracy and being a black American was .95 at the regional level but shrunk to .21 when disaggregated to the individual level. Scholars have some- times used this example to argue that aggregate level correlations are “spurious” if they greatly exceed the individual level correlation (cf. Przeworski and Teune 1970: 72).
However, what Robinson actually claimed, and proved mathematically, is that one can- not assume that an individual level correlation must have similar strength and direction to the aggregate level correlation. Scholars who make that assumption without testing it sta- tistically fall victim to an “ecological fallacy.” But whether an aggregate level correlation is an artifact, or reflects a real relationship, is another question that is unaffected by the prob- lem of cross-level variances.
There are basically two types of cross-level variances. One is that an effect operates in opposite directions at different levels of analysis. This is seen when a correlation changes its sign when considered at the aggregate level and the individual level. Though even this case does not invalidate the aggregate level correlation, it eliminates the applicability of a
general theory: mechanisms that work in opposite directions cannot be explained by the same theory. The second possibility is that a correlation does not change its sign but only its magnitude with different levels of analysis. Indeed, it is very usual that correlations in- crease with higher levels of aggregation. This, however, has little relevance to the applica- bility of a general theory. We briefly explain why.
A correlation between two variables must be stronger at the aggregate level, if the underlying process sweeps rather uniformly through entire populations but to degrees that vary largely between populations. Processes of this kind shift the mean-level of a popula- tion variable in a way that may have relatively little impact on the within-population vari- ance. But if such mean-level shifts occur to different degrees between populations, they increase the between-population variance. For instance, 200 years ago the income ratio of the richest to the poorest nations was approximately 5:1. But uneven economic growth has dramatically risen this ratio up to 400:1, while within nations, regional income differences rarely exceed ratios of 5:1 (Landes 1998: xx). Hence, economic growth, or resource allo- cation in general, sweeps relatively uniformly through nations, while it creates much greater differences between them. As a consequence, any effect connected to resource allo- cation, such as aspiration mobilization, must be more pronounced between than within nations.
Social change creates larger variances and covariances between than within nations. This reflects that nations have some homogenizing effect on the citizens that are socialized within them. Population variables show intra-national homogeneity to the degree that indi- viduals are clustered around the national mean. If this is so for a pair of related variables x and y, large parts of a population are bound within a range where x may have no effect on y, which necessarily results in a weak or insignificant individual level correlation within nations.2
The second reason why aggregate level correlations tend to be stronger than those at the individual level is that survey data contain a large component of measurement error: many respondents give erratic answers that reflect “non-attitudes,” producing much random noise in representative survey data (Converse 1970). As Yule and Kendall (1950) and Blalock (1961) pointed out, the variation of a variable consists of a systematic and a random ele- ment. Hence, the correlation between two variables x and y, too, consists of a systematic term and a random term which diminishes the systematic correlation (“attenuation effect”).
But when x and y are averaged across social units, the random elements counterweigh each other: negative and positive deviations from the mean, which are random, cancel each other
2 If the variance/covariance of two variables is larger between than within nations, the correlation is stronger and more significant at the pooled individual level across nations than at the individual level within nations. An example is mentioned in fn. 6.
out (Page and Shapiro 1993: 40). Following the law of large numbers, this “reduction of error” becomes more pronounced as the number of individuals being aggregated rises.
Consequently, the random term becomes smaller, and the systematic correlation larger, with higher levels of aggregation. When this is the case, aggregation does not obscure but reveals the “real” correlation.
It is at the heart of aggregation—and of mass accumulation as a “real” process—that irregularities of millions of individuals are bound within the regularities of the social units in which these individuals are socialized (Converse 1970, Page and Shapiro 1993: 39-41).
The creation of regularity is the very principle of the socialization process. Regular rela- tionships therefore become more visible when whole units of socialization are compared.
A deeper insight into the problem can be provided by multi-level regression analysis, which indicates level-specific relations when intercepts or slopes vary for the level of analysis. Our analyses will test whether the Human Development linkages show varying intercepts or slopes at the individual, cross-national and cross-cultural levels.
3 Analyses
3.1 Data Sources and Variables
In order to test the theory of Human Development we need representative survey data, which measure liberty aspirations for as many countries as possible. We will use the larg- est available database, the World Values Surveys (WVS), which cover 63 countries repre- senting almost 80 per cent of the world’s population.
Table 2 gives an overview of how we measured the components of Human Development at different levels (description of scale construction and data sources are in the footnotes of this table). The resource-component is measured by individuals’ financial income (material resources), education attainment level (cognitive resources), and the interaction of both (mat-cog resources). Since incomes are measured in national currency deciles and since education levels are not equivalent between nations, it makes no sense to use these vari- ables in cross-national comparisons. We use them only for analyses at the individual level within nations. At the aggregate level, we measure resources by a composite index (auton- omy resources) which is taken from Vanhanen (1997) and which combines measures for the nations’ distribution of material resources, cognitive resources, and social diversifica- tion. We use Vanhanen’s most recent measure of this index, which captures the early
1990s.3 This measure shows such a strong intertemporal correlation that it reflects long- term differences in nations’ resource allocation.4
Table 2: Variables Measuring Human Development
COMPONENTS OF HUMAN DEVELOPMENT
LEVELS
OF ANALYSIS Resources Aspirations Opportunities
Individual Level – Material Resources1 – Cognitive Resources2 – Mat-Cog Resources3
– Liberty Aspirations5 – Support for Democracy6
Aggregate Levels – Autonomy Resources4 – Liberty Aspirations5 – Support for Democracy6 – Freedom Opportunities7 1 Individual financial income in national currency deciles from V227 WVS.
2 Education level attained on 10-categorical ordinal scale from V217 WVS.
3 Interaction (product score) of income (v227) and education (V217) from WVS.
4 Vanhanen-index of economic resources. Subindex of material resource distribution generated from share of family farms in the agricultural sector (weighted for the agricultural sector’s share in GDP) and the deconcentration of non- agricultural resources (measured by 100 minus the share in GDP generated by the state, foreign enterprises and large national trusts). Subindex of cognitive resource distribution is measured by the number of students per 100,000 inhabitants and the literacy rate. Subindex of occupational diversification produced from the proportion of the urban population and the percentage of the non-agricultural work force. All three subindices multiplied and standardized to 100 as the maximum. For a detailed description of scale construction and data sources, see Vanhanen (1997: 42-63).
5 Factor scores for the modern libertarian value dimension which summarizes postmaterialism, tolerance toward homosexuals, signing petitions, generalized trust, and life satisfaction (all from WVS; see Table 4 for a description).
6 Index developed by Klingemann (1999) from WVS. 4-point scale (1: very bad, 2: fairly bad, 3: fairly good, 4: very good) for “Having a democratic system” (V157) and 4-point scale (1: strongly disagree, 2: disagree, 3: agree, 4:
strongly agree) for “Democracy may have problems but it’s better than any other form of government” (V163) added to a 7-point index of prodemocratic orientation. Similarly, 4-point scales for “Having a strong leader” (V154) and
“Having the army rule” (V156) added to a 7-point index of antidemocratic orientation. Then the index of anti- democratic orientation is subtracted from that for the prodemocratic orientation to create the scale of support of democracy ranging from -7 to +7.
7 Multiplied scores for civil liberties and political rights from Freedom House (ed.), Freedom in the World. Data can be downloaded from the web page: “http:\\www.freedomhouse.org.”
The aspiration-component of Human Development is measured by a scale of factor scores summarizing several indicators of liberty aspirations. Most of these measures are taken from the 1990-WVS (N = 42). Where these measures were not available, those from the
3 Vanhanen’s measure does not only capture levels but also distributions of resources. The distributional perspective is inherent in democratic theory from Aristotle to Dahl (1973: chapter 4). Thus, it is no surprise that Vanhanen’s measure is closer correlated with our measures of liberty aspirations (r = .88) and freedom opportunities (.84) than is per capita GDP (.80 and .82, respectively). Vanhanen’s measure outperforms also the Human Development Index (.70, .78) which captures basic quality of life issues, like health, education and income. This is also not surprising, since societies are at variance in these issues when they move from an income level of ca. 1,000 to about 5,000 US-$ per capita. Below and above that range, there is little variance in quality of life issues (Hughes 1999: 98).
4 The correlation with the same measure from 1988 is r = .96 (N = 145) and r = .90 (N = 117) for 1970-79.
1995-98-WVS were used (N = 21). Much like autonomy resources, liberty aspirations reflect long-term differences between nations, which allows us to substitute the 1995-98 measures for the 1990-measures when the latter are missing.5
The opportunity-component of Human Development (freedom opportunities) is meas- ured by the product of the scores for “civil liberties” and “political rights” published annu- ally by Freedom House. To correct short-term fluctuations and measurement errors, we averaged these scores over the period 1989-2000. Freedom opportunities are codified at the societal level and have therefore no direct equivalent at the individual level. But something related to freedom opportunities at the individual level is peoples’ support for democracy:
the more individuals support democracy and the more intensively they do, the stronger is the public pressure to sustain or establish freedom opportunities. Increasing support for democracy should be the mechanism through which the effect of liberty aspirations on freedom opportunities operates. To capture this mechanism we use a scale of support for democracy developed by Klingemann (1999). This continuous scale is constructed in a way that avoids capturing only lip service to democracy.
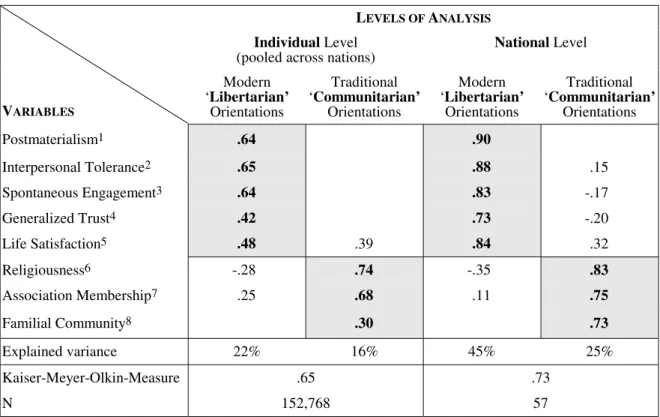
Table 3 displays the results of the factor analyses that generate scores indicating the strength of liberty aspirations. Using indicators analyzed by Inglehart and Baker (2000), we were searching for a relatively parsimonious solution that is robust at both the individ- ual and the cross-national level; that provides a maximum “nomological validity” in pre- dicting freedom opportunities; and that produces an intuitively understandable dimensional structure, in keeping with prevailing theories of value change.
The solution we found is one in which postmaterialist preferences for self-expression, interpersonal tolerance, spontaneous engagement, generalized trust and life satisfaction all tap the dimension of modern ‘libertarian’ orientations—as opposed to traditional ‘com- munitarian’ orientations which comprise religiousness, association membership and an emphasis on the familial community. Modern ‘libertarian’ orientations are “modern”
because they increase with socioeconomic modernization.6 And they are “libertarian”
because they value the autonomy of the individual more highly than the authority of the community. Traditional ‘communitarian’ orientations are “traditional” in that they prevail in economically less advanced societies. And they are “communitarian” in that they emphasize community authority more strongly than individual autonomy. Not surprisingly, modern ‘libertarian’ and traditional ‘communitarian’ orientations are not perfectly inde- pendent from each other: religiousness is negatively associated with modern ‘libertarian’
orientations, as are spontaneous engagement and generalized trust with traditional ‘com- munitarian’ orientations. This implies that the rise of modern ‘libertarian’ orientations is
5 For 28 cases both measures are available. The intertemporal correlation amounts to r = .94.
6 This is shown by Inglehart and Baker (2000) and can be seen in Figure 1 here.
linked with a decline in traditional ‘communitarian’ orientations, which is logical since individual autonomy and community authority cannot be maximized at the same time. We measure liberty aspirations using factor scores summarizing the dimension of modern ‘lib- ertarian’ orientations.7
3.2 Data Imputation
In addition to the empirical data that we have, we impute missing data on liberty aspira- tions for another 17 nations. Data imputation is a strongly recommended procedure when missing data are not random (King, Tomz, and Wittenberg 2000). The missing data clearly are not random in the WVS, which over-represent European and American countries, and under-represent Islamic and Sub-Saharan ones—although we have empirical data for Ghana, Nigeria, and South Africa from the Sub-Saharan region; and for Azerbaijan, Bang- ladesh, Turkey, and Pakistan from the Islamic zone. These data provide a basis for imput- ing missing data on liberty aspirations for other countries in these regions.
The conditions for data imputation are favorable in this case, because the relationships in which we are interested show a strong “predictive validity” (Zeller and Carmines 1980). If we know the religious makeup of each society and its level of autonomy resources, we can explain fully 90 percent of the cross-national variance in the strength of liberty aspira- tions.8 The fact that liberty aspirations can be predicted with a very minor error is impor- tant. It implies that data imputation does not influence the effect of liberty aspirations on freedom opportunities. The residuals that we obtain by predicting liberty aspirations from autonomy resources are clearly within the range where liberty aspirations have no effect on freedom opportunities.9
7 Factor solutions normally are more strongly structured on the cross-national level than on the pooled individual level because individual level measurement error gets averaged out through aggregation.
Postmaterialism, spontaneous engagement and interpersonal tolerance load on the modern ‘libertarian’
dimension in 76 of 92 national surveys (83%), but generalized trust and life satisfaction are less likely to do so. Nevertheless, on the pooled individual level all of these attitudes are clearly linked with this dimension. This reflects that important features of a dimension may manifest themselves only when the between-nation variation is included—which is the case when one works with pooled individual data.
8 The equation is: LIBERTY ASPIRATIONS = -1.00 + .04*AUTONOMY RESOURCES + .007*PROTESTANTS - .009*ORTHODOX CHRISTIANS – .007*MUSLIMS – .06*CONFUCIANS + .005*NONRELIGIOUS PEOPLE + .25*EX-BRITISH. This equation results in an .90 adjusted R squared for 57 cases. Proportion of Buddhists, Catholics, Hindus and Animists and dummy for postcommunism excluded by backward deletion.
Proportions of religious groups are taken from the country reports in Britannica Book of the Year 2000.
9 The range corresponds to the distance between Moldova and Mexico in Figure 2, a distance of 1.3 points on the -2 to +2.3 factor scale for liberty aspirations. The error in predicting liberty aspirations is clearly within this range: the largest residual we found is .49 in case of Turkey. This is only one third of the 1.3 points that must be exceeded, if prediction error should distort the effect of liberty aspirations on freedom opportunities.
Table 3: The Value-Dimension of Liberty Aspirations
LEVELS OF ANALYSIS Individual Level
(pooled across nations)
National Level
VARIABLES
Modern
‘Libertarian’
Orientations
Traditional
‘Communitarian’
Orientations
Modern
‘Libertarian’
Orientations
Traditional
‘Communitarian’
Orientations
Postmaterialism1 .64 .90
Interpersonal Tolerance2 .65 .88 .15
Spontaneous Engagement3 .64 .83 -.17
Generalized Trust4 .42 .73 -.20
Life Satisfaction5 .48 .39 .84 .32
Religiousness6 -.28 .74 -.35 .83
Association Membership7 .25 .68 .11 .75
Familial Community8 .30 .73
Explained variance 22% 16% 45% 25%
Kaiser-Meyer-Olkin-Measure .65 .73
N 152,768 57
Notes: Entries are factor loadings. Explorative principal components analysis (extraction of factors with Eigenvalues above 1 advised), no rotation. Factor loadings below .10 suppressed.
1 Respondents’ priorities for “giving people more say in important government decisions,” “protecting freedom of speech,” (V106-107) and “seeing that people have more say about how things are done at their jobs and in their communities” (V104-105) added to a six-point index, assigning 2 points for first priority, 1 point for second priority and 0 points for no priority on each of these items.
2 “Not mentioned” for “disliked neighbors” dichotomized as 1 against 0; scores added for neighbors with AIDS (V58) and homosexual neighbors (V60).
3 “Already done” for “signing petitions” (V118) coded “1” and dichotomized against “0.”
4 Respondents believing “most people can be trusted” (V27) dichotomized as “1” against “0.”
5 10-point rating scale for life satisfaction from WVS (V65).
6 “How important is God in your life?” (V190). 10-point scale (1: not at all, 10: very important).
7 “Active membership” dichotomized as “1” against “0” and added for “Religious Organizations” (V28) and
“Charitable Organizations” (V35).
8 “Importance of family” (V4), “very important” dichotomized as “1” against “0.”
Liberty aspirations are so strongly determined by autonomy resources and religious tra- dition that we could make reasonable predictions for any country in the world. But we do not intend to present a simulation study. We want to present an empirical study that is pri- marily based on real data, supplemented by some predictions for selected countries from underrepresented regions. We selected 17 countries that will be covered by the next wave of the WVS: Luxemburg, Greece, Egypt, Jordan, Iran, Cameroon, Tanzania, Uganda, Zim- babwe, Indonesia, Sri Lanka, Thailand, Vietnam, Costa Rica, Cuba, El Salvador. This offers a chance to test the validity of our analyses in the near future.
For methodological reasons, one should use data imputation if missing data are not ran- dom and if there are strong empirical relations in the real data from which reasonable pre- dictions can be derived. Both preconditions are satisfied in case of the WVS: countries from certain cultural zones are underrepresented; and there is an extraordinarily strong relationship between autonomy resources and liberty aspirations. Nonetheless, we remain cautious in imputing missing data for liberty aspirations. Cases with imputed data repre- sent only one fifth of our sample, and we down-weight these cases by 20 per cent whenever used in subsequent analyses (which is double the prediction error of 10%). We have checked whether the inclusion of imputed data does any change to our statistical results.
We have found that it does not. Nevertheless, the inclusion of these data provides a more complete picture of the world. So we report the results with imputed data included—except where the effect of autonomy resources on liberty aspirations is estimated. To avoid tau- tological results, these estimations do not include imputed cases (inclusion/exclusion of imputed cases is noted in the tables).
3.3 Operationalizing Cultural Zones
Weber (1958), Eisenstadt (1986), Huntington (1996) and many others emphasized that nations cluster into larger units labeled “country families,” “cultural zones,” or “civiliza- tions.” Nations belonging to a common cultural zone tend to share similar worldviews, institutional traditions and patterns of economic subsistence. Three variables determine these cultural zones: religion, region, and imperial legacy.
Since Weber, it has been widely accepted that societies’ religious traditions are prime carriers of popular belief systems. Such belief systems influence which economic activities are preferred and which political institutions are supported by the population. Regional proximity is a second factor. It facilitates the diffusion of ideologies, economic habits and institutions across nations (Kopstein and Reilly 2000). A third relevant factor is imperial legacy. There is evidence that a British colonial heritage is conducive to libertarian values and institutions, while communist rule contributed to an egalitarian and secular worldview (cf. Lipset, Seong, and Torres 1993).
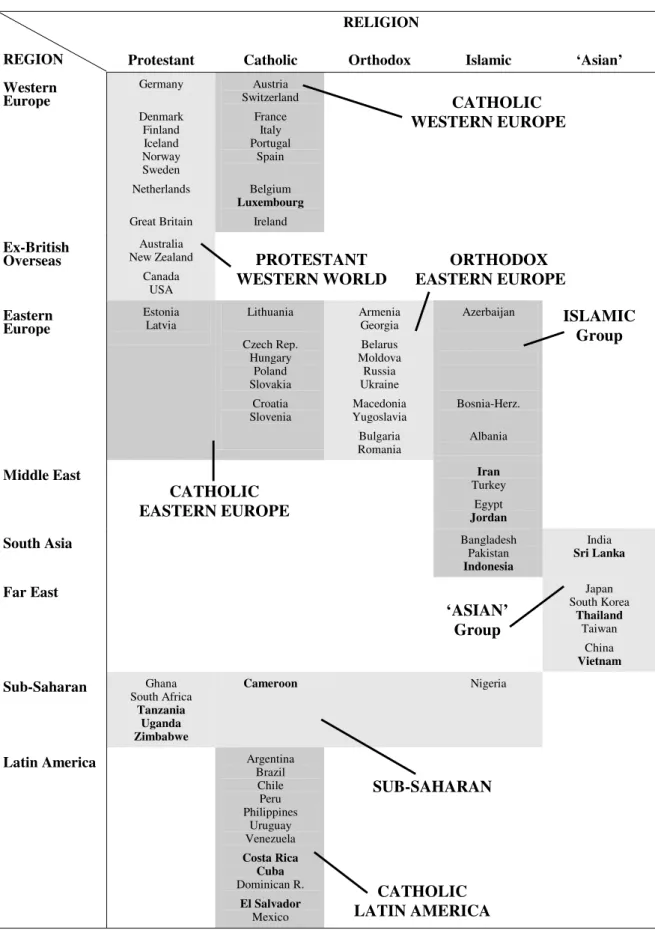
Table 4 shows how we grouped the WVS-nations to cultural zones (nations with imputed data for liberty aspirations appear in bold letters). The first criterion is religious tradition, which we differentiated in a way that produces at least 8 cases in each category.
Thus, we have 20 countries with a historically Protestant tradition or with Protestants as the largest religious group among their populations; 29 Catholic countries; 10 Christian Ortho- dox countries; 11 Islamic countries; and a residual category of 8 “Asian” countries, most of
Table 4: The Location of the WVS-Nations within Cultural Zones
RELIGION
REGION Protestant Catholic Orthodox Islamic ‘Asian’
Western Europe
Germany
Denmark Finland Iceland Norway Sweden Netherlands
Great Britain
Austria Switzerland
France Italy Portugal
Spain
Belgium Luxembourg
Ireland
Ex-British Overseas
Australia New Zealand
Canada USA
Eastern Europe
Estonia Latvia
Lithuania
Czech Rep.
Hungary Poland Slovakia
Croatia Slovenia
Armenia Georgia Belarus Moldova Russia Ukraine Macedonia Yugoslavia Bulgaria Romania
Azerbaijan
Bosnia-Herz.
Albania
Middle East Iran
Turkey Egypt Jordan
South Asia Bangladesh
Pakistan Indonesia
India Sri Lanka
Far East Japan
South Korea Thailand
Taiwan China Vietnam Sub-Saharan Ghana
South Africa Tanzania
Uganda Zimbabwe
Cameroon Nigeria
Latin America Argentina
Brazil Chile Peru Philippines
Uruguay Venezuela Costa Rica
Cuba Dominican R.
El Salvador Mexico
SUB-SAHARAN
CATHOLIC LATIN AMERICA
‘ASIAN’
Group
ISLAMIC Group
CATHOLIC EASTERN EUROPE
PROTESTANT WESTERN WORLD
ORTHODOX EASTERN EUROPE
CATHOLIC WESTERN EUROPE
them representing a distinctive religious or ethical tradition (India: Hinduism; Japan:
Shintoism; China, Taiwan and Vietnam: Confucianism; South Korea: Buddhism; Sri Lanka, Thailand: Hinayana Buddhism).
These five religious groups were subdivided for region, if such division produced at least 8 cases in each category. Thus, the Islamic and the ‘Asian’ group were not divided. More- over, Estonia and Latvia, though having a Protestant tradition, were grouped with the Catholic Eastern European countries, with which they share the tradition of “Western Christianity” as opposed to Orthodox Eastern Christendom (Huntington 1996: 159).
Finally, the Sub-Saharan countries have not been divided on the basis of religions, since the Christian and Islamic imprints that prevail in contemporary Africa have only in the colonial era been superimposed on indigenous animist traditions. The animist tradition and regional proximity justify classifying the Sub-Saharan countries as a group of their own.
These cultural zones include some important aspects of nations’ imperial legacy. The division between Western and Eastern Europe does not follow a merely regional criterion but reflects the differentiation between postcommunist and non-postcommunist Europe.
Similarly, Canada, the U.S., Australia and New Zealand are viewed as one cultural zone under the label “Ex-British Overseas,” though geographically they are scattered around the world. This reflects their common heritage as English-speaking former British colonies of
“white” settlers, many of whom have been religious dissidents.
This classification may seem crude, especially in view of the heterogeneous ‘Asian’
group. Yet, these 8 cultural zones capture 82%, 83% and 75% of the variance in autonomy resources, liberty aspirations and freedom opportunities across 80 nations. Thus, even this crude classification captures relatively homogeneous zones.10
In addition to this continental differentiation of cultural zones, we use a more fine-tuned classification based on 23 sub-continental regions, such as Scandinavia, the Baltics, Trans- caucasia, Mediterranean Europe, the Caribbean and so forth (see Appendix for this classifi- cation). The sub-continental classification captures 91%, 88%, and 85% of the cross- national variance in autonomy resources, liberty aspirations and freedom opportunities.
Though this classification is almost three times as differentiated as the continental one (having 23 instead of 8 categories), it explains only 5 to 9 per cent more of the cross- national variance. This finding confirms the adequacy of the cultural zones in Table 4.
10 We tested the robustness of these cultural zones by a discriminant analysis, using continuous variables for the proportions of Protestants, Catholics, Orthodox Christians, Muslims, Hindus, Buddhists, Confucianists, Shintoists, Animists and non-religious people; continuous variables for geographical location in the North-South and the East-West dimension (geographical longitude and latitude of the countries’ capitals); as well as dummies for postcommunism and former British colonial status. This discriminant analysis did not arrange the countries of the ‘Asian’ group into different cultural zones.
Although the countries of the ‘Asian’ group are heterogeneous, they are more similar to each other than to any other group.
3.4 The Human Development Linkages in the Multi-Level Perspective
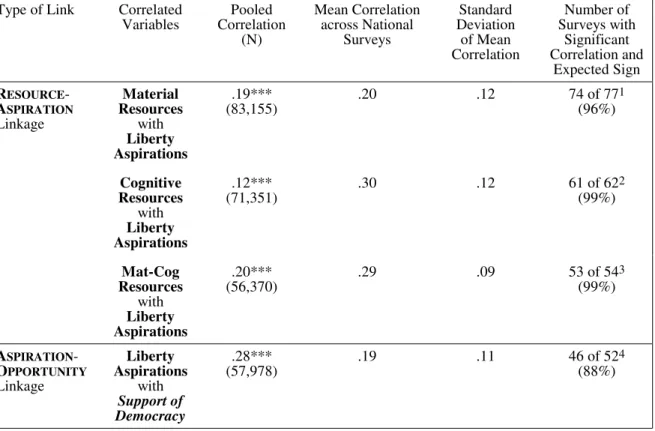
Table 5 demonstrates that the linkages of Human Development are present at the individual level. In 96 per cent of the surveys—including such diverse countries as China, Russia, Japan, Turkey, Argentina or Sweden—people with more material and cognitive resources show significantly stronger liberty aspirations. Similarly, people with stronger liberty aspi- rations show significantly stronger support for democracy in 88 per cent of the surveys.
There is considerable cross-national variation in the magnitude of these correlations but less so in their direction and significance. Considering the measurement error that is usu- ally present at the individual level, the correlations are reasonably strong, virtually always in the expected direction and significant in 88 to 98 per cent of the surveys.
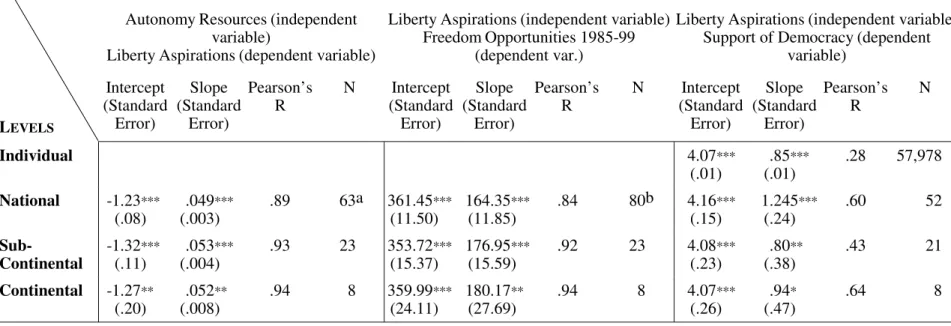
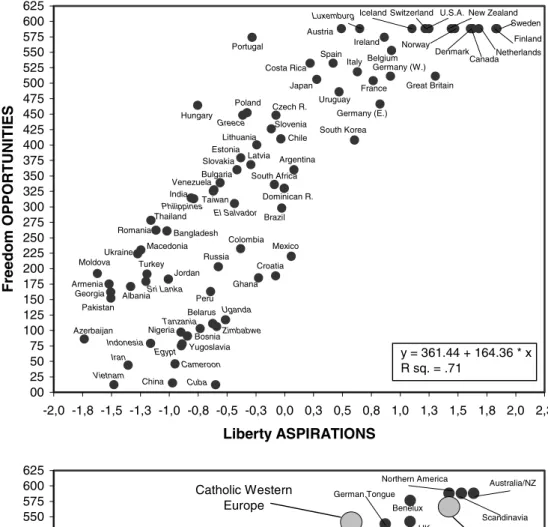
Table 6 shows with impressive clarity that the Human Development linkages do not sub- stantially vary in either their intercepts or slopes for different levels of analysis. Whether at the individual-, national, sub-continental or continental level, intercepts and slopes remain almost constant. Figures 1 and 2 give an intuitively clearer picture of this finding. The upper plots show the linkages across nations, the lower plots across sub-continental and continental zones. In every case, the regression equations are almost identical.
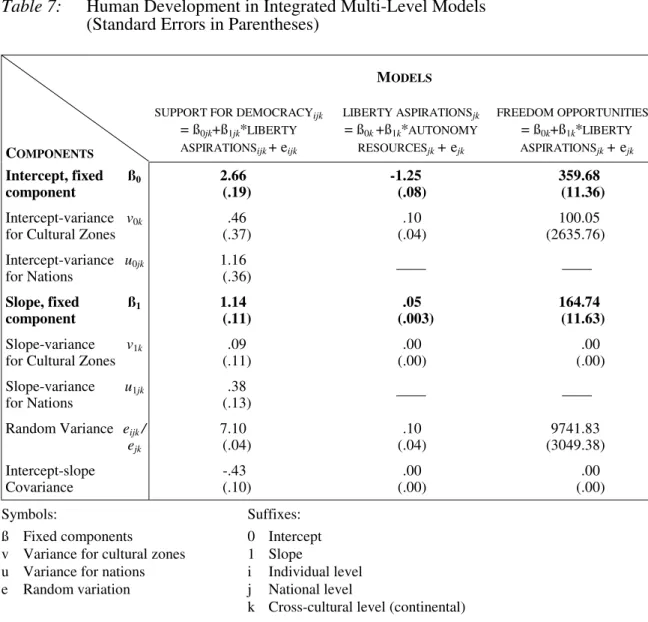
A more integrated way to express these findings is to specify multi-level models in which we estimate overall intercepts and slopes that are constant across contextual units, together with the intercept- and slope-variation for contextual units. In this way we formulate the relation between liberty aspirations and support for democracy by a three- level model. The levels of variation are indicated with suffix “i” for the individual level, suffix “j” for the national level and suffix “k” for the cross-cultural level. The “random slopes and intercepts model” is written as follows:
SUPPORT FOR DEMOCRACYijk = ß0jk + ß1jk*LIBERTY ASPIRATIONSijk+ eijk
We can express the composition of intercept and slope as follows:
Intercept: ß0jk = ß0 + v0k + u0jk
Slope: ß1jk = ß1 + v1k + u1jk
Intercept and slope are each composed of a fixed part, which is constant across different contexts (ß0, ß1) and two variable parts, which differ for nations (u0jk, u1jk) and for conti- nental zones (v0k, v1k). In addition, there is an error term for individuals’ remaining varia- tion in support for democracy (eijk). This random variation can neither be attributed to the overall effects of liberty aspirations (ß0, ß1) nor to their contextual variation (v0k, u0jk, v1k,
u1jk). Estimating this model for 56,613 individuals within 53 nations within 8 continental zones provides the results in Table 7.11
Table 5: The Linkages of Human Development at the Individual Level (Pearson’s R’s)
Type of Link Correlated Variables
Pooled Correlation
(N)
Mean Correlation across National
Surveys
Standard Deviation
of Mean Correlation
Number of Surveys with
Significant Correlation and
Expected Sign Material
Resources with Liberty Aspirations
.19***
(83,155)
.20 .12 74 of 771
(96%)
Cognitive Resources
with Liberty Aspirations
.12***
(71,351)
.30 .12 61 of 622
(99%) RESOURCE-
ASPIRATION Linkage
Mat-Cog Resources
with Liberty Aspirations
.20***
(56,370)
.29 .09 53 of 543
(99%)
ASPIRATION- OPPORTUNITY Linkage
Liberty Aspirations
with Support of Democracy
.28***
(57,978)
.19 .11 46 of 524
(88%)
Significance Levels: * p ≤ .10; ** p ≤ .01; *** p ≤ .001.
In the following, Roman figures indicate the respective wave of the WVS: I (1981), II (1990-91), III (1995-98).
1 Following surveys show significant correlations with expected sign: France II; Great Britain II; Germany (West) II, III; Italy II; Netherlands II; Denmark II; Belgium II; Spain II, III; Ireland II; Northern Ireland II; USA II; Canada II;
Japan II; Mexico II; Hungary II; Australia III; Norway II, III; Sweden II, III; Tambov III; Argentina II, III; Finland II, III; Switzerland III; Puerto Rico III; Brazil II, III; Nigeria III; Chile II, III; Belarus II, III; India II, III; Germany (East) II, III; Slovenia II; Bulgaria II; Romania III; Taiwan III; Portugal III; Austria II; Turkey II, III; Moscow II;
Lithuania III; Latvia II, III; Estonia III; Ukraine III; Russia II, III; Peru III; Venezuela III; Uruguay III; Moldova III;
Georgia III; Armenia III; Azerbaijan III; Dominican Republic III; Bangladesh III; Basque III; Andalusia III; Galicia III; Valencia III; Serbia III; Montenegro III; Croatia III; Slovakia III; Bosnia III. Following surveys show either insignificant or negative correlations: Mexico III; South Africa III; Hungary III; Nigeria II; Ghana III.
2 Philippines III show an insignificant negative correlation.
3 Ghana III shows an insignificant .09 correlation.
4 Mexico III, India III, Venezuela III, Philippines III, Azerbaijan III, Bangladesh III show insignificant or negative correlations.
11 We used the MLWin-software developed by Goldstein et. al. (1998). This program runs an iterative generalized least squares procedure.