Working papers Arbeitspapiere
Kingdom and West Germany?
Patterns of Male Non-Agricultural Self-Employment
Henning Lohmann Silvia Luber
Walter Müller
Arbeitspapiere -
Mannheimer Zentrum für Europäische Sozialforschung Nr. 11, 1999
ISSN 1437-8574
Silvia Luber Walter Müller
Who is Self-Employed in France, the United Kingdom and West Germany?
Patterns of Male Non-Agricultural Self-Employment
Who is Self-Employed in France, the United Kingdom and West Germany?
Patterns of Non-Agricultural Self-Employment / Henning Lohmann; Silvia Luber;
Walter Müller – Mannheim, 1999
(Arbeitspapiere - Mannheimer Zentrum für Europäische Sozialforschung ; 11) ISSN 1437-8574
Cover layout: Uwe Freund Not available in book shops.
Token fee: DM 5,–
Purchase: Mannheimer Zentrum für Europäische Sozialforschung (MZES), D – 68131 Mannheim WWW: http://www.mzes.uni-mannheim.de
Editorial Note:
Henning Lohmann and Silvia Luber are research fellows at the Mannheim Centre for European Social Research in the project “Socio-economic Development of Self-Employment in Europe”. The project is funded by the Fritz-Thyssen-Stiftung and directed by Dr. Walter Müller, Professor of Sociology at the University of Mannheim and head of Research Department A of the Mannheim Centre.
This paper investigates the patterns of male non-agricultural self-employment and how they have changed over time in France, Germany and the UK. It is argued that the development of self- employment in the three countries is based on specific institutional frameworks resulting in different opportunities for the self-employed. Thus, we expect that the dynamics of growth, the sectors of activity and the socio-demographic characteristics of the self-employed differ between the countries.
The empirical analyses are based on the national Labour Force Surveys of 1984 and 1994 (Germany 1982 and 1995). Our findings indicate that educational requirements differ fundamentally between the three countries and along industrial branches. Further, we could observe some country-specific developments in some sectors of activity but also a remarkable number of common general patterns in the development of self-employment.
1 Introduction: The development of self-employment in the last two decades ... 1
2 Two general explanations for the rise of self-employment: structural changes in the economic environment and the unemployment-push ... 5
3 The institutional and legislative framework: Different situations for the self-employed in France, Germany and the United Kingdom ... 6
4 Characteristics of the self-employed and the job held ... 9
5 Data and main concepts ... 12
6 The determinants of self-employment in France, Germany and the United Kingdom ... 14
7 Conclusion ... 22
8 References ... 25
Appendix ... 29
1 Introduction: The development of self-employment in the last two decades
Since the 1980s a renewed rise in self-employed work has been observed in almost all European countries (OECD 1992; Luber, Gangl 1997; European Employment Observatory 1998). The self- employed still form an important element in the labour market and social structure of economically advanced countries like France, Germany1 and the United Kingdom.
But the course of this development is by no means uniform in the three countries. There are great differences in the scope and structure of self-employed work. The pace of this increase and the areas in which self-employment is on the rise also vary between the countries. One exception is an almost identical development in all countries in the agricultural sector (European Employment Observatory 1998). Self-employment in this sector continued to decrease since the 1960s in absolute terms in Germany and France while it remained at an already low level in the United Kingdom2. The self- employment rate remained almost unchanged as dependent employment decreased to an even higher extent. Therefore, we will restrict the following analyses to self-employment outside agriculture, as the main interesting developments in self-employment leading to differences in the three countries have taken place in the non-agricultural sectors.
Furthermore, as the development of female self-employment is of a particular nature we will further consider only the developments and determinants of male self-employment. The differences between male and female self-employment are enormous. As Bates (1995) summarises especially the educational level and the branches self-employed work in vary by gender: “In light of the different industry groups in which self-employed men and women concentrate, the self-employment entry process may vary substantially by gender. [...] Relative to men, women are relying much more heavily upon advanced education and work experience as their route to self-employment. Possession of graduate education, in contrast, is the only human capital variable strongly associated with self- employment entry [for males]” (Bates 1995: 154). Thus, in order not to diffuse our analyses by gender differences we restrict the analyses to male self-employed.
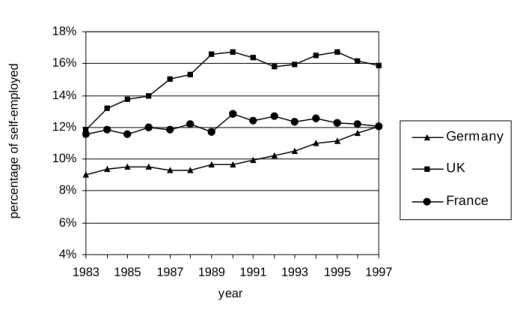
To provide a general picture of the development of male self-employment in the three countries, we use data from Labour Force Statistics published by Eurostat from 1983 – 1997. Figure 1 shows the
1 We will examine the self-employed for West Germany only since the development in the former GDR relies on special conditions which are subject to a lot of research and which we would not be able to consider in our analysis in depth. We use the simplification and refer to West Germany hereafter just as “Germany”.
2 In Germany the number of self-employed agricultural workers decreased from about 1 million at the beginning of the 1960s to 300,000 at the beginning of the 1990s while in the United Kingdom the already low level of agricultural self-employment has remained at about 300,000 workers since the 1960s. In France the respective numbers are about 3.2 million people working in the agricultural sector in 1960 (including unpaid family members) which decreased to 700,000 people in the 1990s (source: OECD 1996, own calculations).
male non-agricultural self-employment rate as percentage of total male employment in the three countries. It supplies evidence for a considerable variation in the individual countries.
Male self-employment in Germany and the United Kingdom shows a clear tendency to increase (see figure 1). Self-employment has grown considerably since the beginning of the 1980s in absolute and relative terms in the two countries. But there are also differences: In the United Kingdom a strong and sustained growth has taken place already at the beginning of the 1980s and has weakened since 1991. Germany shows a continuous and straight growth starting at the end of the 1980s and holding on in the 1990s. In contrast to this, in France almost no increase can be found.
Figure 1: Male non-agricultural self-employment rate 1983-1997
4%
6%
8%
10%
12%
14%
16%
18%
1983 1985 1987 1989 1991 1993 1995 1997 year
percentage of self-employed
Germany UK France
Source: Eurostat (1998): Labour Force Statistics 1983 - 1997
Male self-employment has increased in the UK from 11.9% in 1983 to 16.7% in 1990, after which the numbers stabilised with some fluctuations. In Germany the proportion of self-employed workers was just about 9.0% in 1983 and had grown to 12.1% in 1997. In France in 1983 11.6% of the male workforce were working on their own account and this share only grew up to 12.0% in 1997. The development in France is characterised by some fluctuations and just this small increase overall.
In addition, the nature of business the self-employed are engaged in differs between the countries.
The self-employment rates vary widely by economic sector. Table 1 shows self-employment rates and the distribution of the self-employed over a detailed classification of branches based on the French Enquête Emploi 1984 and 1994, the German Mikrozensus 1982 and 1995 and the UK Labour Force Surveys 1984 and 1994 (see table 1).3
3 The rates and numbers based on these datasets differ slightly from the respective figures published by Eurostat. Firstly, the underlying industrial classification differs because we excluded the public sector since in this sector self-employment is generally not possible. Thus, including the public sector decreases the total male self-employment rate. The respective numbers are documented in the last row in parentheses in table 1.
Firstly, it is noticeable that a very high share of the male self-employed work in the British construction sector, where, moreover, the rate of self-employment greatly increased between 1984 and 1994. The self-employment rate in this branch in 1994 is almost 49%, and about 36% of all British male self- employed work in this sector. In France and Germany the highest male self-employment rate can be found in ‘hotels/restaurants’. In this field traditionally many people work for themselves, but in Germany this share decreased considerably between 1982 and 1995.
In France the male self-employment rate in all branches has remained almost unchanged or rather has decreased slightly between the 1980s and 1990s. Only in ‘transport/communication’ and
‘mining/manufacturing’ has the share of male self-employed increased over time. The growing importance of self-employment in industry could be due to the decline of dependent employment in large plants in the industrial sector as the share of total employment in this branch in particular has decreased. This development is evident in all three countries.
In Germany and the United Kingdom those sectors in which employment grew the fastest in the 1980s, namely the service sector (European Commission 1996), are also characterised by relatively high proportions of self-employment. The highest growth rates in the service sector can be found in
‘other services’ in Germany and the United Kingdom and, additionally, in ‘finance/business services’ in the UK.4 It is noticeable that in contrast to this, in France the male self-employment rate in ‘other services’ decreased remarkably while it remained unchanged in ‘real estate/business services’.
Table 1: Share and distribution of the male self-employed by industrial branches (age: 20-59 years)
France
1984 1994
branches
self-empl.
rate
distribution of the self- empl. in %
distribution of total empl. in %
self-empl.
rate
distribution of the self- empl. in %
distribution of total- empl. in %
mining, manufacturing 4.5 13.6 39.9 6.1 14.2 31.1
construction 20.8 24.1 12.6 21.2 20.6 13.0
wholesale, retail 21.2 28.0 14.2 20.8 24.6 15.8
hotels, restaurants 31.6 6.9 2.0 31.1 7.6 3.3
transport, communication 4.6 3.7 10.5 5.2 3.8 9.7
financial intermediation 6.9 1.9 3.4 6.8 1.6 3.1
real estate, business services 17.9 7.0 4.4 17.9 12.0 8.9
education 1.3 0.6 6.5 1.9 0.8 5.8
health, social work 25.4 8.8 3.5 23.9 10.1 5.7
other services 20.3 5.4 2.9 16.6 4.7 3.8
total 11.8
(10.8)a)
100 100 13.3
(11.9)
100 100
Secondly, the population considered differs as we exclude, for instance, unpaid family members and very young and very old workers from total employment. For detailed information on the data used see section 5.
continuation table 1
Germany
1982 1995
branches self-empl.
rate
distribution of the self- empl. in %
distribution of total empl. in %
self-empl.
rate
distribution of the self- empl. in %
distribution of total- empl. in %
mining, manufacturing 3.6 21.7 50.1 4.8 16.0 40.4
construction 8.1 12.7 13.1 12.3 12.9 12.6
wholesale, retail 19.0 25.5 11.2 19.9 21.9 13.3
hotels, restaurants 41.7 8.2 1.6 36.8 6.6 2.2
transport, communication 5.3 5.7 9.0 7.4 5.0 8.2
financial intermediation 6.9 2.8 3.4 13.5 4.5 4.0
real estate, business services 31.9 12.1 3.1 31.6 17.1 6.5
education 2.6 1.2 3.7 3.7 1.2 3.9
health, social work 19.8 5.8 2.4 18.9 7.1 4.6
other services 14.9 4.3 2.4 21.8 7.7 4.3
total 8.3
(7.6)
100 100 12.1
(10.9)
100 100
United Kingdom
1984 1994
branches self-empl.
rate
distribution of the self- empl. in %
distribution of total empl. in %
self-empl.
rate
distribution of the self- empl. in %
distribution of total- empl. in %
mining, manufacturing 4.0 10.3 39.0 5.0 8.7 31.0
construction 34.9 31.8 13.9 48.8 36.1 13.4
wholesale, retail 28.6 27.2 14.4 21.6 18.3 15.3
hotels, restaurants 28.0 5.4 2.9 26.0 4.0 2.8
transport, communication 10.5 6.7 9.7 12.8 7.1 10.0
financial intermediation
real estate, business services 16.9 9.8 8.8 20.8 16.7 14.5
education 4.7 1.4 4.4 5.9 1.5 4.7
health, social work 12.9 2.2 2.6 12.5 2.7 3.8
other services 18.9 5.3 4.3 20.3 5.0 4.4
total 15.2
(14.1)
100 100 18.1
(16.8)
100 100
Source: own calculations based on the French Enquête Emploi 1984 and 1994, the German Mikrozensus 1982 and 1995 and the UK Labour Force Surveys 1984 and 1994.
a) in all three tables the numbers in parentheses in the last row represent the total male self-employment rate including the public sector; see footnote 3.
In general, the figures stress the remarkable differences between the countries. The developments are not uniform in France, Germany and the United Kingdom. In the following we will discuss general theories and assumptions which are usually used to explain the recent growth in self-employment and particularly the differences between the countries.
4 Due to changes in the industrial classification in the British data we are not able to differentiate between
‘financial intermediation’ and ‘real estate/business services’. Therefore, in the analyses in the United Kingdom we can take only nine different branches into account.
2 Two general explanations for the rise of self-employment:
structural changes in the economic environment and the unemployment-push
Since the 1980s the growth of self-employment has been broadly discussed under the aspect of the renewed competitiveness of small enterprises which are mostly headed by self-employed people. The re-emergence of small businesses is mainly explained by the observation that economic activities have shifted from manufacturing towards services and in addition from mass production to flexible specialisation (Piore, Sabel 1984). This development is determined by a change in the structure of demand and different productivity in industrial sectors. It is argued that the economy-wide re- emergence of small firms and self-employed is due to the shift from manufacturing to the service sector which is characterised by many small firms, in contrast to manufacturing, which is dominated by large firms. The shift from the one sector to the other influences the number of firms and thus the number of self-employed people (Balkin 1986; Blau 1987; Steinmetz, Wright 1989; Fritsch 1990).5 In particular, ‘knowledge-intensive and business-related services’ tend to grow very fast (Klodt et al.
1996; Bryson et al. 1997; Strambach 1997). But the expansion of self-employed work could also be found in service branches such as ‘hotels/restaurants’, ‘transport/communication’ and ‘personal services’. The growing heterogeneity of demand for such services by individuals (i.e. personalised attention to specific needs of the clientele) as well as enterprises might be an important factor for this growth (Aronson 1991).
Another general line of explanation starts out from the idea that self-employment is seen as an occupational alternative in times of high unemployment. The growing number of own-account workers could be due to changes in the labour market situation which force more people to enter self- employment as a response to sustained mass unemployment and lack of opportunities in dependent (wage) employment (Bögenhold, Staber 1990; Hakim 1989; Staber, Bögenhold 1993; Acs et al. 1992).
This rise could be associated with a growing precariousness of self-employment jobs as more people enter this employment category in fields that provide only low income and low labour security (Arum 1997; Eardley, Corden 1996).
Both developments have been observed in almost all industrialised countries. Evidence for the shift from manufacturing to the service sector can be found in the United Kingdom as well as in Germany and France (European Commission 1995, 1996). But the thesis of the “unemployment push” to explain the growth of self-employment has also been evaluated positively for a large number of industrialised countries (Acs et al. 1992; Staber, Bögenhold 1993). As Bögenhold and Staber (1990: 272)
5 In general, due to the technology involved, in the Western European countries the industrial sector is clearly dominated by, on average, larger enterprises (17 persons employed per enterprise at the EC level) than both construction and services (4.4 and 5.2 respectively) (Commission of the European Union 1992). Industry also recorded relatively fewer micro enterprises (0-9 employees) than the construction and service sectors (Loveman, Sengenberger 1990).
summarise their study,6 “apart from two exceptions (Norway and Sweden), in all countries during the observation period the level of unemployment had a strong influence on the self-employment rate”
(our transl.). Although there is some evidence for a positive correlation between unemployment and growing self-employment this hypothesis is contentious. A number of authors report a negative influence of unemployment on the number of self-employed (Evans, Leighton 1989, 1990;
Blanchflower, Oswald 1998; Abell et al. 1995) and argue that the growth of self-employment rather goes along with general economic growth (“prosperity pull”). Meager (1992; 1993) further criticises methodological weaknesses especially in the studies of Bögenhold and Staber. The question whether self-employment is influenced by the “unemployment push” or the “prosperity pull” cannot be answered satisfactorily.
But in general, since we can find these developments – the changing mode of production and unemployment - almost uniformly in all three countries, one would expect a similar development of self-employment as well. But we observe obvious dissimilarities in self-employment between the countries. Country-specific features must be responsible for these differences, in particular the institutional framework that provides different opportunities to enter self-employment in each country.
Thus, in the next sections we will draw a brief picture of the institutional framework of the three countries. We expect to find marked differences which will be used to formulate hypotheses on the specific developments of self-employment in the three observed countries.
3 The institutional and legislative framework: Different situations for the self-employed in France, Germany and the United
Kingdom
There are numerous legislative arrangements and initiatives intended to encourage the growth of self- employment in the three countries. We distinguish two different groups: First, direct measures, e.g.
subsidised business start-ups especially by unemployed people. Second, indirect measures aimed at fostering entrepreneurship mainly in terms of adequate tax systems, simple regulations for business start-ups and low capital market barriers but also the development of generally more flexible work arrangements which can be subsumed under the concept of deregulation. Additionally, the institutional framework for self-employed work differs considerably between the countries. In particular, the formal requirements, especially concerning education for starting one’s own business, produce strongly varying conditions for self-employed work in the three countries. In the following we will regard these aspects of the institutional framework, first for the UK, then for Germany and France.
The most important type of subsidies for business start-ups in the UK is the Enterprise Allowance Scheme which was started in 1983 and supports newly self-employed people coming out of
6 Bögenhold and Staber (1990) compare the development of self-employment in 10 countries, among these France, Britain and Germany over the period 1950-1987.
unemployment with a weekly allowance for up to 52 weeks7 (Breen, Halpin 1988; Meager 1992, 1993).
The programme has been quite successful in terms of the number of participants since its introduction.8 In the UK at the end of the 1980s about 25% of newly-founded businesses were established by people who were previously unemployed (Anderton, Mayhew 1994).9
But apart from direct measures, it seems to be important how the British government changed the economic policies and institutions in the 1980s to emphasise market elements. The Thatcher government limited institutional intervention into the free market and tried to strengthen the power of entrepreneurship by enforcing deregulation, privatisation and reduction of business burdens. These laws and programmes were designed to expand self-employment among other things10 (Blanchflower, Freeman 1993). Self-employment and small businesses were promoted as a means of stimulating enterprise because this has been viewed as a contribution to economic development and the regeneration of UK industry, but also as a reduction of welfare dependency and bringing the unemployed into gainful economic activity (Rainbird 1991; Crompton et al. 1996).
Further, while simplifying access to venture capital for people willing to become self-employed, liquidity constraints were lowered for business start-ups. The capital market restrictions were loosened during the 1980s and 1990s (Blanchflower, Freeman 1993; Barrel 1994; Abell et al. 1995). It became much easier than before for the self-employed to obtain start-up finance in the UK in the 1980s.
Meager (1993: iii) concludes that “UK financial deregulation led to a credit boom in the mid-late 1980s”.
Furthermore, the phase of general deregulation did result in a lower degree of labour market regulation. Large firms were enabled to re-structure their organisation of work using forms of non- standard work like contract labour, “dependent” self-employment and other flexible arrangements (Purcell/Purcell 1999). This trend was particularly strong during the recession in the early 1980s (Rainbird 1991; Crompton et al. 1996).
Regarding the general institutional framework in Germany we can observe marked differences in comparison to the situation in the UK. Although some decisive steps have been taken to lower the degree of regulation since the 1980s, Germany is still characterised by a relatively complex tax system, complicated and time-consuming regulations for business start-ups and a high level of educational requirements to become self-employed in specific sectors of activity (e.g. in many fields of activity self-employment requires a special apprenticeship and attainment of the status of “Meister”).
The high educational requirements fit into a general framework of policies followed after 1945 and mainly aimed at protecting the existing self-employed and the so-called “Mittelstand” (Kießling 1996).
7 The programme contains many more regulations, specifies certain conditions for receipt of payments and has undergone several changes since it was established. For a more detailed discussion see Meager 1993, OECD 1995.
8 E.g. in 1992 the number of participants was 40,500 (Wilson, Adams 1994: 4).
9 This implies effects of deadweight and displacement which cannot be discussed in detail here. For further discussion see e.g. Breen, Halpin 1988; Meager 1993.
10 In general one can summarise the aims of the laws and programmes enacted by the Thatcher government as to: “1) weaken the power of unions; 2) enhance the rewards of work relative to unemployment and other non-
The situation used to be less dynamic and the flow rates between self-employment and other forms of employment were much lower in Germany than in the UK in the 1980s (Meager et al. 1992). But as in the UK the German government started programmes to foster business start-ups during the 1980s, mainly for the unemployed. The “Überbrückungsgeld” (bridging allowance) was introduced in 1986 to provide unemployed people with a monthly allowance equivalent to the previous unemployment benefit entitlement for up to 6 months if they start their own business (Wießner 1998).11 The changes at the policy level have resulted in a higher degree of fluctuation in and out of self-employment. In the years 1991-1994 there was a particularly marked rise in the entry rate in Germany so that on average in this time period the inflow into self-employment was higher than in the United Kingdom where it remained almost unchanged from the end of the 1980s (European Commission 1995).
Surprisingly, France, the country without almost any growth in self-employment, was the first to introduce direct measures to subsidy business start-ups by the unemployed. In 1979 ACCRE (Aide aux Chômeurs Créateurs ou Repreneurs d’Entreprises), a programme to support the foundation and take-over of enterprises by unemployed was created, which was the prototype for the programmes in the UK and Germany described above. At least in quantitative dimensions ACCRE has been rather successful. Especially between 1984 and 1987 (when the conditions for participating were best) it was able to attract a large number of new entrepreneurs (Höland 1993: 106ff). But even in 1994 more than 40% of all new enterprises (new creations and take-overs) were founded by the unemployed (Challier/Richard 1999, Aucouturier 1994). In general, there is a complex system of measures to stimulate job creation in France. But as Merle (1990) remarks this system is inefficient partly due to the fact that there are no institutionalised forms to tune the initiatives of different actors, especially tuning between the state and the private economy is lacking. It is questionable whether or not this pattern can be assumed for the measures to stimulate business start-ups too.
As in the UK and Germany, the French government implemented policies to reach a lower degree of state regulation in the 1980s. But, like the labour market measures the deregulation process has been hindered by the complexity of existing regulations and the lack of tuning between different actors.
Thus, in some areas the number and complexity of regulations even grew (Höland 1993). In general the effects of deregulation in France are not as clear as in the UK. But nonetheless, there is some evidence of a beginning flexibilisation in the French labour market. “[T]he large majority of jobs on the French labor market are still under the shape of contracts of employment at full-time and for an indeterminate duration, which is still the norm. However, the number of non-standard jobs every year represents an increasing number of the new jobs offered to labor market entrants” (Rojot 1999: 79). In general, the flexibilisation of labour arrangements combined with state programmes in the labour market seem to have resulted in a growth of part-time work and other forms of non-standard dependent work in France (O’Kelly 1999).
work-related benefits (...); 3) reduce government/institutional influence on market outcomes; and 4) expand self-employment“ (Blanchflower, Freeman 1993: 4).
11 In 1992 the number of participants was 31,587; the number further increased after some essential changes were made in 1994 concerning eligibility, reaching 78,824 people in 1997 (Wießner 1998).
Apart from measures aimed on the fostering of self-employment and other labour market programmes there are in general differences in the occupational outcomes that are gained through education. As studies on occupational entries have shown, the institutional embeddedness of the educational system differs considerably between the United Kingdom, Germany and France (Brauns et al. 1997; Müller, Shavit 1998). These studies indicate that especially the patterns in Germany and the UK differ fundamentally. Germany belongs to the countries where the effect of education on the position in the labour market is highest. The UK is characterised by low occupational outcomes of education. France ranges in the upper middle of these two extremes but shows marked differences in the importance of general and vocational qualifications. While general qualifications, especially tertiary education results in high occupational outcomes the importance of vocational training is rather low. It is probable that we will find these general patterns also for the self-employed.
It is difficult to summarise the institutional landscapes described above and to give a general trend for each of the three countries. But it seems enough to distinguish at least two developments. The situation in the UK is mainly characterised by a rather high degree of deregulation combined with strong efforts to promote a culture of entrepreneurship. Standards for the entry into self-employment, like the importance of formal education for labour market positioning, are rather low. Germany, in contrast, is characterised by rather high formal barriers to entry into self-employment. In general, education is a major condition for high labour market outcomes in Germany. German policies have long been directed at protecting the existing self-employed and not at creating new self-employment.
The situation in France is more difficult to characterise. There are some marked features, such as the promotion of self-employment which began already at the end of the 1970s and the extensive state programmes to stimulate the labour market. But evidence of occupational outcomes is not as clear as in Germany. Further, the results of the deregulation process cannot be evaluated in a definite manner.
4 Characteristics of the self-employed and the job held
Although we argue that the differences in the development of self-employment are influenced by the institutional framework in the specific countries, it is a fact that self-employment is based on individual choice determined by individual characteristics and resources. Apart from financial resources the importance of human capital is largely discussed in the literature on business start-ups and the self- employed (see for an overview Brüderl et al. 1996). In general, studies on the determinants of self- employment take the effects of formal education and work experience into account. Education is measured either along educational classifications or as duration of school attendance where a linear effect of education is assumed. If work experience is not measured directly age is used as proxy.
Regarding formal education we can find two concurring explanations in the literature. On the one hand, entry into self-employment has been assumed to be an alternative for less qualified people as their opportunities for dependent (wage) employment are getting worse (Bögenhold, Staber 1990, 1991). On the other hand, qualifications of business founders have been shown to be a crucial resource for business survival. Furthermore, knowledge-based economies that particularly offer new
possibilities for people to work on their own account require a rather high level of qualification (Bryson et al. 1997).
In general, for all three countries there is evidence that education has positive effects on the probability of being self-employed. In the UK the highest rates of self-employment are among those who have a high level of qualification (Meager et al. 1992; Campbell, Daly 1992; Moralee 1998).
Laferrère and McEntee (1995) report for France that education has a positive effect on the probability of being self-employed, but: “A robust result is that a person is less likely to switch into self- employment from wage work if he obtained a third level education” (52f). Thus, Magnac and Robin (1996), using a linear variable to measure education could not find a significant effect. In Germany one would expect rather strong effects of education on the probability of being self-employed since the linkage between education and labour market positions is very tight (Brauns, Steinmann 1997; Brauns et al. 1997). Regarding the development over time one has to take into account the enormous effects of educational expansion (Brauns et al. 1997, Müller et al. 1997, OECD 1998) which has taken place in all three countries in the last three decades. The general trend of educational expansion of course influences also the level of education of the self-employed.
The second aspect of human capital, work experience, is evaluated in a more uniform manner. Own- account workers tend to be older than wage workers since it takes time to accumulate the skills and resources needed to start a business and particularly to build up a certain social network of support as a source for acquiring business information and exchange (Granovetter 1985; Balkin 1989). Brüderl et al. (1992) found evidence that general work experience of a business founder, clearly related to age, serves as a very important determinant of business survival as well. Further, self-employment is more likely to occur later in life because it could be a way of supplementing retirement income or participating in the workforce after reaching the official retirement age. Positive effects of age on self- employment can also be found in studies in France (Laferrère, McEntee 1995; Magnac, Robin 1996) and in the UK (e.g. Taylor 1999).
Despite the importance of these individual resources the choice of self-employment is – as we argued above – deeply influenced by the institutional framework given. The differences between the countries result in varying opportunity structures for people to become self-employed. The respective context shapes the possibilities of how people can utilise their individual resources. Other important aspects defining the context – which we have not discussed in detail yet – are the opportunities to become self-employed along different sectors of economic activity.12 In general, the service sector in which small entities are the dominant organisational form (see section 2) is especially favourable for self- employment. Further, the degree of protection of dependent labour differs between specific sectors.
The most outstanding example for a rather low protection of dependent labour is the construction sector in the UK where already since the 1960s dependent jobs have been displaced by self- employed or rather labour-only sub-contractors (Moore 1981: 159f; Austrin 1980). This development is generally explained by “the decline of site-level union activity and employers’ and unions’ adherence
to centralised and national created a vacuum in the detail of labour relationship“ (Jones 1996: 124). In Germany, due to the fact that binding national collective agreements are adopted more strictly, no corresponding development could take place or at most to a smaller extent (Bögenhold et al. 1993:
241).13
Further, the existence of formal impediments, e.g. educational requirements for the self-employed in different sectors, have to be considered. In a comparative study on regions in Britain, Robson (1998:
320) comes to the conclusion that “self-employment will have been most favoured in regions in which a relatively high proportion of GDP is accounted for by certain industries in which the barriers to self- employment tend to be relatively low namely, Agriculture, Forestry and Fishing, Construction, and Distribution, Hotels, Catering and Repairs, etc”. Further, Bates (1995) in a study on self-employment entry in the U.S. clearly shows that education and work experience interact with specific branches.
”The varying factors linked to self-employment entry in different industries tend to obscure the role played by education and work experience in identifying self-employment entrants. The likelihood of self-employment entry in manufacturing and wholesaling rises steadily as years of work experience accumulate; the same pattern albeit weaker, prevails in skilled services. A single factor or two dominates the econometric models of self-employment entry for each of the industries under consideration: (1) the skilled services entrant is highly educated; (2) the construction entrant is male and decidedly not educated” (Bates 1995: 153). The skilled services such as business services and health are characterised as knowledge-intensive branches with high barriers to entry since the essential prerequisites for establishing a new business in this sector are “specialised expertise, reputation and educational and professional qualifications” (Bryson et al. 1997: 345). Especially professional jobs (such as lawyers or doctors) are strongly related to a high level of education because most of these occupations require academic qualifications. Thus, we can expect to find different patterns of growth and socio-economic profiles of the self-employed among different branches.
Although we could not draw a complete picture of the development of and the opportunity structures for self-employment, this general overview results in the following considerations:
1. In general we expect that age and education are important determinants for the probability of being self-employed. But as the importance of education in general and especially the occupational outcomes that are gained through education differ substantially between the UK, Germany and France it is likely that these differences influence the connection between educational resources and the choice of self-employment. On the one hand, we expect the educational effects on self-employment to be the highest in Germany, additionally increased
12 Quite instructive is the brief article by Campinos-Dubernet and Grando (1991) on the methodological problems in comparative studies on industrial branches.
13 The rate of self-employment in construction in Britain was similar to Germany’s in 1960 (about 10%). Whereas in Germany the rate did not change substantially in the following decades (it sank to a level of about 7% but due to the growth in the 1980s and 1990s raised again up to 11.4% in 1995), in Britain a marked rise started in 1966 which was interrupted by the recession in 1973 but resumed performance in 1977. Since then the rate grew from about 18% to 44.6% in 1994 (see section1, figures for the period 1960 – 1985 see Bögenhold et al.
1993: 231).
through rather high impediments to entering self-employment. On the other hand, we expect just low effects in the UK due to low barriers for self-employment entry and low occupational outcomes by education in general. For France we expect medium educational effects because occupational outcomes of general education are rather high but not as high as in Germany.
2. In comparison over time we expect a reduction of the effects of education and age on the probability of being self-employed in all countries. Through deregulation and fostering of business start-ups for the unemployed it is likely that there has been a qualificational downgrading of the self-employed.
3. This development cannot be observed in general. As we argued, differences between industrial branches tend to obscure educational influences on the probability of being self-employed. We are going to examine the branch specific development concerning the educational level of the self- employed. On the one hand we expect that branches like ‘construction’, ‘wholesale/retail’,
‘transport/communication’ and ‘hotels/restaurants’ require significantly lower education than other branches. On the other hand, for skilled services, branches like ‘financial intermediation’,
‘business services’ and ‘health’ we expect a high level of education inside the group of the self- employed.
These hypotheses will be evaluated empirically on basis of two databases (1980s/1990s) for each country. These data sets, the main concepts involved and the models used will be described in the next section.
5 Data and main concepts
Self-employed people are defined as those who work for themselves for profit or fees in their own businesses. They are typically seen as opposed to wage and salary employees and theoretically distinguished from them by “the degree of autonomy and control these [self-employed] workers have over their labor” (Aronson 1991: xii).
A precise and standard definition of self-employment is still missing in the literature; it varies depending on whether it is based on people’s self-definition or on tax, social security or employment law purposes. Therefore, a large part of the data on self-employment can be considered more a residual than a well-targeted category (Hakim 1988). Statistical surveys usually tend to underestimate the true level of self-employment (OECD 1986).
Our analyses are based on data derived from the German ‘Mikrozensus’ from 1982 and 1995, the UK
‘Labour Force Survey’ and the French ‘Enquête Emploi’ from 1984 and 1994. The data sets have many advantages for comparative research: the surveys share central methodological procedures and a core set of questions. In addition, the huge sample sizes allow for detailed analyses of different employment statuses.
In these data sets the division between employees, unpaid family workers and the self-employed is based on survey respondents’ own assessment of their employment status. In some research unpaid
family workers have been included in the category of self-employed workers. Even though it might make sense in some research contexts we will rely on a narrower definition in our analyses and exclude unpaid family workers from the group of the self-employed. As discussed in section 1 we restrict our analyses to males in non-agricultural sectors of activity. Furthermore, as the development in the former GDR relies on special conditions, we consider only West Germany in our analyses.
In our multivariate analyses we consider different determinants of self-employment. As a first set of variables, age measured by different age groups (reference category: ‘20-29 years’ compared to ‘30- 39 years’, ‘40-49 years’ and ‘50-59 years’) and education are included to measure the effect of human capital resources. Education is classified in a comparative way using a slightly modified CASMIN scheme (Brauns, Steinmann 1997; Brauns et al 1997). This classification systematically distinguishes between general and vocational qualifications (for details of definitions, see table A1 in the appendix).
The categories range from 1ab ‘general elementary education’ (used as reference category) to 3b
‘higher tertiary education’. Further, a number of general socio-demographic variables such as marital status (reference category: ‘single’ compared to ‘married’, ‘divorced/widowed’), family composition (reference category: ‘no children in family’ compared to ‘children under 5 years’, ‘children between 5- 15 years’) and nationality (reference category: ‘other national’ compared to ‘national of country’) are included.
A second set of variables contains indicators on the characteristics of the job held. Following the assumption that the opportunities for self-employment differ greatly over the sector of activity we included a rather extensive set of variables on industrial branches. The classification used is orientated toward the NACE Rev. 1 classification (Mai, 1991; Eurostat 1992). Because the underlying classifications in the national Labour Force Surveys have changed considerably over time, we had to devise rules of assignment in order to achieve comparability across time and countries. We tried to make categories as comparable as possible, but some degree of discontinuity may remain.14 We differentiate between 10 different industrial branches; ‘mining/manufacturing’ is used as the reference category. In addition, working time measured as full-time vs. part-time (reference category: ‘part-time’) and whether a second job is held by the person15 (reference category: ‘no second job held’ compared to ‘second job held’) are included in the analyses. The population we examine is restricted to people who regularly worked during the reference week of the survey and who are between 20 and 59 years old. We consider only their main job. All characteristics are included in the analyses as sets of dummy variables.
14 As already mentioned, one very important effect of these changes on the classification used is that in the United Kingdom we are not able to differentiate between ‘financial intermediation’ and ‘real estate/business services’. Therefore, in the scope of the analyses in the United Kingdom we can take only nine different branches into account while in Germany and France we are able to differentiate between ten.
15 This characteristic cannot be considered in the analyses based on the German Mikrozensus of 1982 and the French Enquête Emploi 1984 because the respective data are missing.
6 The determinants of self-employment in France, Germany and the United Kingdom
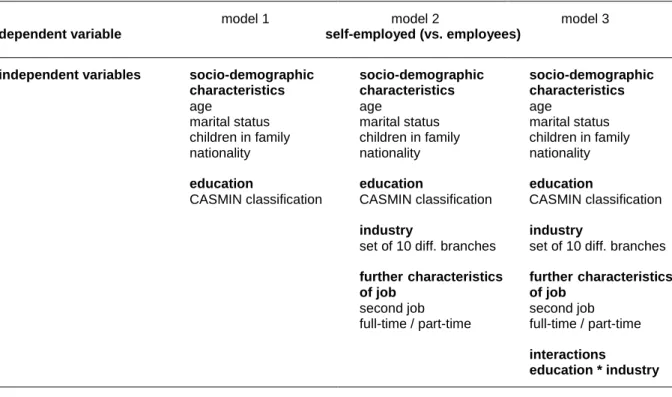
The analyses are based on three different binomial logit models with self-employed (vs. employees) being the dependent variable. All models have been estimated for all countries for 1984 and 1994 (Germany: 1982 and 1995 respectively). The number of independent variables differs (see table 2), starting with model 1 which contains only socio-demographic characteristics and education of the workers. In model 2 a set of industrial branches and characteristics of the job are included, model 3 additionally contains interaction terms between education and industrial branches.16
In the first step we analyse the general characteristics of the group of the self-employed to see the differences between the countries and over time in the general determinants of self-employment. In the second step by including the set of industrial branches and further characteristics of the job we try to control for different opportunity structures for self-employment defined by different industrial sectors.
The last step serves to control for the different role of education in the various industrial branches.
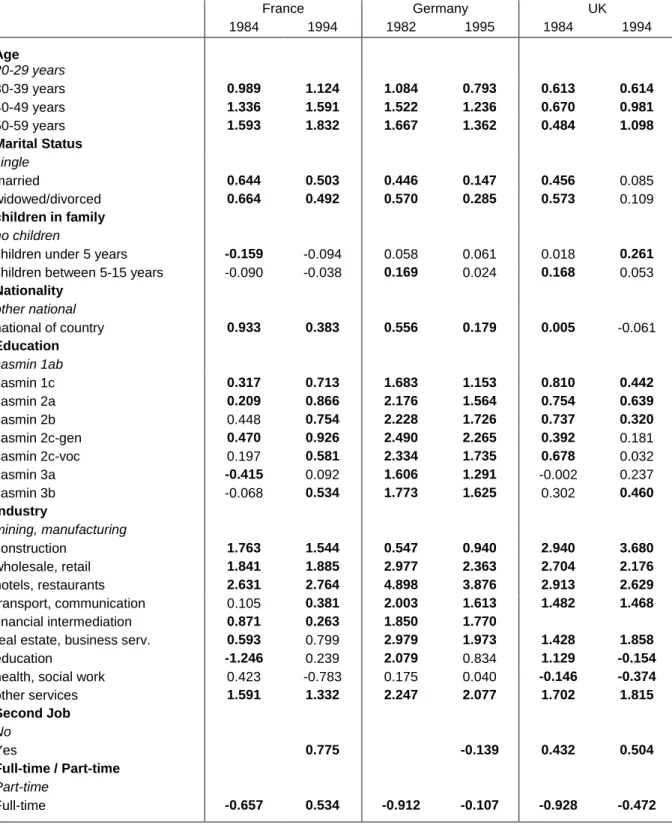
Table 2: Variables used in multivariate analyses
model 1 model 2 model 3
dependent variable self-employed (vs. employees)
independent variables socio-demographic characteristics
socio-demographic characteristics
socio-demographic characteristics
age age age
marital status marital status marital status children in family children in family children in family
nationality nationality nationality
education education education
CASMIN classification CASMIN classification CASMIN classification
industry industry
set of 10 diff. branches set of 10 diff. branches further characteristics
of job
further characteristics of job
second job second job
full-time / part-time full-time / part-time interactions
education * industry
16 To create the interaction effects, we re-grouped our educational classification obtaining three educational levels: 1) no/low formal education (CASMIN 1ab), 2) formal education without tertiary diploma (CASMIN 1c, 2a, 2b, 2c-general, 2c-vocational), 3) tertiary education (CASMIN 3a, 3b). Interaction effects were created between the latter two categories and all branch variables. In the analyses based on the UK Labour Force Survey we have to omit the interaction effect of secondary education and ‘health/social work’ because the cell sizes are too small for reliable estimates to be made. Thus, latter in figure 4 we only document the interaction effects for tertiary education in this branch.
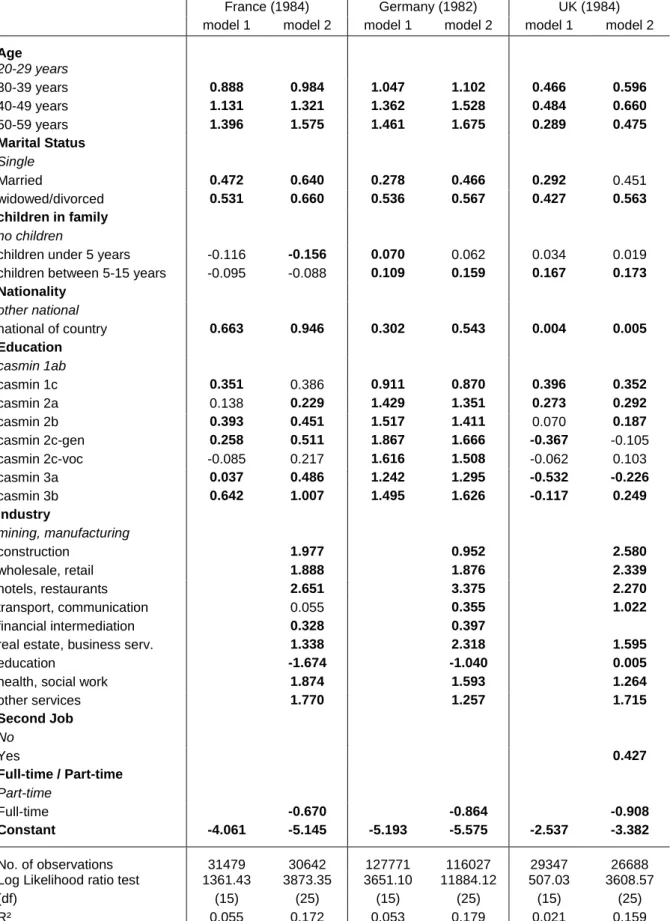
Socio-demographic characteristics and education – model 1
The set of socio-demographic characteristics is included in model 1 (see appendix: table A2 and A3).
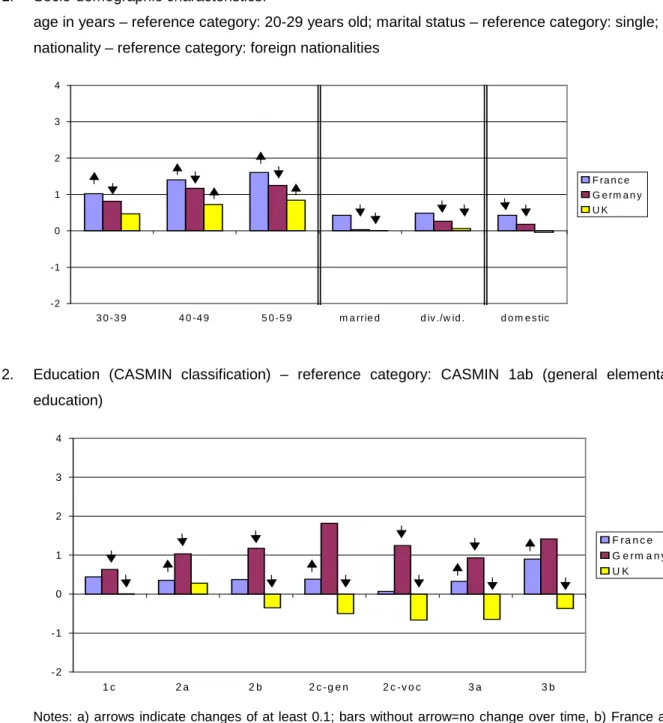
These variables will be interpreted as general characteristics of the group of self-employed. Here we can see the effects of age, marital status, children, nationality and education. An overview of coefficients of the variables can be found in figure 2. The coefficients for the 1990s are plotted as bars.
Changes in the coefficients between the 1980s and the 1990s are indicated as arrows (indicating changes of at least 0.1 between the two points of time). Due to the fact that the influence of having children on the probability of being self-employed in all countries is rather low, these effects are not plotted as figures. Since we consider only male self-employment this is not surprising.
In general, a number of similarities between the countries can be observed in the 1990s. Marital status and nationality lose importance as predictors of self-employment. Apart from France where slightly positive effects can be observed these variables only marginally influence the probability of being self- employed. This means that the likelihood for ‘singles’ and ‘foreign nationalities’ in particular increased between the 1980s and 1990s. In the 1990s, these two groups are more likely to be self-employed than they were in the 1980s.
As expected, age always has a positive effect. Thus, the likelihood of being self-employed increases with age in all three countries. At least in the 1990s this seems to be a rather linear relation in all countries. The highest coefficients can be found in France. Therefore, the differences between the oldest (50-59 years) and youngest (20-29 years, reference category) are highest in France. The youngest age group has the lowest likelihood of being self-employed in France compared to the other countries. In contrast, in UK the probability of young people being self-employed is the highest compared to the other countries since the differences between the age groups is lowest.
But in general, the explanatory power of the socio-demographic characteristics is rather low, especially in the UK.17 The effects of education indicate stronger differences between the countries.
The importance of education for the probability of being self-employed is strongest in Germany.18 This confirms our assumption that, in general, the effects of education in Germany are high and that the probability of being self-employed is highly influenced by specific qualifications in many sectors of activity. In France, the likelihood of being self-employed is also higher for those who have obtained a higher level of education compared to those who have no or only the lowest formal qualifications. In contrast, only in the UK are those with higher education less likely to be self-employed than those with only general elementary education.
17 See the goodness of fit statistics of model 1. Comparing the goodness of fit statistics of all models one can observe that over time in all countries the explanatory power of the specified models is decreasing (exception:
model 1 in the UK in which the explanatory power is extremely low in the 1980s and slightly increasing over time).
18 In Germany the educational level 2c-general (general maturity) results in the highest probability of being self- employed. Due to the fact that this group is extremely small we will not interpret this effect in the following.
Figure 2: Coefficients of model 1 (1990s): France, Germany and UK Arrows indicate change a) in coefficients over time (1980s to 1990s) b)
1. Socio-demographic characteristics:
age in years – reference category: 20-29 years old; marital status – reference category: single;
nationality – reference category: foreign nationalities
-2 -1 0 1 2 3 4
3 0 -3 9 4 0 -4 9 5 0 -5 9 m a rrie d d iv ./w id . d o m e s tic
F ra n c e G e rm a n y U K
2. Education (CASMIN classification) – reference category: CASMIN 1ab (general elementary education)
- 2 - 1 0 1 2 3 4
1 c 2 a 2 b 2 c - g e n 2 c - v o c 3 a 3 b
F r a n c e G e r m a n y U K
Notes: a) arrows indicate changes of at least 0.1; bars without arrow=no change over time, b) France and UK (1984, 1994), Germany (1982, 1995), unfilled bars indicate that coefficients are not significant at 5%- level.
Over time one can observe that the influence of age has converged between the countries (see appendix: table A2 and A3). The decreasing effects for all older age groups (‘30-39’, ‘40-49’ and ‘50- 59’ years old) in Germany indicate that between the youngest (‘20-29’ years old) and all the others the differences in the likelihood of being self-employed declined. In contrast, the differences between the older age groups and the youngest group as reference category increased in the UK and France. The likelihood of being self-employed among older people has risen between the 1980s and 1990s in
these two countries. Although the differences in the probabilities of young people being self-employed are largest between the countries we can observe dissimilarities for the other age groups as well.
In Germany and France we can observe opposite developments concerning the relevance of education. Whereas in Germany the importance of education for the probability of being self-employed decreased, it grew in France. Thus, self-employment among the less qualified (1ab ‘general elementary education’ as reference group) is more likely in the 1990s than it was in the 1980s in Germany since the distances between the highest educational categories and the lowest are diminishing between the two points of time. In France the higher probability of self-employment of highly-educated people even increased compared to the reference group during this period. In the UK the contrast between those with high and those with low levels of education has grown as well whereas the likelihood of self-employment among highly qualified people has decreased. We cannot observe a common pattern of the relationship between education and self-employment in the three countries. The influence of education on the probability of self-employment differs remarkably between the countries.
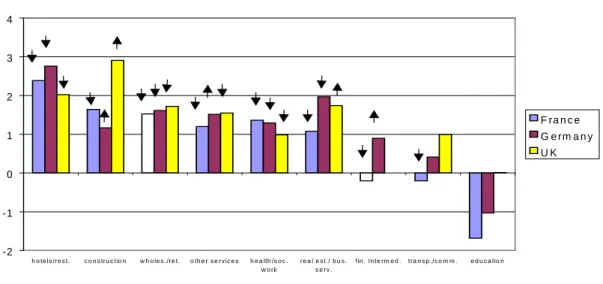
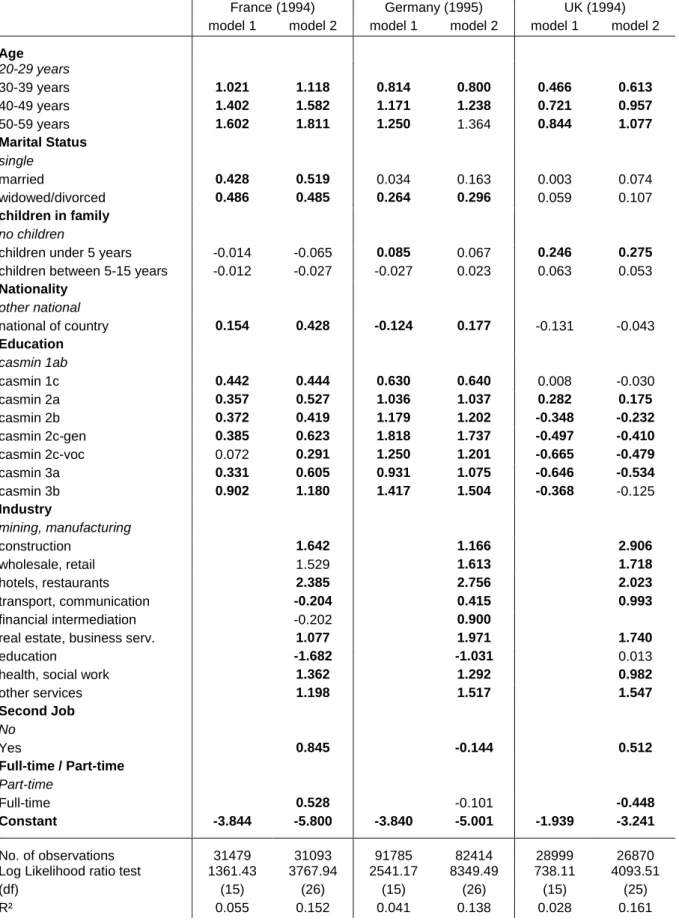
Industrial branches – model 2
In model 2 the branch variables (using a rather detailed branch classification) were included into the analyses to see which branches appear to give the best opportunities for self-employment, given the socio-demographic characteristics and education of the workers.19 The sector ‘mining/manufacturing’
being a rather large sector was used as reference category. This sector is clearly dominated by big firms and enterprises, capital-intensive organisation of production and a low share of self-employed work. Therefore, the requirements for being self-employed in this sector are very high. Thus, the probability of being self-employed in other sectors compared to ‘mining/manufacturing’ should be positive. This generally is found to be true for all sectors both in the 1980s and in the 1990s (only exception is the education sector where the number of self-employed is extremely low) (see appendix:
table A2 and A3). Figure 3 shows the parameters estimated for the branches in model 2 (for the other parameters see appendix: table A2 and A3; the effects of these parameters are very similar to those in model 1). Regarding figure 3 quite similar differences in self-employment over the industrial sectors can be observed for all countries in the 1990s (as in figure 2: coefficients for the 1990s are plotted as bars; changes between the 1980s and 1990s are indicated as arrows). The probability of being self- employed in general is rather high in ‘hotels/restaurants’, ‘wholesale/retail’ and in ‘other services’
compared to ‘mining/manufacturing’. The first branches are generally characterised by relatively low qualificational requirements, the latter includes both: skilled and unskilled services. Like the service sector in general, all three branches are characterised by rather small firm sizes. In the ‘health/social
19 The influence of the further characteristics of the job held (full-time, having a second job) is rather different between the countries and changes over time. Since only a small percentage of the self-employed does not work full-time or has a second job these effects and the changes are based on very small groups of workers.
The change in the effects of ‘full-time’ indicate that compared to employees, part-time work was more common for self-employed in the 1980s. The change in the effects over time is due to the growing number of part-time employees (the proportional growth is strongest in France). The number of self-employed is relatively stable.
work’ sector the likelihood of being self-employed are quite similar in all countries, too, but not as high as in the first group of services. The largest differences can be observed in ‘construction’. In Britain the probability of being self-employed in this sector is outstandingly high and has become even stronger over time. Thus, our results seem to confirm the assumption that in the British construction sector a high rate of displacement of dependent workers by (labour-only) self-employed has taken place. In the literature this is mainly traced back to a low trade union density in this industrial branch in the UK (see section 4).
Figure 3: Coefficients of model 2 (1990s): France, Germany and UK Arrows indicate change a) in coefficients over time (1980s to 1990s) b) Industrial branch c) – reference category: ‘mining/manufacturing’
-2 -1 0 1 2 3 4
h o te ls /r e s t. c o n s tr u c tio n w h o le s ./r e t . o th e r s e r v ic e s h e a lth /s o c . w o r k
r e a l e s t ./ b u s . s e rv .
fin . In te r m e d . t ra n s p ./ c o m m . e d u c a tio n
F ra n c e G e rm a n y U K
Notes: a) bars without arrow=no change over time, b) France and UK (1984, 1994), Germany (1982, 1995), c) UK: ‘real estate/business services’ includes ‘financial intermediation’, unfilled bars indicate that coefficients are not significant at 5%-level.
The developments in the branches with a lower share of self-employed do not follow a uniform pattern.
In Germany, a high probability of self-employment can be found in ‘real estate/business services’.
Since the share of self-employed workers was already very high in the 1980s the likelihood of being self-employed in this field of activity decreased over time compared to ‘mining/manufacturing’ because a general expansion of total employment took place (see also table 1). Self-employment in France seems to be dominated by branches which traditionally have a higher share of self-employment, like
‘wholesale/retail’ and ‘hotels/restaurants’. Moreover, the likelihood of self-employment in skilled services and ‘real estate/business services’ decreased. In contrast, in both Germany and the UK the probability of self-employment is much higher in skilled services and in the UK, even growing over time compared to ‘mining/manufacturing’.
Since ‘mining/manufacturing’ in all three countries is characterised by an increasing share of self- employment between the 1980s and 1990s because of the decline of dependent employment (see also table 1), the probability of being self-employment has risen as well. Thus, the likelihood of self- employment in most of the other branches decreased compared to ‘mining/manufacturing’.
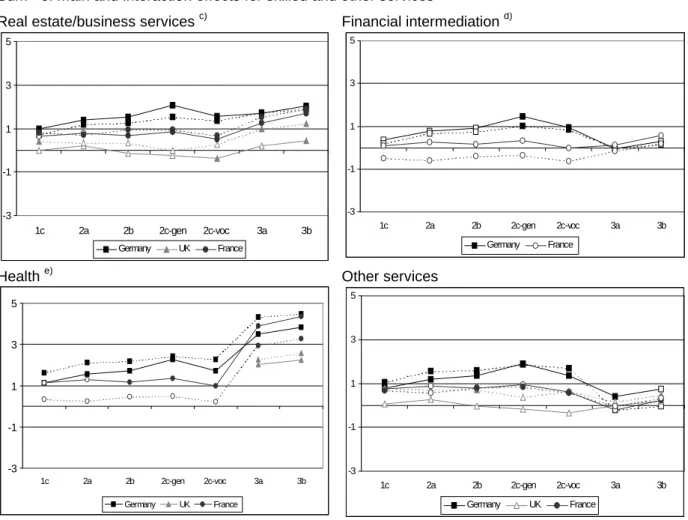
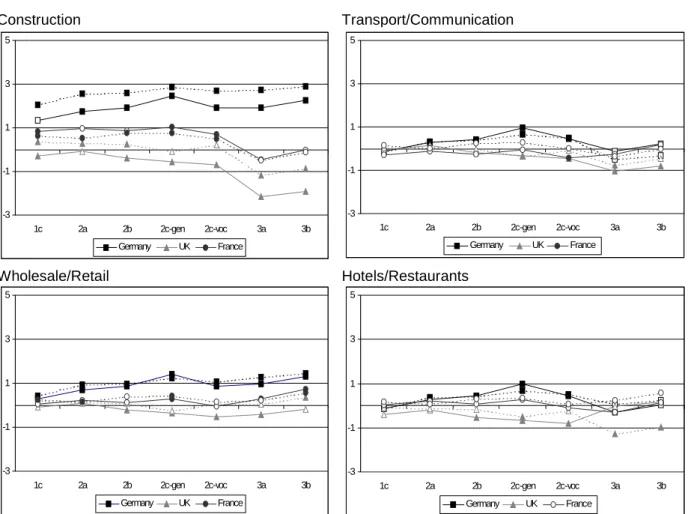
The differential role of education in the various industrial branches – model 3
As argued above we expect that specific industrial branches offer good opportunities for low-skilled self-employment whereas in other branches higher education increases the probability of being self- employed. Therefore, in model 3 we additionally consider the interactions between education and industrial branch.
‘Mining/manufacturing’ is used as reference category. Thus, the specific effects of education in this branch correspond to the main effects of education alone (see appendix: table A4). We expected educational requirements to be high in this branch. Indeed, as compared to the reference category
‘mining/manufacturing’ both in the 1980s and in the 1990s, most of the interaction effects for the other branches are negative. We can conclude that in general the relevance of education for self- employment in these branches is lower.
For figure 4 and 5 we calculate the sums of main effects and interaction effects for all branches and education categories respectively. These sums can therefore be interpreted as the branch-specific effects. The effects of education considered for the various branches in figure 4 and 5 are the contrast to the reference category of basic compulsory education (1ab). The closer the points on a line for a given country and a given branch clusters around the horizontal zero-line, the less education matters for self-employment in this (country-/branch-) context.
In general, in almost all branches the “lines” for Germany are on the top and the “lines” for the UK are on the bottom. France is always somewhere in between. Furthermore, the lines for the two points of time in one country are generally closer than the lines referring to the different countries. We thus find country-specific patterns which did not change much over time. But we also find typical patterns of education effects which are common to all three countries.
We argued that there are branches such as the skilled services which should be characterised by a relatively high influence of education on the probability of being self-employed. First of all, there are large similarities in the educational profiles of the different branches in all countries. Apart from
‘construction’ a sector in which the results especially for Germany and the UK are extremely different in all the other branches we can observe similar patterns. In figure 4 we can see that especially in the
‘health’ sector (due to the high share of professional occupations) but also in ‘real estate/business services’ tertiary education in particular increases the probability of being self-employed. In ‘financial intermediation’ we cannot observe this expected tendency since education makes almost no difference in the likelihood of being self-employed.
Regarding the branches in which we expected education not to have high importance we can observe the expected results in all countries, at least for two branches (‘transport/communication’ and
‘hotels/restaurants’). The likelihood of being self-employed is almost unaffected by the varying educational categories in these branches. In Germany, education does have an influence on the probability of being self-employed in ‘wholesale/retail’ and, at least, in France and the UK many educational categories show a significant influence on self-employment in this branch. This does not fit exactly with the pattern of low-skilled services but it is definitely distinct from branches of highly- educated self-employment like ‘health’. As already mentioned, in construction education effects differ most between the countries. In the UK and France the probability of being self-employed is lowest for
workers with tertiary education (see figure 5). Germany does not follow this pattern. In fact, the educational distribution in the German construction sector is rather unexpected. Self-employment is highest among those with full secondary or tertiary education. We argued that in Germany entry into self-employment in the construction sector is, in general, protected by relatively high educational impediments in the crafts. Although the relatively high significance of secondary education seems to confirm this hypothesis, it cannot explain the high effects for tertiary education.20
Figure 4: Coefficients of binomial logit models: France, Germany and UKa)
Sumb) of main and interaction effects for skilled and other services
Real estate/business services c) Financial intermediation d)
-3 -1 1 3 5
1c 2a 2b 2c-gen 2c-voc 3a 3b
Germany UK France
-3 -1 1 3 5
1c 2a 2b 2c-gen 2c-voc 3a 3b
Germany France
Health e) Other services
-3 -1 1 3 5
1c 2a 2b 2c-gen 2c-voc 3a 3b
Germany UK France
-3 -1 1 3 5
1c 2a 2b 2c-gen 2c-voc 3a 3b
Germany UK France
Notes: a) 1982/84: dotted lines, 1994/95: full lines, b) unshaded symbols indicate that the test of linear combinations of main effects and interaction terms is not significant at 5%-level, c) UK: includes financial intermediation, d) UK: ‘financial intermediation’ included in ‘real estate/business services’, e) The interaction term could not be estimated in the UK model due to the fact that there have been no male self-employed without tertiary education in ‘health/social work’. Basis: model 3, see appendix table A4.
The comparison between the 1980s (dotted lines) and 1990s (full lines) clearly shows a remarkable stability of the patterns in all three countries. The two lines for each country run mainly parallel or are
20 Another explanation could be that the German construction sector is characterised by a rather high share of foreign firms, e.g. subcontractors from the UK, the Netherlands and Poland. This might lead to a less dynamic development of German subcontractors in the construction industry resulting in a relatively highly educated
almost congruent in most branches. Thus, the influence of education on the probability of being self- employed remains almost the same between the two points of time. In Germany the only exceptions are ‘construction’ and ‘health’ where in the 1990s the influence of education on the likelihood of self- employment is remarkably lower than it was in the 1980s. In contrast, the importance of specific qualifications for the probability of being self-employed increased in ‘health’ and ‘financial intermediation’ in France and in ‘hotels/restaurants’ in the UK during this time period.
Figure 5: Coefficients of binomial logit models: France, Germany and UKa)
Sumb) of main and interaction effects for construction and unskilled services
Construction Transport/Communication
-3 -1 1 3 5
1c 2a 2b 2c-gen 2c-voc 3a 3b
Germany UK France
-3 -1 1 3 5
1c 2a 2b 2c-gen 2c-voc 3a 3b
Germany UK France
Wholesale/Retail Hotels/Restaurants
-3 -1 1 3 5
1c 2a 2b 2c-gen 2c-voc 3a 3b
Germany UK France
-3 -1 1 3 5
1c 2a 2b 2c-gen 2c-voc 3a 3b
Germany UK France
Notes: a) 1982/84: dotted lines, 1994/95: full lines, b) unshaded symbols indicate that the test of linear combinations of main effects and interaction terms is not significant at 5%-level, Basis: model 3, see appendix table A3
In general, the influence of education is lower in the UK than in the two other countries, and particularly in ‘construction’ as well as in ‘wholesale/retail’ and ‘hotels/restaurants’ the probability of being self-employed decreases as education increases compared to ‘mining/manufacturing’.
group of self-employed. This development has been evaluated by a project of Gerhard Bosch and Klaus Zühlke-Robinet at the „Institut für Arbeit und Technik“ (Gelsenkirchen/Germany).