This content has been downloaded from IOPscience. Please scroll down to see the full text.
Download details:
IP Address: 134.245.215.185
This content was downloaded on 10/06/2016 at 11:00
Please note that terms and conditions apply.
Anomalous mid-twentieth century atmospheric circulation change over the South Atlantic compared to the last 6000 years
View the table of contents for this issue, or go to the journal homepage for more 2016 Environ. Res. Lett. 11 064009
(http://iopscience.iop.org/1748-9326/11/6/064009)
LETTER
Anomalous mid-twentieth century atmospheric circulation change over the South Atlantic compared to the last 6000 years
Chris S M Turney1, Richard T Jones2, David Lister3, Phil Jones3,4, Alan N Williams1,5, Alan Hogg6, Zoë A Thomas1, Gilbert P Compo7,8, Xungang Yin9, Christopher J Fogwill1, Jonathan Palmer1, Steve Colwell10, Rob Allan11and Martin Visbeck12
1 Climate Change Research Centre, School of Biological, Earth and Environmental Sciences, University of New South Wales, Sydney, New South Wales, Australia
2 Department of Geography, Exeter University, Devon, EX4 4RJ, UK
3 Climatic Research Unit, School of Environmental Sciences, University of East Anglia, Norwich, UK
4 Center of Excellence for Climate Change Research/Department of Meteorology, King Abdulaziz University, Jeddah, Saudi Arabia
5 Extent Heritage, 2/729 Elizabeth Street, Waterloo, NSW 2017, Australia
6 Waikato Radiocarbon Laboratory, University of Waikato, Private Bag 3105, Hamilton, New Zealand
7 Cooperative Institute for Research in Environmental Sciences, University of Colorado, Boulder, CO 80309, USA
8 Physical Sciences Division, Earth System Research Laboratory, NOAA, Boulder, CO 80305, USA
9 ERT, Inc., Asheville, NC 28801-5001, USA
10 British Antarctic Survey, Cambridge, CB3 0ET, UK
11 Met Office Hadley Centre, Exeter, UK
12 GEOMAR Helmholtz Centre for Ocean Research Kiel and Kiel University, Germany E-mail:c.turney@unsw.edu.au
Keywords:southern annular mode(SAM), Southern Hemisphere westerlies, subantarctic climate extremes, temperature, climate reanalysis, anthropogenic climate change, El Niño-Southern Oscillation(ENSO)
Abstract
Determining the timing and impact of anthropogenic climate change in data-sparse regions is a considerable challenge. Arguably, nowhere is this more difficult than the Antarctic Peninsula and the subantarctic South Atlantic where observational records are relatively short but where high rates of warming have been experienced since records began. Here we interrogate recently developed
monthly-resolved observational datasets from the Falkland Islands and South Georgia, and extend the records back using climate-sensitive peat growth over the past 6000 years. Investigating the
subantarctic climate data with ERA-Interim and Twentieth Century Reanalysis, we
find that a steppedincrease in precipitation across the 1940s is related to a change in synoptic atmospheric circulation: a westward migration of quasi-permanent positive pressure anomalies in the South Atlantic has brought the subantarctic islands under the increased influence of meridional airflow associated with the Amundsen Sea Low. Analysis of three comprehensively multi-dated
(using14C and
137Cs) peat sequences across the two islands demonstrates unprecedented growth rates since the mid-twentieth century relative to the last 6000 years. Comparison to observational and reconstructed sea surface temperatures suggests this change is linked to a warming tropical Pacific Ocean. Our results imply
‘modern’
South Atlantic atmospheric circulation has not been under this configuration for millennia.
1. Introduction
Identifying the impact of anthropogenic forcing of climate modes in observation-poor regions is extre- mely challenging. The situation is particularly acute over the mid to high latitudes of the Southern Hemi- sphere. The southern annular mode(SAM), defined as the pressure difference between 40°S and 65°S, is the
leading mode of climate variability in the southern mid-latitudes(Marshall 2003). The widely reported positive shift in SAM during the mid-1970s is evidenced by the intensification and southward shift of westerly airflow over the Southern Ocean (Mar- shall 2003, Visbeck 2009) and has been linked to hemispheric-wide changes in the atmosphere-ocean- ice domains (Hall and Visbeck 2002, Le Quéré
OPEN ACCESS
RECEIVED
23 November 2015
REVISED
24 May 2016
ACCEPTED FOR PUBLICATION
25 May 2016
PUBLISHED
9 June 2016
Original content from this work may be used under the terms of theCreative Commons Attribution 3.0 licence.
Any further distribution of this work must maintain attribution to the author(s)and the title of the work, journal citation and DOI.
© 2016 IOP Publishing Ltd
et al2009, Marshall and Speer2012, Lentonet al2013), including extensive warming, glacier retreat, sea-ice retreat, and ecological change (Domack et al 2005, Gordon et al 2008, Cook et al 2010, Mulvaney et al2012). Model projections suggest a trend towards increasingly positive SAM into the 21st century as a result of a persisting Antarctic ozone hole and increas- ing atmospheric greenhouse gas concentrations (Thompson and Solomon2002, Thompsonet al2011, Lee and Feldstein 2013, Previdi and Polvani 2014, Thomaset al2015)with ozone hole recovery compli- cating this projection(Perlwitzet al 2008). Unfortu- nately, continuous meteorological observations across the Southern Ocean only capture intra-annual to decadal climate variability over the 20th century (Zazulieet al 2010, Richard et al2013), limiting our ability to place recent changes in the context of long- term(i.e. multi-decadal and longer)natural variability (Zhanget al2007).
Climate proxies allow the extension of the obser- vational record into the Holocene at sub-annual(e.g.
ice cores, tree rings and corals)to multi-decadal(e.g.
sediments, pollen, shells, boreholes)resolution(Jones et al2002, Joneset al2009, Mulvaneyet al2012, Mas- son-Delmotteet al2013, PAGES 2k Consortium2013, Loughet al2014, Palmeret al2015). Using annually- resolved proxies across the Southern Hemisphere and the Antarctica Peninsula(Villalba et al2012, Abram et al2014), the 1970s shift in SAM has been shown to be part of an increasingly positive trend since the 1940s, consistent with anthropogenic forcing (Thompsonet al2011, Thomaset al2015). Divergence from modeled natural trends, however, suggest a rela- tively late anthropogenic climate impact(post-1980s) across the south Atlantic region (King et al 2015), implying the 1940s shift in SAM and associated cli- mate impacts may not in fact be anthropogenic, but rather part of a longer natural cycle. Comparison to a long-term proxy climate baseline is therefore essential for understanding the late 20th century trend.
The last 6000 years is a particularly useful period against which to compare recent climate trends. The Antarctic ice sheets and sea level had achieved close to their modern configurations at the start of this period (Wanneret al2008). Importantly, postglacial condi- tions in the Southern Ocean appear to have become established around 6.5 ka(Rosqvistet al1999), with surface water cooling and sea ice expansion from 5000 years ago (Hodell et al 2001, Wanner et al 2008, Renssenet al2012)and stable ice shelves on the Penin- sula (Domack et al 2005). These changes are coin- cident with the end of the so-called Hypsithermal and the African humid period(deMenocalet al2000, Haug et al2001, Tierneyet al2015), all implying the estab- lishment of ‘pre-industrial’(CE 1850) global atmo- spheric and oceanic circulation. Options for the development of a network of annually resolved cli- mate proxies spanning 6000 years has been limited across the south Atlantic region.
Fortunately, peat growth can be promoted by temperature and precipitation increases on multi-dec- adal to centennial timescales(MacDonaldet al2006, Dise 2009, Loisel and Yu 2013). On the Antarctic Peninsula, for instance, studies have highlighted exceptionally high peat growth during the latter part of the 20th century in the context of the last 350 years (Conveyet al2011, Royleset al2012, Royles and Grif- fiths2015), consistent with significant and rapid regio- nal warming(Vaughanet al2003)and a decrease in seasonality (Franzke 2012), linked to the positive recent trend in SAM(Thompson and Solomon2002). A more extensive network of sites across the region is therefore required to place recent climate changes in the context of variability as experienced over the last 6000 years(Van der Puttenet al2012).
Whilst the South Atlantic Falkland Islands and South Georgia lie outside the ‘hotspot’ of late 20th century warming observed over the Antarctic Penin- sula(Vaughanet al2003)and the wider West Antarctic (Steiget al2009), they are highly sensitive to changes in the strength of regional and hemispheric-wide South- ern Hemisphere atmospheric circulation (figure 2) (Turneyet al2016a). Importantly, the south Atlantic region has some of the longest observational records in the Southern Ocean, of which a monthly resolved dataset back to CE 1895 has recently been reported for the Falkland Islands(Lister and Jones2015). This area also has considerable scope for developing peat sequences that capture environmental and climate changes over the last 6000 years. Here we explore the atmospheric drivers of observed climate changes using the ERA-Interim(Dee et al 2011)and ACRE-facili- tated NOAA-CIRES Twentieth Century Reanalysis Project(20CR version 2c) (Compo et al 2011)pro- ducts. We extend the observational record by investi- gating climate-sensitive peat growth on the Falkland Islands and South Georgia over the last 6000 years, thereby placing recent observed warming in the South Atlantic in a multi-millennial context.
2. Data and methods
2.1. Observational record
Meteorological observations on the Falkland Islands commenced at Cape Pembroke Lighthouse around CE 1850 and ended in 1947, with parallel(but discontin- uous)measurements made at Stanley from 1923 until 1986 (Lister and Jones 2015). During the Falkland Islands Conflict(1982) observations were disrupted and the meteorological station relocated to the airport at Mount Pleasant, where measurements were first made in 1986. Recent work by Lister and Jones report an updated climate dataset from the Falkland Islands, combining the above series into one continuous record, commencing from CE 1895 (Brooks 1920, Lister and Jones 2015). In parallel to the Falkland Islands record, South Georgia temperature
observation started with whaling operations on the island from 1905 but experienced significant disrup- tion as a result of the 1982 conflict, with continuous observations not resuming until 2001. Both datasets are available at http://hadobs.metoffice.com/
crutem4/data/download.html. Mean monthly sea level pressure data from Stanley were obtained from sub-daily values(Cramet al 2015, Joneset al2016), available online at http://cru.uea.ac.uk/cru/data/
tpi/ and from the International Surface Pressure Databank on request (https://reanalyses.org/
observations/international-surface-pressure- databank), the latter hosted by the National Oceanic and Atmospheric Administration (NOAA) National Centers for Environmental Information(NCEI). The surface pressure data has been gathered through international cooperation facilitated by the interna- tional Atmospheric Circulation Reconstructions over the Earth (ACRE) initiative and other contributing organisations, assembled under the auspices of the Global Climate Observing System(GCOS)Working Group on Surface Pressure and the World Climate Research Programme/GCOS Working Group on Observational Data Sets for Reanalysis by NOAA Earth System Research Laboratory(ESRL), NCEI, and the University of Colorado’s Cooperative Institute for Research in Environmental Sciences (CIRES). The sub-daily pressure series was checked for gross errors by looking at pressure differences between adjacent readings. If pressure differences were large, they were compared to adjacent readings and any other available weather information. Individual readings were removed where the indications pointed towards an error.
2.2. Proxy data
Three peat sequences were cored on two South Atlantic islands: an Ericaceous-grass dominated peat- land on Canopus Hill, above Port Stanley Airport, Falkland Islands (a 1.6 m sequence at 51.691°S, 57.785°W, approximately 30 m above sea level), and moss speciesPolytrichum strictumandChorisodontium aciphyllum-dominated peat in both King Edward Cove, Cumberland Bay, South Georgia (a 0.8 m sequence at 54.293°S, 36.494°W, approximately 5 m above sea level)and Junction Valley, South Georgia(a 0.70 m sequence at 54.298°S, 36.524°W, approxi- mately 80 m above sea level) (figure1). The two South Georgian sites are particularly susceptible to föhn winds that can exaggerate surface warming(Bannister and King 2015). Each sequence was contiguously sampled (every centimetre)for total organic carbon (%TOC) and nitrogen, determined using a LECO TruSpec CN analyser at the University of New South Wales Analytical Centre following standard techni- ques(Harriset al2001). Comprehensive dating of the sequences(see details below)allowed us to reconstruct changes in the carbon flux (the amount of carbon
sequestered) in each of the peat sequences using a method that takes into account the bulk density through each profile(Cannellet al1993).
To provide a robust geochronological framework we undertook a multidating programme, using a com- bination of radiocarbon dating of terrestrial plant macrofossils and137Cs in the peat. Terrestrial plant macrofossils (seeds and leaves) were extracted from the peat sequences and given an acid-base-acid pre- treatment and then combusted and graphitized in the University of Waikato AMS laboratory, with14C/12C measurement by the University of California at Irvine (UCI)on a NEC compact(1.5SDH)AMS system. The pretreated samples were converted to CO2by combus- tion in sealed pre-baked quartz tubes, containing Cu and Ag wire. The CO2was then converted to graphite using H2and a Fe catalyst, and loaded into aluminum target holders for measurement at UCI. This was sup- plemented by137Cs measurements down the profile to detect the onset of nuclear tests.137Cs analysis was undertaken following standard techniques with mea- surements made using an ORTEC high-resolution, low-background coaxial germanium detector at the University of Exeter(Mitchellet al1992, MacKenzie et al1997). Detectable measurements of137Cs were used for further age control (Leslie and Hancock2008).
The radiocarbon and 137Cs ages were used to develop an age model using a P_sequence deposition model in OxCal 4.2(Bronk Ramsey2008); with vari- able atmospheric 14C over the Southern Ocean (Turneyet al2016b)we undertook RScaled Outlier analysis detection(probability=0.05) (Bronk Ram- sey2009). The 14C ages were calibrated against the Southern Hemisphere (SHCal13) and Bomb04SH calibration datasets(Hua and Barbetti 2004, Hogg et al2013)with the prior U(1952, 2011)used to cap- ture the range of dates for the onset of137Cs deposi- tion in each sequence(Hancocket al 2011). Using Bayes’ theorem, the algorithms employed sample possible solutions with a probability that is the pro- duct of the prior and likelihood probabilities. Taking into account the deposition model and the actual age measurements, the posterior probability densities quantify the most likely age distributions; the outlier option was used to detect ages that fall outside the calibration model for each group, and if necessary, down-weight their contribution to thefinal age esti- mates. Modelled ages reported in the text are descri- bed as thousands of calendar years BP or cal BP (table1).
To investigate whether the changes in peat growth may reflect some natural long-term forcing we undertook tipping point analysis. This technique is based on the fact that abrupt climate changes, if characterised by long-term forcing prior to reaching a tipping point in the system dynamics, can be math- ematically detected by looking at the pattern offluc- tuations in the short-term trends of the data before
the shift takes place(Dakoset al2008). This is based on the concept of‘critical slowing down’, where on the approach to such an abrupt shift, the equilibrium state of the system takes increasingly longer to recover from small perturbations (Held and Klei- nen2004, Dakoset al2012). This increased recovery time is detected as a short-term increase in the lag-1 autocorrelation or ‘memory’ of the time series (Ives1995). An increasing trend in variance is also often found due to the ability of the system to travel farther from its equilibrium point as the basin of attraction(which describes the stability of the sys- tem)shallows and widens(Lentonet al2012). Some data pre-processing can be undertaken, including detrending to remove non-stationarities, and inter- polation to make the data equidistant. The analysis was carried out with and without this pre-processing, as when there is a relative sparseness of data points, and/or if there is no obvious long-term trend, inter- polation and detrending can bias the analysis(Dakos et al 2012). Autocorrelation at lag-1 and variance were then measured over a sliding window of 50% of the length of the dataset, using the R functions ar.ols ()and var()respectively. The Kendall tau rank corre- lation coefficient is used to provide a quantitative measure of the trend(Kendall1948)by assessing the predominance of concordant pairs, providing an objective evaluation of the statistical evidence for the trend.
3. Results and discussion
3.1. Observational period
The South Atlantic climate series from South Georgia and the Falklands provides a valuable record of climate change in the mid-latitudes of the Southern Hemi- sphere(figure2). While spring–summer(September– February) temperature trend records a relatively modest long-term increase on both islands(figure3), the complete annual Falklands record captures a highly statistically significant warming of 0.5°C/
century from CE 1910–2010(p=0.002) (Lister and Jones2015). Where there is overlapping observational data(1905–2011), the deseasonalised and detrended temperature trends on the Falkland Islands and South Georgia are statistically similar(r=0.506,p<0.0001), demonstrating a coherent change across the region.
Importantly, while there does appear to be a long-term warming trend, climate regime analysis of the pre- cipitation dataset(Rodionov2004)identifies a signifi- cant(90% confidence)and substantial step-change to sustained wetter conditions in the mid-1940s(repre- senting a 23% increase). The observed change to wetter conditions followed a short-lived period of higher temperatures observed across South America and the Antarctic Peninsula(Turneret al2005, Schnei- der and Steig2008) (figure3).
The increases in South Atlantic temperature and precipitation do not appear to have been accom- panied by any long-term change in local mean sea
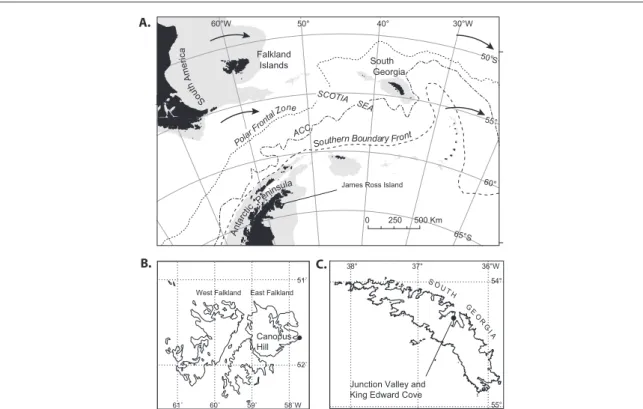
Figure 1.Location of the Falkland Islands and South Georgia in the South Atlantic Ocean with mean locations of the Polar and Southern boundary fronts(dashed lines), the continental shelf(grey areas)and prevailing westerly airflow(solid arrows) (panel A); modified from Strotheret al(2015). Reprinted by permission of SAGE Publications, Ltd. Canopus Hill, Port Stanley Airport, in the east Falkland Islands(panel B). Junction Valley and King Edward Cove, in South Georgia(panel C).
level pressure in spite of the regional(Visbeck2009) and hemispheric-wide(Marshall2003)atmospheric circulation changes represented by the recent posi- tive SAM index values(figure3). Crucially, although the multi-decadal trend to more positive SAM and the deepening of the Amundsen Sea Low(ASL)has taken place since the mid-20th century (Fogt et al2012, Hoskinget al2013), increasing northerly airflow (and temperature) over the region (Abram et al2014, Lister and Jones 2015)and reanalysis of late 20th century atmospheric circulation in both the
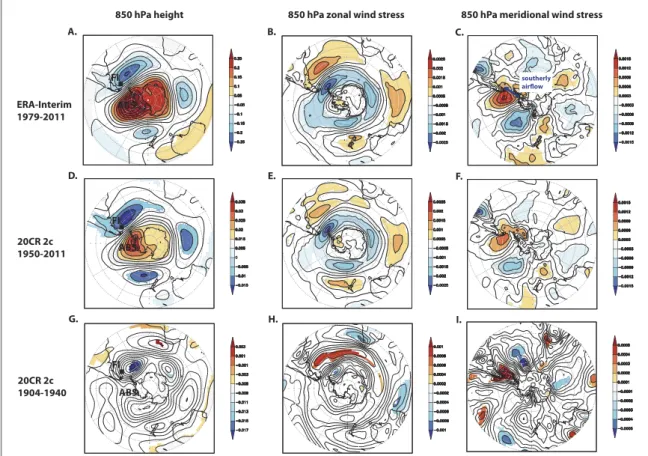
ERA-Interim (Dee et al 2011) and the 20CR 2c (Compoet al2011)suggests wetter conditions have the opposite relationship(figures4(A)–(F)). Here we find high rainfall over the subantarctic islands is asso- ciated with conditions that comprise both relatively low pressure in the South Atlantic and high pressure over the Bellingshausen and Amundsen seas(rather than a weakening); a configuration that enhances meridional airflow across the region, delivering moist southerly air masses over the islands, with wes- terly winds displaced to the north.
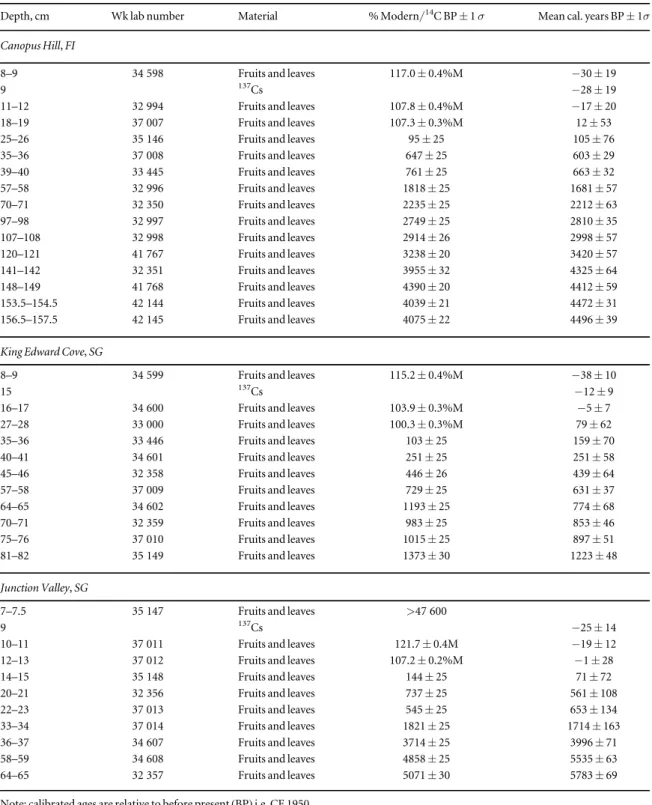
Table 1.Radiocarbon and modelled calibrated age ranges for peat sequences on the Falkland Islands(FI)and South Georgia(SG)using SHCal13(Hogget al2013)and Bomb04SH(Hua and Barbetti2004)using the P_sequence and Outlier analysis option in OxCal 4.2(Bronk Ramsey2008, Bronk Ramsey and Lee2013).
Depth, cm Wk lab number Material % Modern/14C BP±1σ Mean cal. years BP±1σ
Canopus Hill,FI
8–9 34 598 Fruits and leaves 117.0±0.4%M −30±19
9 137Cs −28±19
11–12 32 994 Fruits and leaves 107.8±0.4%M −17±20
18–19 37 007 Fruits and leaves 107.3±0.3%M 12±53
25–26 35 146 Fruits and leaves 95±25 105±76
35–36 37 008 Fruits and leaves 647±25 603±29
39–40 33 445 Fruits and leaves 761±25 663±32
57–58 32 996 Fruits and leaves 1818±25 1681±57
70–71 32 350 Fruits and leaves 2235±25 2212±63
97–98 32 997 Fruits and leaves 2749±25 2810±35
107–108 32 998 Fruits and leaves 2914±26 2998±57
120–121 41 767 Fruits and leaves 3238±20 3420±57
141–142 32 351 Fruits and leaves 3955±32 4325±64
148–149 41 768 Fruits and leaves 4390±20 4412±59
153.5–154.5 42 144 Fruits and leaves 4039±21 4472±31
156.5–157.5 42 145 Fruits and leaves 4075±22 4496±39
King Edward Cove,SG
8–9 34 599 Fruits and leaves 115.2±0.4%M −38±10
15 137Cs −12±9
16–17 34 600 Fruits and leaves 103.9±0.3%M −5±7
27–28 33 000 Fruits and leaves 100.3±0.3%M 79±62
35–36 33 446 Fruits and leaves 103±25 159±70
40–41 34 601 Fruits and leaves 251±25 251±58
45–46 32 358 Fruits and leaves 446±26 439±64
57–58 37 009 Fruits and leaves 729±25 631±37
64–65 34 602 Fruits and leaves 1193±25 774±68
70–71 32 359 Fruits and leaves 983±25 853±46
75–76 37 010 Fruits and leaves 1015±25 897±51
81–82 35 149 Fruits and leaves 1373±30 1223±48
Junction Valley,SG
7–7.5 35 147 Fruits and leaves >47 600
9 137Cs −25±14
10–11 37 011 Fruits and leaves 121.7±0.4M −19±12
12–13 37 012 Fruits and leaves 107.2±0.2%M −1±28
14–15 35 148 Fruits and leaves 144±25 71±72
20–21 32 356 Fruits and leaves 737±25 561±108
22–23 37 013 Fruits and leaves 545±25 653±134
33–34 37 014 Fruits and leaves 1821±25 1714±163
36–37 34 607 Fruits and leaves 3714±25 3996±71
58–59 34 608 Fruits and leaves 4858±25 5535±63
64–65 32 357 Fruits and leaves 5071±30 5783±69
Note: calibrated ages are relative to before present(BP)i.e. CE 1950.
Whilst the ASL is generally considered quasi-sta- tionary because of the large number of low pressure systems in this sector of the circumpolar trough, they are by no means permanent(Hoskinget al2013). With large variability in pressure systems across the region on daily to seasonal timescales, our analysis suggests that when both low pressure is present over the South Atlantic and high pressure is found west of the Penin- sula, more rainfall is delivered to the subantarctic islands and across the wider southern South America (figures4(A)–(F)).
Reconciling the 1940s stepped increase in Falkland Islands’ precipitation with the above association of pressure systems across the South Atlantic and Penin- sula is not immediately apparent. To investigate the synoptic conditions for thefirst half of the Port Stanley record(CE 1904–1940)we interrogated the 20CR 2c (figures4(G)–(I)) (Compoet al2011, Cramet al2015).
Whilst the observational record that contributes to the high-latitudes of the Southern Hemisphere is rela- tively sparse during the early 20th century (Jones et al2016), wefind Falkland Islands precipitation was similarly driven by southerly airflow(figure4(I)). In marked contrast to the last seventy years, however, the synoptic configuration appears to have been different.
Crucially, during thefirst half of the 20th century there appears to have been no dynamic link with pressure over the Amundsen and Bellingshausen Seas. Instead, high precipitation before the mid-1940s was solely
influenced by the South Atlantic pressure system centred over South Georgia(figure4(G))with return northerly airflow strengthened out to the east (figure4(I)). The ASL is a semi-permanent feature, a consequence of the Antarctic Peninsula and regional topography that dynamically influences atmospheric flow in the southeast Pacific sector of the Southern Ocean (Fogt et al 2012), suggesting a fundamental change in atmospheric circulation took place across the 1940s that brought the South Atlantic into the sphere of influence of this dynamic feature. The
‘absence’ of a role for pressure changes over the Amundsen and Bellingshausen Seas prior to the 1940s appears to have limited precipitation over the islands.
Several physical mechanisms need to be con- sidered to understand the circulation changes. One possible cause may be related to the release of CFCs that started in the 1920s, though measurable ozone depletion was not observed until the 1980s(Thomp- son et al 2011). Alternatively, the changes may be linked to expansion of the tropical belt and Hadley cir- culation(Seidelet al2008)which have recently been reported to have shifted south since the 1940s (Brönnimannet al2015, Nguyenet al 2015), poten- tially affecting circulation across the mid-latitudes.
Additionally, during at least the last four decades the Antarctic Peninsula region is known to be sensitive to tropical Pacific temperatures that generate an atmo- spheric Rossby wave response (Yuan 2004, Compo
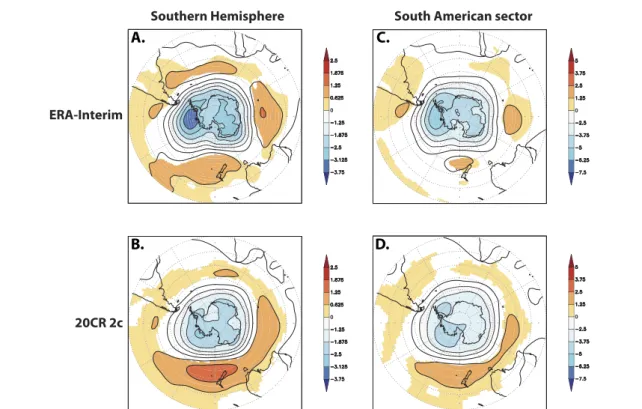
Figure 2.Regressions of deseasonalised and detrended mean sea level pressure(MSLP)on hemispheric-wide(Marshall2003) (panels A and B)and South American(Visbeck2009) (panels C and D)annual(July–June)southern annular mode(SAM)using ERA-Interim (post-1979; panels A and C) (Deeet al2011)and 20CR 2c(post-1957; panels B and D) (Compoet al2011). Scale on right hand side in each panel: hPa per unit of SAM. Significancepfield<0.1%. Analyses were made with KNMI Climate Explorer(van Oldenborgh and Burgers2005).
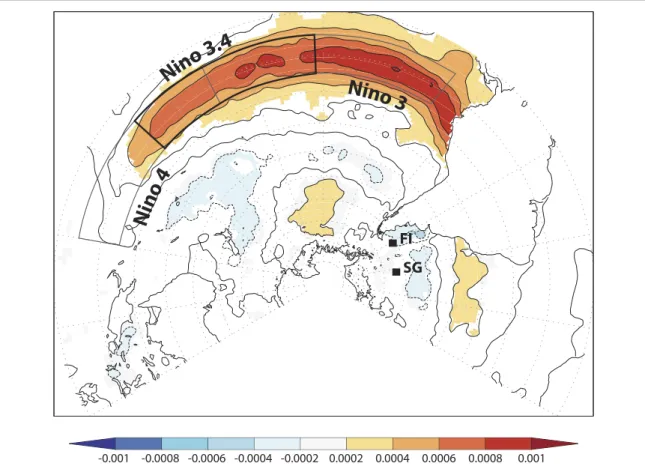
and Sardeshmukh 2010, Gordon et al 2010, Steig et al2013, Turneyet al 2015), causing anomalously high pressure over the Amundsen and Bellingshausen Seas, and enhancing southerly(colder)airflow across the Weddell Sea and South Atlantic (Abram et al2014). To investigate a possible role for the tropi- cal Pacific in atmospheric circulation changes over the South Atlantic, we regressed the Port Stanley pre- cipitation record against the post-1950 HadISST sea surface temperature dataset(Rayneret al2003)and find a highly significant relationship with the tropical Pacific (figure 5). Specifically, high precipitation is associated with warmer temperatures in the central and eastern Pacific(Nino 3.4 and 3 regions), with zero lag. Our results imply the step change to wetter condi- tions across the 1940s marked a threshold after which low-latitude climate variability was more strongly pro- jected on the South Atlantic, consistent with previous studies suggesting disproportionate remote impacts of tropical Pacific temperature changes (Sardeshmukh et al2000).
Although further work is needed to increase the density of early observations in reanalysis products, our results are consistent with the stepped change to wetter conditions from the mid-1940s(figure3)and suggests this came about from a change in circulation across the mid-latitudes of the Southern Hemisphere (possibly linked to increasing sea surface temperatures in the tropical Pacific)that allowed the influence of synoptic conditions in the Amundsen and Belling- shausen seas to align with those over the South Atlantic.
3.2. Proxy records of past change
Comprehensive radiocarbon and137Cs dating of the subantarctic sequences (table 1) provides a robust geochronological framework for reconstructing change across the region. The Junction Valley sequence preserves a record of more than 6000 years, with Canopus Hill extending over 4000 years(figure6).
The youngest record is the relatively low-lying King Edward Cove that captures changes in peat growth
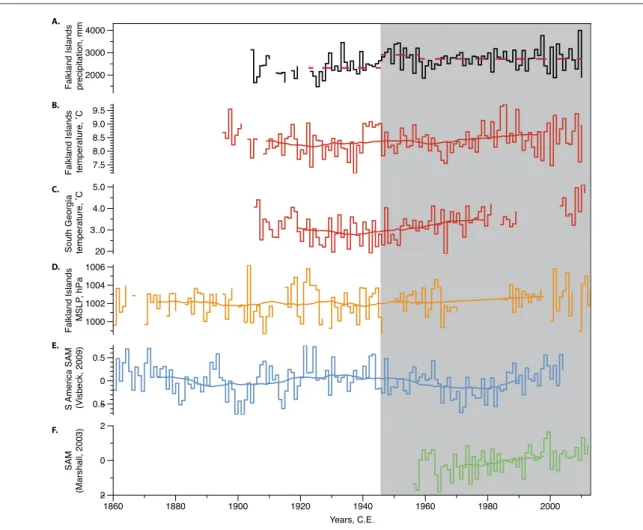
Figure 3.Late 19th and 20th century climate trends in the South Atlantic. Port Stanley(Falkland Islands)Spring/Summer
(September–February)precipitation(black line)and temperature(red line) (Lister and Jones2015) (panels A and B). Grytviken(South Georgia)Spring/Summer(September–February)temperature(panel C). Combined Cape Pembroke–Stanley Spring/Summer (September–February)mean sea level pressure(panel D). Annual(July–June)South American(Visbeck2009)and hemispheric-wide (Marshall2003)reconstructions of the southern annular mode index(panels E and F, respectively). 30 year running means shown in bold(note: due to data gaps, not all running means extend across the full period). Climate regime analysis of the Port Stanley Spring/ Summer precipitation record identifies a shift during the mid-1940s(dashed lines) (Rodionov2004). Grey column denotes the period since the shift to higher precipitation.
during the past 1200 years. Fortunately, the rapid and dramatic increase in atmospheric14C as a consequence of nuclear tests(the so-called‘bomb’spike) (Hua and Barbetti 2004) and the associated increase in 137Cs (with a half-life of 30 years) (Leslie and Hancock2008) provide two independent time-parallel marker hor- izons in each sequence(figure6). The %TOC values for the three sitesfluctuate around 40%–50%, which is typical of cold climate Holocene peats(Vittet al2000, Beilmanet al2009, Nakatsuboet al2015). The carbon:
nitrogen(C:N)profiles are also broadly comparable across the three sites with values ranging from∼30 to 40. Subtle down corefluctuations in the TOC% and C:
N records most likely reflect past hydrological change impacting humification rates(Kuhry and Vitt1996, Anderson2002). The relative complacency of both the TOC% and C:N records down profile across the three sites highlights the long-term geomorphic stability of each bog catchment, with no evidence for significant periods of inwash.
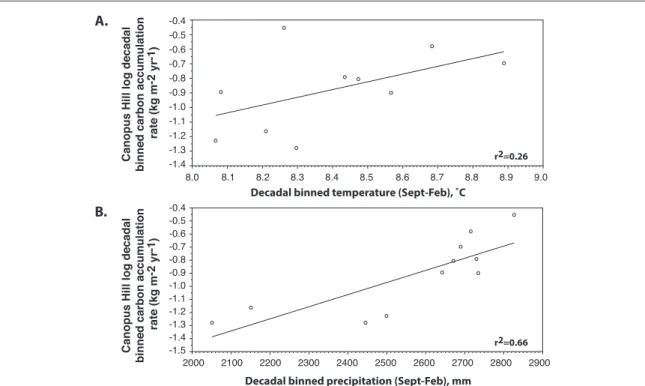
To investigate the role of temperature and pre- cipitation on peat growth (MacDonald et al 2006, Dise2009, Loisel and Yu2013), we interrogated the highest resolution record with the most complete cli- mate dataset(figure7). The carbon accumulation rate
from Canopus Hill(Falkland Islands)was binned at decadal resolution across the 20th century and log transformed. Whilst higher mean spring–summer (September–February) temperatures are associated with increased accumulation(r2=0.26), the strongest relationship is observed with cumulative spring–sum- mer precipitation(r2=0.66), suggesting the delivery of moisture across the growing season is the primary driver of growth. The implication is following recharge of water table levels by moisture-laden south- erly airmasses, warmer spring/summer conditions encourages further growth.
Crucially, all three sequences record a dramatic increase in peat growth and carbon sequestration that commenced immediately prior to the 1950s onset of nuclear tests(figure8). The same trend is observed in all three sequences using the method reported by(Yu et al 2003) (data not shown). The Canopus Hill sequence on the Falklands records the greatest increase with a tenfold increase in accumulation across the 20th century, with a pronounced peak com- mencing in the 1940s. Similar increases in accumula- tion are also recorded in the South Georgia sequences, with a threefold increase in King Edward Cove and a sixfold increase in Junction Valley. The increase in
Figure 4.Changing atmospheric circulation during the mid-20th century. Regressions of deseasonalised and detrended 850 hPa pressure(panel A), zonal(panel B)and meridional(panel C)wind stress(ms−1)on summed Falkland Islands(FI; Port Stanley) Spring/Summer(September–February)precipitation(ERA-Interim 1979–2011). Scale on right hand side of each panel: hPa mm−1 (left column)and ms−1mm−1(middle and right columns).‘ABS’denotes the Amundsen and Bellingshausen Seas. A comparable relationship is also observed across 1950–2011 using 20th Century Reanalysis 2c(panels D, E and F, respectively). Note, the change in relationship between Spring/Summer precipitation and deseasonalised and detrended 850 hPa pressure(panel G), zonal(panel H) and meridional wind stress(panel I) (20CR 2c)across the 1940s. Significancepfield<0.1%. Analyses were made with KNMI Climate Explorer(van Oldenborgh and Burgers2005).
peat growth is consistent with the observational record showing a stepped increase to sustained higher pre- cipitation during the 1940s (figure 3). The greatest accumulation of peat at this time supports precipita- tion as a key driver of growth on the islands, supported by warmer temperatures(figure7). At no other time over the past 6000 years do we observe a comparable rate of peat growth as the mid- to late-20th century (figure8).
To investigate whether changes in the peat accu- mulation might reflect long-term forcing we under- took tipping point analysis(figure9). In a long-term forcing scenario, the leading early warning indicators of critical slowing down (autocorrelation and var- iance)would be expected to increase, as the basin of attraction of the system widens and shallows. If, on the other hand, there is no underlying long-term forcing, these indicators would show no trend. Our tipping point analysis on the three peat sequences from the Falklands and South Georgia show no consistent par- allel increase in autocorrelation or variance, under all pre-processing scenarios(figure9), arguing against a long-term forcing that led to a shift in the climate sys- tem. These results are consistent regardless of the sam- pling resolution of the record; the Canopus Hill sequence, with the highest resolution averaging 30 years, shows negative trends for autocorrelation
and variance. The abrupt acceleration in peat growth is therefore more likely to be the result of a short-term or noise-induced change, consistent with the observed relatively abrupt nature of wetter conditions across this region.
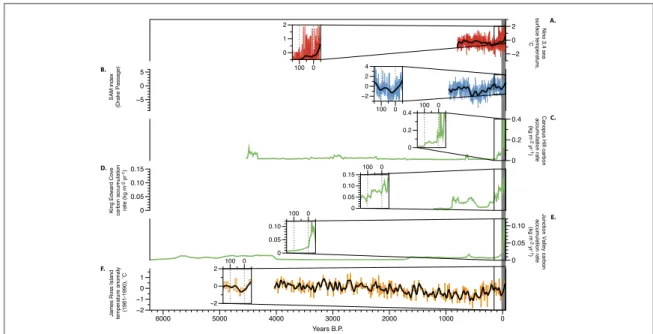
Our results identify a shift in atmospheric circula- tion across the mid latitudes of the Southern Hemi- sphere in the 1940s that appears anomalous in the context of the last six millennia. Thisfinding is con- sistent with other records spanning the mid to late Holocene. Recent work using proxy data has argued that the trend to positive SAM since the 1940s is unprecedented over the past millennia(figure 8(B)) (Villalbaet al2012, Abramet al2014), providing war- mer air masses over the South Atlantic subantarctic islands that would have helped drive peat growth (figure7). Curiously, whilst the James Ross Island ice core record on the Antarctic Peninsula suggests an exceptional rate of warming in the 20th century(Mul- vaneyet al2012)it does not preserve the highest abso- lute temperatures across this period (figure 8(F)) suggesting absolute temperatures may have been offset by enhanced southerly airflow as implied by the South Atlantic subantarctic islands(figures8(C)–(E)). This interpretation is supported by a multi-proxy recon- struction of Nino 3.4 temperatures for the last millen-
nium (Emile-Geay et al 2013) which shows
Figure 5.Tropical teleconnection with the South Atlantic in the second half of the 20th Century. Regression of deseasonalised and detrended sea surface temperatures(°C; HadISST)on summed Falkland Islands(FI; Port Stanley)Spring/Summer(September– February)precipitation(mm)since 1950(Rayneret al2003). Scale:°C mm−1. Location of South Georgia(SG)and El Niño regions 3, 3.4 and 4 also shown. Significancepfield<0.1%. Analyses were made with KNMI Climate Explorer(van Oldenborgh and
Burgers2005).
unprecedented warming in the central tropical Pacific since the mid-20th century(figures8(A)), consistent with higher pressure in the Amundsen and Belling- shausen seas and enhanced southerly airflow over the region (Yuan 2004, Gordon et al 2010, Abram et al2014). The dramatic increase in precipitation and associated peat growth therefore implies a threshold in the global climate system was passed during the 1940s that is without parallel in the last 6000 years. If correct, the south Atlantic region may indeed be one of thefirst to have experienced the effects of anthropogenic cli- mate change(Kinget al2015).
4. Conclusions
Historic observations suggest unusual climate changes in the South Atlantic during the latter half of the 20th century. Whilst not of the magnitude of warming observed over the Antarctic Peninsula, historic obser- vations and well-dated proxy sequences provide the opportunity to test whether the climate changes across the region are exceptional. Focusing on the last 6000 years, during which near-contemporary climate conditions were established, we investigated monthly observational records from the Falklands and South Georgia to derive an understanding of the physical processes driving modern climate. We explored these changes in the context of the last 6000 years using three highly-resolved and multi-dated peat sequences that are sensitive to precipitation and temperature changes.
Wefind an order of magnitude increase in peat growth coincided with a stepped shift to sustained wetter conditions in the 1940s. However, the changes
Figure 6.Lithostratigraphy, age-depth model(blue envelope denotes 1σrange), % total organic carbon(%TOC)and C:N content of peat sequences from Canopus Hill(Falkland Islands), King Edward Cove and Junction Valley(South Georgia). Dash lines denote stratigraphic location of measur- able137Cs in each sequence. The blue envelope captures the 95% confidence interval for each age model. Grey column denote the increase in peat(and carbon)accumulation.
Figure 7.Relationship between 20th century decadally-binned carbon accumulation rate(logged)and Spring/Summer temperature (panel A)and total precipitation(panel B)at Canopus Hill(Falkland Islands).
preserved on the subantarctic islands cannot be explained by a simple latitudinal shift in zonal airflow, rather a realignment of synoptic conditions across the mid-latitudes that appears linked to tropical Pacific
temperature changes. The changes observed on the South Atlantic subantarctic islands are unprecedented in the context of the last 6000 years and suggest the regional circulation changes being experienced today
Figure 8.Comparison between Nino 3.4 sea surface temperature(SSTs)over the last millennium(panel A) (Emile-Geayet al2013), southern annular mode(SAM)for the Drake Passage(panel B) (Abramet al2014), carbonflux on the Falkland Islands(Canopus Hill;
panel C)and South Georgia(King Edward Cove, panel D and Junction Valley, panel E), and James Ross Island(JRI)temperature anomalies(panel F) (Mulvaneyet al2012). A 50 year locally weighted smoothing(LOESS)curve wasfitted to the Nino 3.4, SAM and JRI datasets(black lines). Grey column defines anomalously growth rate in peat post-1940s relative to 6000 year record. Inset panels show climate changes and acceleration in carbon sequestration since the mid-20th century.
Figure 9.Tipping point analysis for carbonflux(left panels)autocorrelation and(right panels)variance and corresponding Kendall tau values of the Falkland Islands(Canopus Hill, panels A and B)and South Georgia(King Edward Cove, panels C and D, and Junction Valley, panels E and F). Black lines show results from no detrending or interpolation, blue lines show detrending only, and green lines show both detrending and interpolation.
are anthropogenic in origin. If the trends reported here persist, it seems probable that exceptionally high growth rates of peat sequences will continue in the region accompanied by continuing widespread glacier and sea ice retreat across the Antarctic Peninsula.
Importantly, our results also note a word of caution in the use of post-1950 proxy-climate relationships for the reconstruction of modes of variability, suggesting teleconnections were not stable across the 20th century.
Acknowledgments
CSMT and CF acknowledge the support of the Australian Research Council (FL100100195, FT120100004 and DP130104156). A big thanks to the captain and crew of the Fishery Patrol Vessel The Pharosfor travel to and from South Georgia. We thank the Government of South Georgia and the South Sandwich Islands, and the Falkland Islands Govern- ment for permission to undertake sampling on the island(permit numbers SGEP0110/11 and R07/2011 respectively)and Darren Christie for assisting with the fieldwork on the Falkland Islands. Sarah Kelloway and Charlotte Cook(UNSW)helped process the samples for TOC analysis; Christopher Bronk Ramsey(Oxford University)kindly provided guidance on OxCal mod- elling. Rob Allan is supported by a combination of funding from the Joint DECC/Defra Met Office Hadley Centre Climate Programme (GA01101), the European Union’s Seventh Framework Programme (FP7)European Reanalysis of Global Climate Obser- vations 2 (ERA-CLIM2) project and the Climate Science for Service Partnership(CSSP)China under the Newton Fund. Gail Kelly kindly digitised the Cape Pembroke surface pressure data. The NOAA-CIRES Twentieth Century Reanalysis Project version 2c used resources of the National Energy Research Scientific Computing Center managed by Lawrence Berkeley National Laboratory which is supported by the Office of Science of the US Department of Energy under Contract No. DE-AC02-05CH11231. Support for the Twentieth Century Reanalysis Project version 2c dataset is provided by the US Department of Energy, Office of Science Biological and Environmental Research (BER), and by the National Oceanic and Atmospheric Administration Climate Program Office.
Two anonymous reviewers kindly improved an earlier draft of this manuscript.
References
Abram N J, Mulvaney R, Vimeux F, Phipps S J, Turner J and England M H 2014 Evolution of the Southern annular mode during the past millenniumNat. Clim. Change4564–9 Anderson D E 2002 Carbon accumulation and C/N ratios of peat
bogs in North‐West ScotlandScottish Geogr. Mag.118 323–41
Bannister D and King J 2015 Föhn winds on South Georgia and their impact on regional climateWeather70324–9
Beilman D W, MacDonald G M, Smith L C and Reimer P J 2009 Carbon accumulation in peatlands of West Siberia over the last 2000 yearsGlob. Biogeochem. Cycles23GB1012 Bronk Ramsey C 2008 Radiocarbon dating: revolutions in
understandingArchaeometry50249–75
Bronk Ramsey C 2009 Dealing with outliers and offsets in radiocarbon datingRadiocarbon511023–45
Bronk Ramsey C and Lee S 2013 Recent and planned developments of the program OxCalRadiocarbon55720–30
Brönnimann S, Fischer A M, Rozanov E, Poli P, Compo G P and Sardeshmukh P D 2015 Southward shift of the northern tropical belt from 1945 to 1980Nat. Geosci.8969–74 Brooks C E P 1920Geophysical Memoirs(London: Meteorological
Office)pp 97–146
Cannell M G R, Dewar R C and Pyatt D G 1993 Conifer plantations on drained peatlands in Britain: a net gain or loss of carbon?
Forestry66353–69
Compo G P and Sardeshmukh P D 2010 Removing ENSO-related variations from the climate recordJ. Clim.231957–78 Compo G Pet al2011 The twentieth century reanalysis projectQ. J.
R. Meteorol. Soc.1371–28
Convey P, Hopkins D W, Roberts S J and Tyler A N 2011 Global southern limit offlowering plants and moss peat accumulationPolar Res.308929
Cook A J, Poncet S, Cooper A P R, Herbert D J and Christie D 2010 Glacier retreat on South Georgia and implications for the spread of ratsAntarctic Sci.22255–63
Cram T A, Compo G P, Yin X, Allan R J, McColl C, Vose R S, Whitaker J S, Matsui N, Ashcroft L and Auchmann R 2015 The international surface pressure databank version 2Geosci.
Data J.231–46
Dakos V, Carpenter S R, Brock W A, Ellison A M, Guttal V, Ives A R, KefiS, Livina V, Seekell D A and van Nes E H 2012 Methods for detecting early warnings of critical transitions in time series illustrated using simulated ecological dataPLoS One7 e41010
Dakos V, Scheffer M, van Nes E H, Brovkin V, Petoukhov V and Held H 2008 Slowing down as an early warning signal for abrupt climate changeProc. Natl Acad. Sci. USA105 14308–12
Dee D Pet al2011 The ERA-Interim reanalysis: configuration and performance of the data assimilation systemQ. J. R. Meteorol.
Soc.137553–97
deMenocal P, Ortiz J, Guilderson T and Sarnthein M 2000 Coherent high- and low-latitude climate variability during the Holocene warm periodScience2882198–202
Dise N B 2009 Peatland response to global changeScience326810–1 Domack E, Duran D, Leventer A, Ishman S, Doane S, McCallum S,
Amblas D, Ring J, Gilbert R and Prentice M 2005 Stability of the Larsen B ice shelf on the Antarctic Peninsula during the Holocene epochNature436681–5
Emile-Geay J, Cobb K M, Mann M E and Wittenberg A T 2013 Estimating central equatorial Pacific SST variability over the past millennium: II. Reconstructions and implications J. Clim.262329–52
Fogt R L, Wovrosh A J, Langen R A and Simmonds I 2012 The characteristic variability and connection to the underlying synoptic activity of the Amundsen–Bellingshausen Seas Low J. Geophys. Res.: Atmos.117D07111
Franzke C 2012 Significant reduction of cold temperature extremes at Faraday/Vernadsky station in the Antarctic PeninsulaInt.
J. Climatol.331070–8
Gordon A L, Huber B, McKee D and Visbeck M 2010 A seasonal cycle in the export of bottom water from the Weddell SeaNat.
Geosci.3551–6
Gordon J E, Haynes V M and Hubbard A 2008 Recent glacier changes and climate trends on South GeorgiaGlob. Planet.
Change6072–84
Hall A and Visbeck M 2002 Synchronous variability in the Southern Hemisphere atmosphere, sea ice, and ocean resulting from the annular modeJ. Clim.153043–57
Hancock G J, Leslie C, Everett S E, Tims S G, Brunskill G J and Haese R 2011 Plutonium as a chronomarker in Australian